Final Design Submission Remedial Design for Bush Valley Landfill Design Analysis Report Prepared for Harford County Department of Public Works 220 South Main Street Bel Air, Maryland 21014 Prepared by EA Engineering, Science, and Technology 15 Loveton Circle Sparks. Maryland21152 (410)771-4950 October 1999 61131 01 AROOOI53
Transcript
Final Design Submission
Remedial Designfor
Bush Valley Landfill
Design Analysis Report
Prepared for
Harford CountyDepartment of Public Works
220 South Main StreetBel Air, Maryland 21014
Prepared by
EA Engineering, Science, and Technology15 Loveton Circle
Sparks. Maryland 21152(410)771-4950
October 1999 61131 01
AROOOI53
Project No. 61131.01
Final Design Submission
Remedial Designfor
Bush Valley Landfill
Design Analysis Report
Prepared for
Harford CountyDepartment of Public Works
220 South Main StreetBel Air, Maryland 21014
Prepared by
EA Engineering, Science, and Technology15 Loveton Circle
Sparks, Maryland 21152(410)771-4950
October 1999
ftROOOISU
CONTENTS
Page
LIST OF FIGURES .........................................................................................................
LIST OF TABLES...........................................................................................................................v
LIST OF ACRONYMS AND ABBREVIATIONS ...................................................................... vi
1. INTRODUCTION..........................
1.1 Project Scope ............................................................................................................. 1-11.2 Site History................................................................................................................ 1-11.3 Existing Conditions.................................................................................................... 1-21.4 Geology and Hydrogeology....................................................................................... 1-3
2.1 Topographic and Property Boundary Survey ............................................................ 2-12.2 Delineation of Waste Limits...................................................................................... 2-12.3 Geotechnical Investigation......................................................................................... 2-22.4 Landfill Gas Migration Investigation......................................................................... 2-32.5 Landfill Gas Production Evaluation........................................................................... 2-5
2.5.1 Potential for Landfill Gas Production............................................................ 2-52.5.2 Potential for Landfill Gas Utilization and Destruction.................................. 2-6
2.6 Monitoring Well Installation...................................................................................... 2-6
2.6.1 Monitoring Well Borings.............................................................................. 2-72.6.2 Monitoring Well Construction....................................................................... 2-82.6.3 Well Development....................................................................................... 2-8
2.9.1 Sampling Program ............„..................................................——............—.2-112.9.2 Analytical Protocols..................................................................."-"...."...—2-122.9.3 Results.....................................................——.-—.—.—....—————.2-13
flROOOISS
CONTENTS (continued)
Page
2.10 Monitoring Well Sampling......................................................................................2-14
2.10.1 Sampling Event One (25-26 August 1998).................................................. 2-162.10.2 Sampling Event Two (6-7 May 1999) .........................................................2-172.10.3 Discussion of Natural Attentuation.............................................................. 2-19
2.11 Air Sampling and Analysis...................................................................................... 2-21
2.11.1 General Field Sampling Procedures............................................................. 2-212.11.2 Field QA/QC (Collocates and Field Blanks)............................................... 2-23
2.12 Site Access and Easement Requirements ................................................................2-24
3. LANDFILL CAP DESIGN.................................................................................................. 3-1
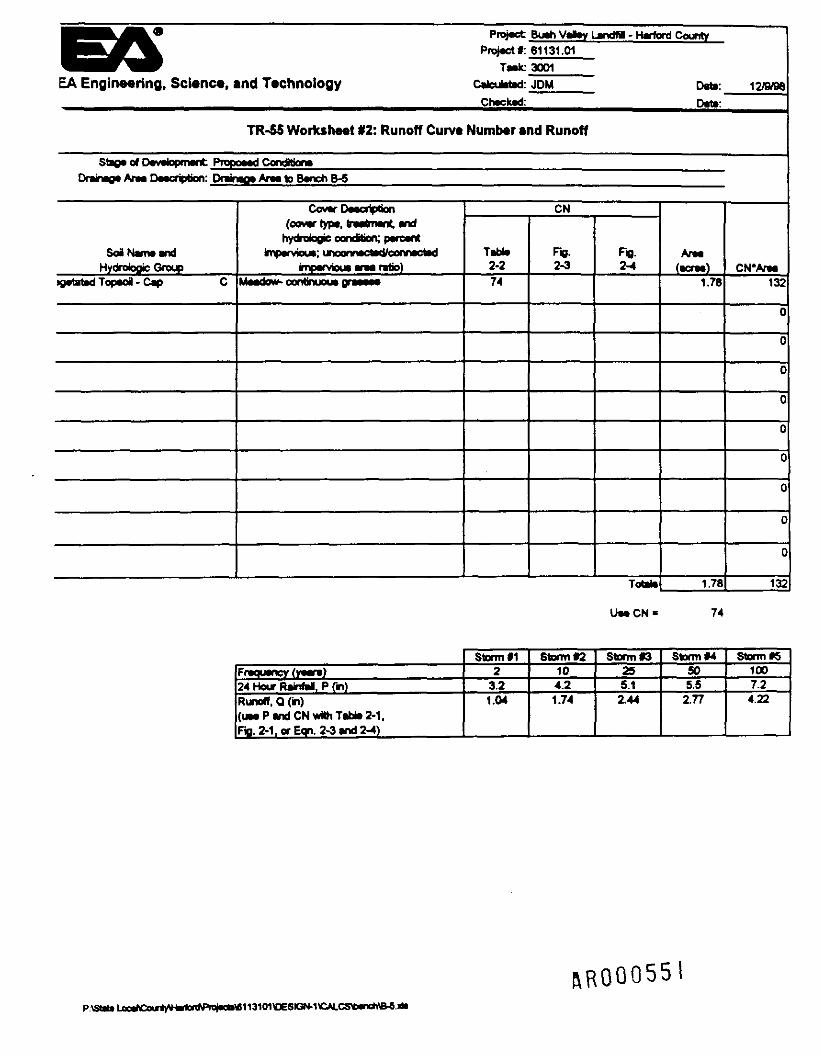
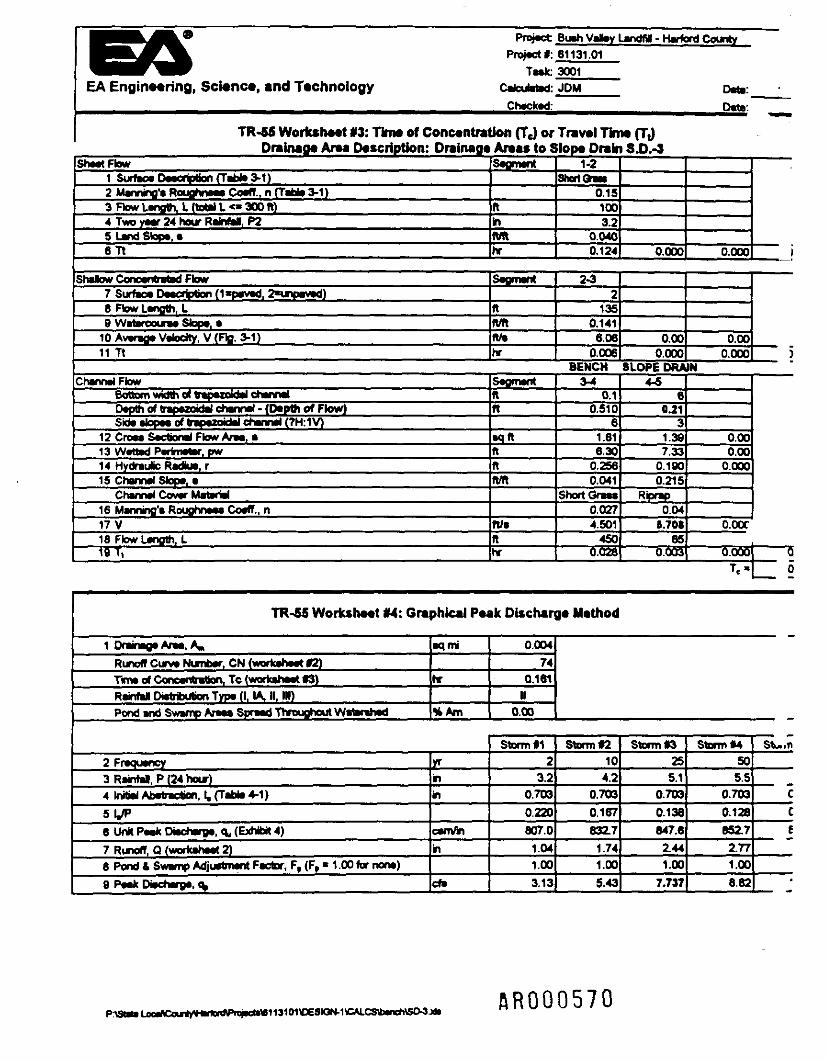
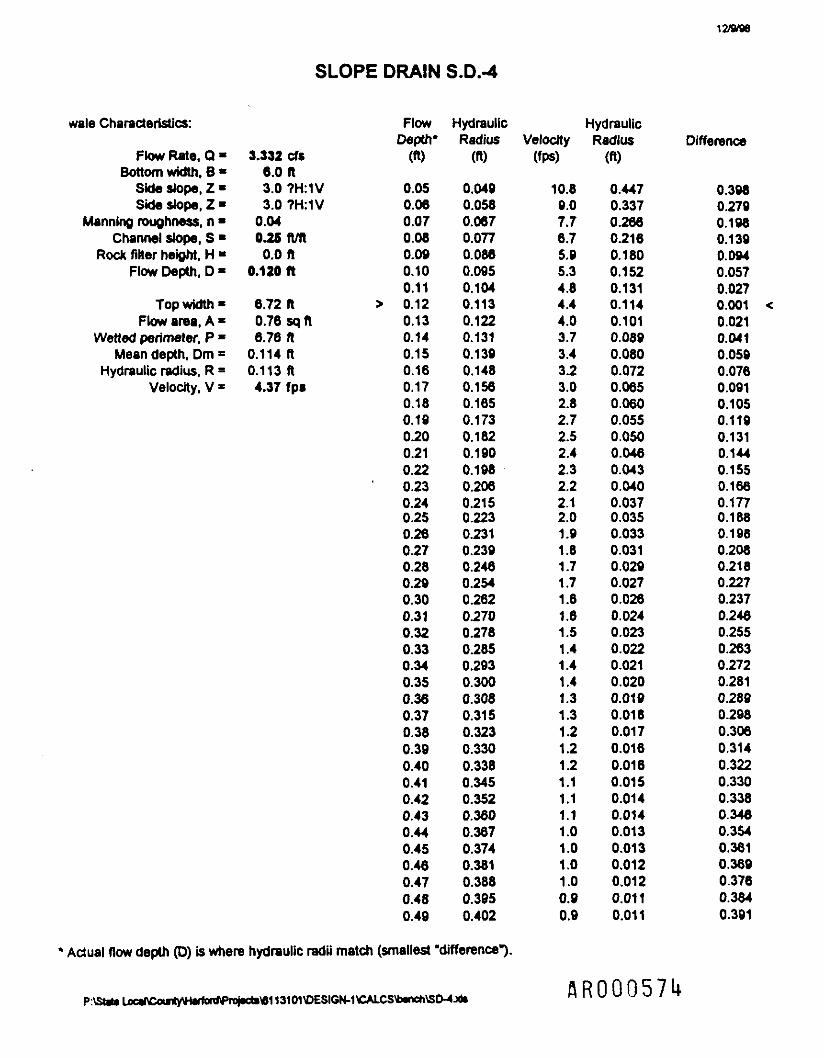
3.1 Scope and Purpose..................................................................................................... 3-13.2 Site Grading...............................................................................................................3-13.3 Stormwater Management and Site Drainage ............................................................. 3-2
3.5 Landfill Gas Management.......................................................................................... 3-8
3.5.1 Passive Gas Venting System.......................................................................... 3-93.5.2 Active Gas Withdrawal System................................................................... 3-113.5.3 Gas Monitoring Program ............................................................................. 3-13
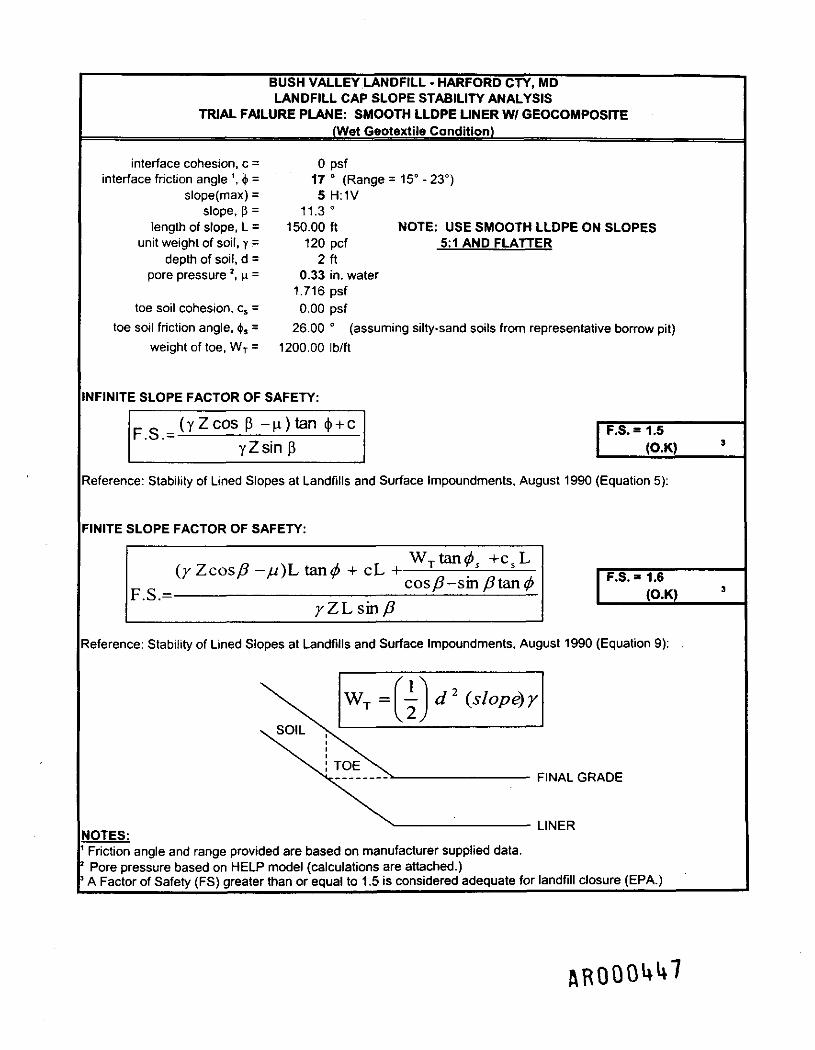
3.6 Slope Stability Considerations................................................................................. 3-133.7 Groundwater Monitoring Program .......................................................................... 3-143.8 Ecological Monitoring Program .............................................................................. 3-143.9 Future Use................................................................................................................ 3-15
APPENDIX A: BORING LOGS, WELL CONSTRUCTION AND WELL DEVELOPMENTRECORDS
APPENDIX Ai GEOTECHNICAL BORING LOGSAPPENDIX A2: MONITORING WELL BORING LOGSAPPENDIX A3 WELL CONSTRUCTION DIAGRAMSAPPENDIX AA WELL DEVELOPMENT RECORDS
APPENDIX B: SVCA PROCEDURESAPPENDIX C: MAXIMUM LANDFILL GAS GENERATION CALCULATIONSAPPENDIX D: WETLAND DELINEATION DATA FORMSAPPENDIX E: GROUND WATER MONITORING ANALYTICAL DATA TABLESAPPENDIX F: CLOSURE CAP CALCULATIONSAPPENDIX G: SURFACE WATER DRAINAGE CALCULATIONSAPPENDIX H: SEDIMENT TRAP DESIGNAPPENDIX I: VENT WELL SPACING CALCULATIONSAPPENDIX J: WELL ABANDONMENT REPORTS
in RROOOI57
LIST OF FIGURES
Number Title
1-1 Site location map.
2-1 Location of geotechnical borings.
2-2 Cross section A-A*.
2-3 Cross Section B-B'.
2-4 SVGA sampling locations.
2-5 Wetland locations.
2-6 Ecological monitoring sampling locations.
2-7 Ambient air monitoring locations.
2-8 Required easements.
3-1 Typical geosynthetic closure cap detail.
3-2 Final grading plan
3-3 Passive landfill gas venting system estimated radii of influence.
3-4 Future active gas extraction well detail.
5-1 Project schedule.
IV AROOOI58
LIST OF TABLES
Number Title
2-1 Summary of soil samples collected.
2-2 Summary of geotechnical analyses.
2-3 Ecological screening values and surface water data.
2-4 Ecological screening values and sediment data.
2-5 Ecological screening values and marsh sediment data.
2-6 Air monitoring and sampling program.
2-7 Meteorological data for ambient air sampling events.
2-8 Summary of ambient air sampling TO-14 results.
3-1 Hydrology summary.
3-2 Summary of vent well construction.
AROOOI59
LIST OF ACRONYMS AND ABBREVIATIONS
ASTM American Society for Testing and MaterialsAWQC Ambient Water Quality Criteria
bgs Below Ground SurfaceBOD Biological Oxygen DemandBTAG Biological Technical Assistance GroupBVL Bush Valley Landfill
cf Cubic Feetcftn Cubic Feet Per Minutecfy Cubic Feet Per YearCFR Code of Federal Regulationscfs Cubic Feet Per SecondCOMAR Code of Maryland Regulationscm Centimeter(s)CN Curve NumberCOD Chemical Oxygen DemandCOPC Constituent(s) of Potential Concerncy Cubic Yards
DHMH Department of Health and Mental Hygiene
EPA Environmental Protection Agency
FS Feasibility Studyft Foot/Feet
GC/MS Gas Chromatograph/Mass SpectrometerGGR Gas Generation Rate
HDPE High Density PolyethyleneHSA Hollow Stem Auger
ID Inside DiameterIDL Instrument Detection Limitin. Inch(es)
L Liter(s)LLDPE Linear Low Density Polyethylene
m Meter(s)MDE Maryland Department of the EnvironmentMDL Method Detection LimitMES Maryland Environmental Service
NMOC Non-Methanogenic Organic CompoundsNPL National Priorities List
ORP Oxidation-Reduction Potential
pcf Pounds Per Cubic FootPID Photoionization Detectorppb Parts Per Billionppbv Parts Per Billion Volumeppm Parts Per Millionppmv Parts Per Million Volumepsi Pounds Per Square InchPVC Polyvinyl Chloride
QA/QC Quality Assurance/Quality ControlQC Quality ControlQAPP Quality Assurance Project Plan
RBC Risk-Based ConcentrationRDWP Remedial Design Work PlanRL Reporting LimitROD Record of DecisionROI Radius of InfluenceRI Remedial Investigation
sec Second(s)SI Site InspectionSVCA® Soil Vapor Contaminant Assessment
TAL Target Analyte Listtc Time of ConcentrationTCL Target Compound ListTOC Total Organic CarbonTSS Total Suspended Solids
Hg Microgram(s)USAGE U. S. Army Corps of Engineers
vn A R O O O I 6
LIST OF ACRONYMS AND ABBREVIATIONS (continued)
USDA U.S. Department of AgricultureUSCS Unified Soil Classification System
VOC Volatile Organic Compound(s)
yr Year(s)
viii IROOOI62
1. INTRODUCTION
1.1 PROJECT SCOPE
EX Engineering, Science, and Technology has been contracted by Harford County to perform alandfill closure remedial design at Bush Valley Landfill in accordance with a Record of Decision(ROD), which was signed by Region III of the United States Environmental Protection Agency(EPA) on 26 September 1995, and an Administrative Order on Consent with an effective date of3 October 1997. A Consent Decree was lodged with the court in January 1998 and entered by thecourt in March 1998. Harford County is conducting the remedial design.
The remedial design Scope of Work incorporates the following components:
• Pre-Design Investigations—Includes topographic and property boundary surveys,monitoring well installation, monitoring well abandonment, geotechnicalinvestigation, landfill gas migration investigation, landfill gas production evaluation,wetland delineation, groundwater monitoring, ecological monitoring, and site accessand easement requirements.
• Drawings—Includes a title sheet with a drawing index, existing conditions plan, finalgrading plan, erosion and sediment control features, landfill gas venting system,landfill sections, and site details.
• Specifications—Includes sections pertaining to cap barrier layer, cap drainage layer,landfill gas venting system, site stabilization and vegetation, and clearing and materialdisposal.
• Opinion of Cost— Engineer's cost estimate for the remedy at Bush Valley based onthe design.
• Plans—A Site Safety and Health Plan for Construction, an Operation andMaintenance Plan, a Post Construction Sampling and Analysis Plan, and aConstruction Quality Assurance Plan.
M AROOOI63
1.2 SITE HISTORY
The Bush Valley Landfill (BVL) site was owned by the Harris and Braxton families for manyyears. They used the land for grazing cattle and raising crops. In 1974, the Harris family leasedthe BVL site from a group of family members for use as a landfill. In 1975, the Harris familysubmitted documentation to the Department of Health and Mental Hygiene (DHMH, apredecessor to the Maryland Department of the Environment) along with a permit application.The permit application was approved by the DHMH on 25 August 1975. Landfilling operationsbegan using the trench fill method; however, the operators were cited by DHMH for notfollowing proper filling procedures. On 20 October 1978, the DHMH ordered the Harris familyto take corrective action. The Harris family failed to comply, and on 16 May 1979 the DHMHordered the site owners to take corrective action by retaining Maryland Environmental Service(MES) to operate the BVL. However, these efforts were unsuccessful, and on 2 May 1980 theDHMH again ordered the Harris family to correct violations.
The site was still accepting solid waste in 1982, when the capacity of the site was reached. On3 December 1982, the Harris family discontinued landfilling and the site was abandoned.According to the Remedial Investigation (RI), there was generally insufficient cover material in-place at the time the landfill was abandoned, and poor grading.
In 1983, the Maryland DHMH (now renamed the Maryland Department of the Environment,MDE) conducted a preliminary assessment of the site, which was submitted to EPA in August1984. A Site Inspection (SI) report was finalized by the NUS Corporation in December 1985.EPA subsequently used data from the SI to develop a hazardous ranking score for the BVL, andthe site was proposed for listing on the National Priorities List (NPL) in June 1988. The site wasfinalized on the NPL in March 1989. Harford County conducted an RI of the site, which wasaccepted as final by EPA on 7 March 1995. Harford County then conducted a Feasibility Study(FS), which was accepted as final by EPA on 8 June 1995.
1.3 EXISTING CONDITIONS
The BVL is located in eastern Harford County, approximately Vs mile south of MarylandRoute 7 and Vz mile north of U.S. Route 40 (see Figure 1-1). The site is accessed from BushRoad, which forms the western border of the site. The approximately 29-acre parcel is borderedon the north, east, and west by woodlands, and on the south by partially wooded residentialproperty. To the north and east of the site lie freshwater marshes. Bynum Run Creek flows to
.
1-2o AROOOI61*
GRAPHC SCALE IN FEET(APPROXIMATE)
BUSH VALLEYLANDFILL
EA ENGINEERING.SCIENCE. ANDTECHNOLOGY
REMEDIAL DESIGN WORK PLANBUSH VALJLET LANDFILLWRFORO COUNTY. UARYUM)
PROJECT MGRPAP
DESOCDBrJBJ
ORWNBrFOV
OCCffiD BT
PAPsouAS SHOWN
(WE5-24-99
HRQOOI65
the north of the site, until its confluence with James Run, which in turn flows into a tributary ofthe Bush River. The area to the north and east of the site is part of the Bush Declaration NaturalResources Management Area, and consists of lowlands and a freshwater marsh area.
The landfill itself consists of a mound of covered landfilled material sloping up from the• southern site boundary. The mound peaks approximately in the center of the site, then slopesdownward to the north at a somewhat steeper slope than on the south side of the site. The gradedsite also slopes gently to the east and west towards the marsh area and Bush Road, respectively.An overgrown, unpaved access road traverses the top of the site from the west towards the east,but stops before reaching the eastern site boundary. The site is covered by tall grasses, scrub, andmostly small-diameter trees.
On the eastern side of the site, there are the remains of two stormwater ponds left over from theoperational period. These ponds are in disrepair, but both have pipe outfalls to the marshland tothe east. There is an underground sanitary sewer line, which lies to the north and east of the site.Harford County maintains an easement for access to this sewer.
There are 17 existing groundwater monitoring wells on or surrounding the site, most of whichwere installed during the RI (Geraghty & Miller 1995). Four of these wells, including theupgradient background well, were installed by EAin April 1999.
1.4 GEOLOGY AND HYDROGEOLOGY
The following sections discuss site-specific geology and hydrogeology at the BVL site. A moredetailed discussion is presented in the RI report.
1.4.1 Site-Specific Geology
The Quaternary alluvial deposits and the Potomac Group, which underlie the BVL site, consist ofunconsolidated beds of gravel, sand, silt, and clay. These beds may be continuous ordiscontinuous. Using boring logs from the onsite and offsite groundwater monitoring wells, thefollowing site-specific geologic characterization was developed. Cross sections developedduring the RI and supplemented by information gathered during the pre-design activities, arepresented by Figure 2-2 and Figure 2-3.
RROOOI66
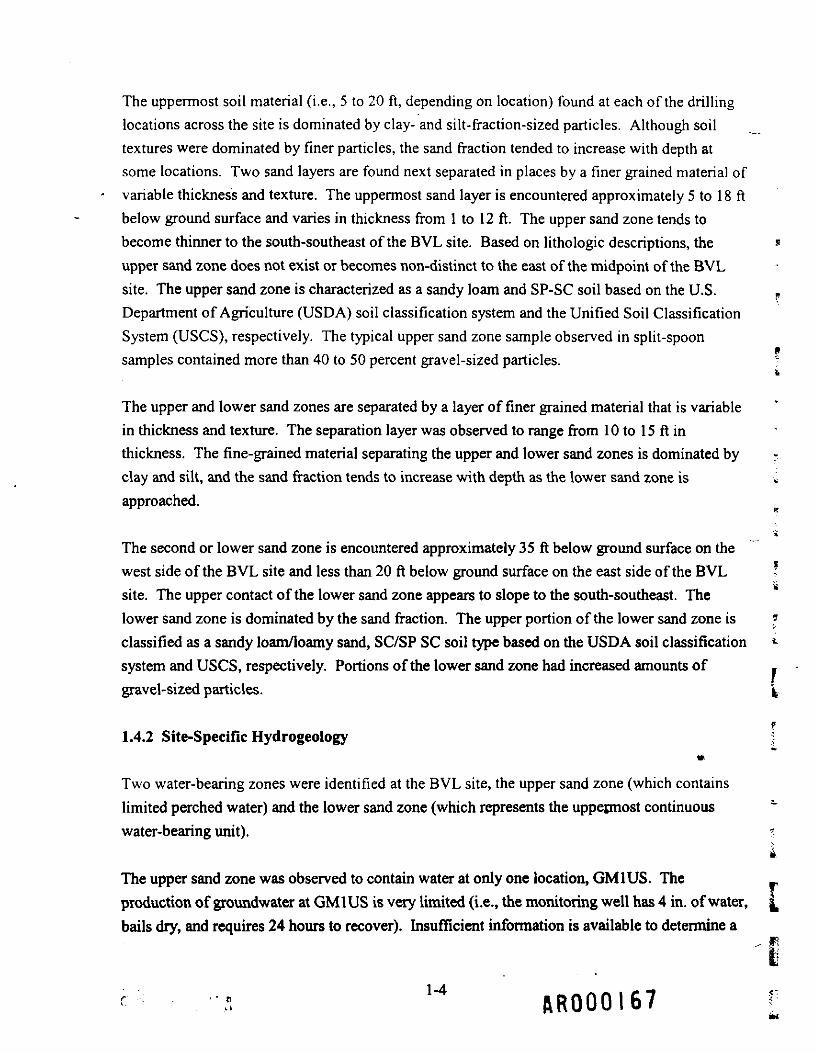
The uppermost soil material (i.e., 5 to 20 ft, depending on location) found at each of the drillinglocations across the site is dominated by clay- and silt-fraction-sized particles. Although soiltextures were dominated by finer particles, the sand fraction tended to increase with depth atsome locations. Two sand layers are found next separated in places by a finer grained material ofvariable thickness and texture. The uppermost sand layer is encountered approximately 5 to 18 ftbelow ground surface and varies in thickness from 1 to 12 ft. The upper sand zone tends tobecome thinner to the south-southeast of the BVL site. Based on lithologic descriptions, theupper sand zone does not exist or becomes non-distinct to the east of the midpoint of the BVLsite. The upper sand zone is characterized as a sandy loam and SP-SC soil based on the U.S.Department of Agriculture (USDA) soil classification system and the Unified Soil ClassificationSystem (USCS), respectively. The typical upper sand zone sample observed in split-spoonsamples contained more than 40 to 50 percent gravel-sized particles.
The upper and lower sand zones are separated by a layer of finer grained material that is variablein thickness and texture. The separation layer was observed to range from 10 to 15 ft inthickness. The fine-grained material separating the upper and lower sand zones is dominated byclay and silt, and the sand fraction tends to increase with depth as the lower sand zone isapproached.
The second or lower sand zone is encountered approximately 35 ft below ground surface on thewest side of the BVL site and less than 20 ft below ground surface on the east side of the BVLsite. The upper contact of the lower sand zone appears to slope to the south-southeast. Thelower sand zone is dominated by the sand fraction. The upper portion of the lower sand zone isclassified as a sandy loam/loamy sand, SC/SP SC soil type based on the USDA soil classificationsystem and USCS, respectively. Portions of the lower sand zone had increased amounts ofgravel-sized particles.
1.4.2 Site-Specific Hydrogeology
Two water-bearing zones were identified at the BVL site, the upper sand zone (which containslimited perched water) and the lower sand zone (which represents the uppermost continuouswater-bearing unit).
The upper sand zone was observed to contain water at only one location, GM1US. Theproduction of groundwater at GM1US is very limited (i.e., the monitoring well has 4 in. of water,bails dry, and requires 24 hours to recover). Insufficient information is available to determine a
flROOOI67
direction of flow for groundwater in the upper sand zone. However, based on the limited extentand nature of saturation observed for the upper sand zone, this unit may not contributesignificantly to the groundwater flow characteristics of the BVL site. It is possible that limitedgroundwater described at GM1US could be perched and could migrate in the upper sand zone.
The lower sand zone is considered the uppermost continuous water-bearing unit. The horizontalcomponent of groundwater flow in the lower sand unit across the BVL site is generallyperpendicular to the slope of the topography. Groundwater moves from topographically highpositions (i.e., recharge areas) to topographically low positions (i.e., discharge areas) such asBynum Run Creek to the north and the tidal marsh to the east of the BVL site. In general, thedirection of flow is from west to east across the BVL. There is some component of flow to thenorth, toward Bynum Run, and some component of flow to the southeast, toward the tidal marsh.The horizontal component of flow is controlled to some extent by the potential head energydifferences between the recharge and discharge areas.
Based on the water-level information collected during the RI and the pre-design activities, thearea to the west of the BVL site is hydraulically upgradient. It is important to note that the waterelevation at PZ1 (which is located adjacent to the boundary of solid waste placement) is lowerthan water elevations measured at GM1-LSS and GM9, indicating that a significant "reversegradient" component of flow due to mounding effects within the landfill does not exist at thislocation. This observation is valid for water-table conditions observed in January and May 1993.However, the information collected to characterize potential mounding at the BVL site islimited. In addition, the gradient between PZ1 and GM9 is relatively flat. Therefore, somepotential for mounding to occur at the site exists.
SROOOI68
2. PRE-DESIGN ACTIVITIES
Pre-design activities conducted at the BVL site have consisted of a topographic and propertyboundary survey, geotechnical investigation, landfill gas migration investigation, landfill gasproduction evaluation, monitoring well abandonment, monitoring well installation, wetland_delineation, groundwater monitoring, ecological monitoring, and determination of site access andeasement requirements. The results of these pre-design activities are summarized in this section.
2.1 TOPOGRAPHIC AND PROPERTY BOUNDARY SURVEY
In order to provide an up-to-date topographic map of Bush Valley Landfill, an aerialphotogrammetry survey of the site was conducted in April 1998 by Purdum and Jeschke ofBaltimore, as a subcontractor to EA.
A 1 in. = 50 ft scale topographic map of the site was produced with 1-ft contour intervals. Otherexisting features (power lines, wells, roads, trees, etc.) which could be identified by the aerialsurvey were also plotted. Horizontal and vertical control points for the aerial survey wereestablished onsite using the Maryland State Plan Coordinate system. The topographic surveymap is presented in the Drawings (Drawing No. C-l). In order to accurately plot the limits of thesite, a first-order property boundary survey was also conducted by Purdum and Jeschke.
2.2 DELINEATION OF WASTE LIMITS
The limit of waste was delineated by test pitting operations conducted from 1 June 1998 through5 June 1998. The limit of waste from this effort is indicated on Drawing No. C-l.
Where feasible, each test pit was begun outside the approximated limit of waste to minimizedisturbance of the waste material, and advanced through the limit far enough to confirmidentification of the main body of the landfill. Each test pit was advanced to a depth of 8 to 10ft. A total of 26 test pits were completed, which included 23 at the limit of waste and 3 outsidethe limit. The test pits outside of the limit of waste were used to verify that landfilling activitiesdid not include placement of waste beyond the Rl-identified limit of waste and to verify thenature of various mounds located beyond the limit of waste.
Following completion of each test pit, any waste removed was replaced in the pit and coveredwith the original cover material.
2-1 IROOOI69
2.3 GEOTECHNICAL INVESTIGATION
A geotechnical investigation has been conducted along the southern and eastern landfillboundaries to evaluate local soil characteristics for potential vertical gas interceptors and toaddress cap stability. The geotechnical investigation was completed in two phases. The firstbegan 1 September 1998. Six borings (EASB1 through EASB6) were planned, as detailed in the 4Final RDWP (EA 1998). Due to site inaccessibility encountered during drilling activities,EASB-4 and EASB-5 were not collected. An additional boring (named EASB-1 A) was located
H
approximately 150 ft east of Bush Road. These five geotechnical borings (EASB-1, EASB-1 A,EASB-2, EASB-3, and EASB-6) were advanced during the first phase of the geotechnicalinvestigation. They were advance to a depth of 25 ft along the southern BVL boundary in the flocations shown in Figure 2-1. In order to assess local subsurface conditions, EA developed frcross-section A-A' (Figure 2-2), shown in plan view on Figure 2-1.
The borings were completed by E2SI under subcontract and supervision of EA in accordance•V
with the Final RDWP (EA 1998). The borings were advanced by hollow stem auger (HSA)using a CME 75 drilling rig with a 31/4-in. inside diameter (ID) auger, and 2-in. split barrelsampler. Soil was continuously logged by an EA geologist and one sample each was collected at *a uniform depth, via Shelby tube, from borings EASB-1, EASB-1 A, EASB-2, and EASB-3, for *geotechnical analysis of soil type, in-place density, grain size distribution, permeability, and a
y.Atterburg limits. (Shelby tube sample collection was attempted in EASB-6; however, the sample £collected was saturated sand, which was lost from the sampler upon removal from the borehole.)Each sample collected for the geotechnical analyses noted above was predominately low- i.permeability silt/clay. Soil boring logs and grain size distribution curves are provided inAppendix Ai and A:, respectively. Table 2-1 presents a summary of the soil samples collected ifor geotechnical analysis. Table 2-2 presents a summary of the geotechnical analyses. *Continuous split-spoon sampling was conducted during the soil boring activities. Samples from reach boring were collected and evaluated (using a procedure later deemed inappropriate by ;regulators) with a photoionization detector (PID) for headspace organic vapor screening analysis.The data collected from the geotechnical analyses was required for remedial slurry wallconstruction designs (no longer identified as a remedial action).
Following regulatory review and comment a second geotechnical investigation phase was **initiated. Five additional soil borings (EASB-7 through EASB-11) were advanced via direct- _push technology on 5 through 9 November 1998 to address concerns for potential vapor |jmigration through deeper subsurface sand layers. Continuous cores were collected and lithologic
Note:No sample was collected and analyzed from EASB-6 due to poor sample recovery in the Shelby Tube.
AROOOI73
TABLE 2-2 SUMMARY OF GEOTECHNICAL ANALYSES
Sample
EASB-1
EASB-1 A
EASB-2
EASB-3
DryDensity(pcf)
129.3
85.7
110.5
106.5
Permeability(cm/sec)
5.397 x 10'8
6.927 xlO'8
4.295 x 10'B
1.831 x 1Q-7
LiquidLimit
31
31
31
32
Plastic Index(AtterburgLimit)
13
13
11
10
Grain SizeDistribution(percent)
silt/clay - 93.5sand - 6.3gravel - 0.2
silt/clay - 89.0sand- 11.0gravel - 0.0
silt/clay -95. 5sand - 4.5gravel - 0.0
silt/clay -93.1sand - 6.9gravel - 0.0
USCSClassification(soil type)
CL
CL
CL
CL
Note:No sample was collected and analyzed from EASB-6 due to poor sample recovery in the Shelby Tube.
RROOOI7I*
evaluations were completed by an EA geologist to supplement previous data, and to characterizesubsurface conditions along the western and southwestern sides of the landfill. The objectiveswere to further characterize subsurface conditions at the BVL site and to assess the potential forlandfill gas to migrate through a more permeable subsurface medium. During the second phaseof,the geotechnical investigation unsaturated sand layers were identified and target depths foradditional soil vapor samples were established. The additional work began 4 November 1998and was completed on 9 November 1998. Soil boring logs for the "second phase" borings areprovided in Appendix AI. EA used the data from these additional borings to develop cross-section B-B' (Figure 2-3), shown in plan view in Figure 2-1.
Data collected from the EA geotechnical investigations were also used to supplement and refineexisting information (i.e., RI data) as they relate to the subsurface physical, chemical, andbiological conditions at the landfill. Previous subsurface characterizations (i.e.,RI), for example, included discussions of distinct "upper" and lower" sand aquifers below thesurficial silt and clay deposits, separated by a 1 to 3 ft clay confining. The RI groundwatermonitoring well network was developed on that premise. The data collected during the EAgeotechnical investigation indicates that the confining layer, defined in the RI, is not continuousbeneath the landfill and the sand layers merge to a single unit south and east of approximatelythe east-west midpoint of the landfill.
2.4 LANDFILL GAS MIGRATION INVESTIGATION
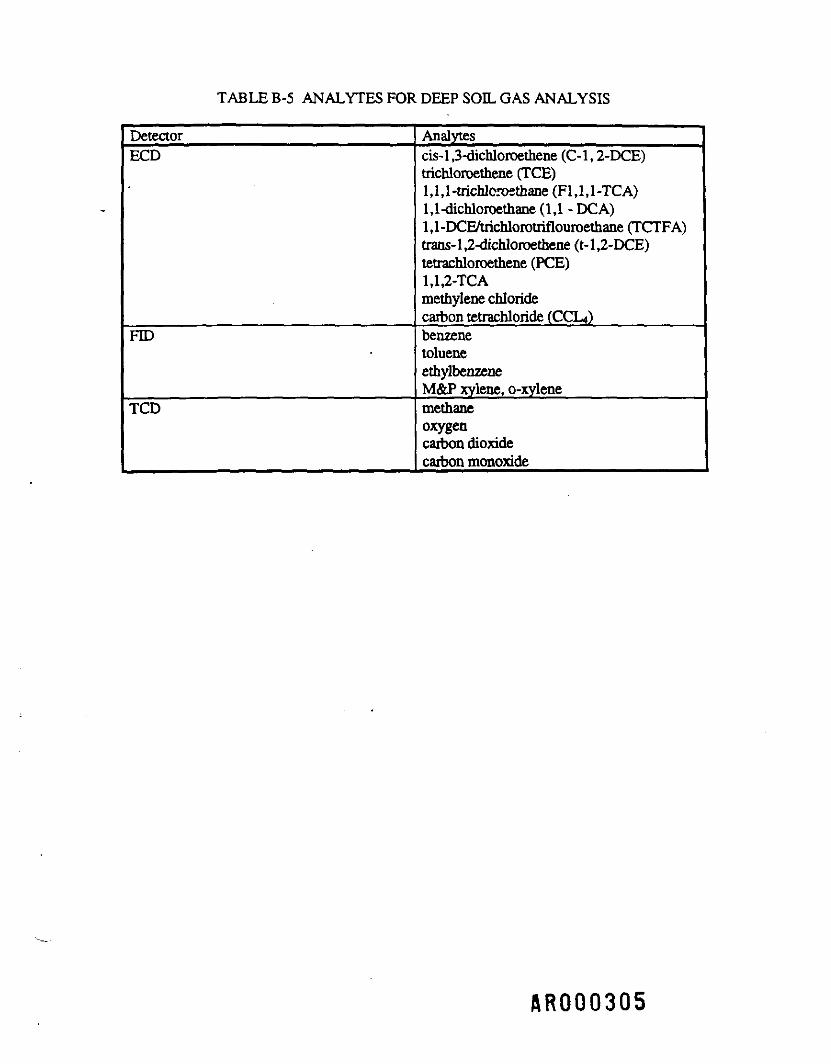
EA conducted a Soil Vapor Contaminant Assessment (SVGA®) survey between 18 and28 August 1998 as part of the pre-design activities at the BVL site. The data collected were usedto evaluate the nature and extent of subsurface vapors and, where applicable, to assist in thedesign of a landfill gas management system. A total of 77 SVGA samples were collected in bothonsite and offsite locations at soil depths that ranged between 3 and 6 ft. The SVGA samplelocations are presented on Figure 2-4. The SVGA samples were analyzed for the representativesuite of chlorinated and aromatic hydrocarbons shown in Appendix B. The soil vapor analysesalso included evaluation of carbon dioxide, oxygen, methane, and carbon monoxideconcentrations. Appendix B describes in detail the procedures followed during the SVCA at theBVL site.
The analytical results (Appendix B) indicate the presence of trace concentrations of chlorinatedcompounds within, north of, and at the southwest corner of the limit of waste. Results indicatethe highest concentrations of hydrocarbons occurring near the northeast and southwest portions
RROOOI7S
of the limit of waste. Elevated concentrations of methane (greater than 10,000 ppm) weregenerally limited to within, north of, and west of the limit of waste.
The landfill gas concentrations detected in the surficial clay layer along the southern boundary ofthe landfill were minimal. Similarly, the concentrations of methane along the southern boundaryof the site were minimal, ranging from <5 to 17 ppm.
In response to regulatory concerns for potential deeper landfill gas migration, additional soil gassamples were collected from the unsaturated subsurface sand zone and analyzed forhydrocarbons. Lithologic characterizations completed during the geotechnical investigation wereused to target permeable soil vapor sample collection locations. Eight deep soil gas sampleswere collected from the upper sand layer via direct-push technology at depths of approximately17 ft. These deep soil vapor sample locations (EASG-2, EASG-3, EASG-7, EASG-8, EASG-9,EASG-10, EASG-11, and EASG-12) are located along the southern and western landfillboundary and are shown on Figure 2-4. The deep soil vapor samples were numbered tocorrespond to the co-located geotechnical borings described in Section 2.3. The soil vaporsampling point depths are illustrated in cross sections A-A' and B-B' (Figures 2-2 and 2-3,respectively).
The analytical results of the deep soil vapor samples are provided in Appendix B. Elevatedmethane concentrations were detected in seven out of the eight samples collected. Methaneconcentrations, measured in percent, ranged between 21.7 and 48.9. The methane migration isoccurring in the unsaturated sand layer, beyond the limits of the landfill. In general, chlorinatedand aromatic hydrocarbon concentrations in the deep soil vapor samples were essentially tracevalues (i.e., less than 20 ng/L).
It should be noted that methane levels reported by the investigation exceeded the lower andupper explosive levels of 5 to 15 percent. Based on these results and concerns of USEPA andMDE, additional subsurface gas vents and gas monitoring probes were added to the design(Chapter 3).
In response to request by several homeowners, Harford County also conducted sampling ofresidences in the area of the landfill. The following table lists the residences recently sampledfor landfill gas levels and the results of that sampling:
T]ii
AROOOI76
. S S 8 2 im I I 1 I I I
TU
01-OSV301-8SW3
a s o
b
e-J1
CN
O
0
!i><oz-3ogozzzujjji
agp
fiROOOI77
HROOOI78
Address Date Sampled Results
1234 Bush Road 26 January 1999 All readings consistent withbackground
J 308 Bush Road 2 February 1999 All readings consistent withbackground
1234 Bush Road 23 April 1999 All readings consistent withbackground
2.5 LANDFILL GAS PRODUCTION EVALUATION
The goals of the landfill gas production evaluation, in conformance with the ROD, are to:
• Investigate the potential for landfill gas production• Evaluate the potential for gas utilization and destruction• Evaluate the methods for protecting human health and cap integrity
Each of these goals are addressed in detail in the sections below.
2.5.1 Potential for Landfill Gas Production
The potential for landfill gas production exists based on the nature of municipal solid waste. Theamount of gas produced was estimated using the EPA Emissions Estimation Program Version1.1 a. In accordance with 40 CFR 60.755 (a)(l), and in lieu of site-specific data, the values forthe methane generation rate constant (k) and the methane generation potential (L0) that were usedwere those presented in the EPA Emission Factors and Inventory Group in the documententitled, "Compilation of Air Pollutant Emission Factors, Volume I: Stationary Point and AreaSources" (AP-42). Specifically, k is 0.05 yr-1 and LO is 6,000 ft3 CH4/Mg refuse. The value forNMOC (non-methanogenic organic compounds) was taken from the results of the SVGA andwas assumed at 34 ppmv [average of total flame ionization detector (FID) hydrocarbons]. Thetotal landfill capacity was estimated to be 1 million cubic yards (cy) and was considered in themodel along with a time period of 8 years, which is the estimated active life of the landfill. Theresults of the model indicate that for 1998, the total landfill gas emission rate from Bush Valleyincluding methane, carbon dioxide, and NMOC is approximately 1.2x10* cubic feet per year(228 cfin). It should be noted that these references are conservative and are best used as a
2'5 RROOOI79
screening tool for landfill gas alternative analysis such as for BVL. Calculations detailing theestimation of the expected gas flow rate are included in Appendix C.
2.5.2 Potential for Landfill Gas Utilization and Destruction
The analytical results from the pre-design activities indicated that the average concentration ofmethane at the sampling points across the site is approximately 15,000 ppm (1.5 percent). Theaverage concentration of NMOC is 34 ppm as shown in Table B-l of Appendix B. For thepurpose of determining the method of landfill gas venting (passive or active), 40 CFR Parts 51,52, and 60 are utilized as a guideline. If the landfill has a maximum design capacity less than100,000 megagrams (Mg) (111,000 tons), an active landfill gas collection and control system isnot required. If capacity equals or exceeds 111,000 tons, then the NMOC emission rate must becalculated. The capacity above (1 x 10⁶ cy) is equivalent to approximately 550,000 tons. If thecalculated NMOC emission rate is less than 150 Mg per year (167 tons per year), then an activesystem is not required. NMOC emission rate is calculated by procedures provided in 40 CFRPart 60.753.
The calculated NMOC emission rate for the BVL site is 0.412 Mg per year. Therefore, a passivegas venting system will be adequate for controlling and removing landfill gas.
The utilization or destruction of landfill gas requires (1) sufficient concentrations of methane,and (2) a potential user in close proximity to the landfill. The concentrations of methane in theshallow ground as determined during the SVGA were low. The higher methane concentrationsseen in the deeper sand zone were offsite, and due to the age of the landfill, methane productionat the high rates seen is not anticipated to be sustainable. In addition, there are no potential usersfor the landfill gas located near the BVL site.
Based on the low methane concentrations in the shallow subsurface, the absence of a potentialuser, and no technically based justification for an active gas extraction system, there is littlepotential for landfill gas utilization and no requirement for destruction.
2.6 MONITORING WELL INSTALLATION
Four new groundwater monitoring wells (EA10 through EA13) were installed during the week of12 April 1999 to monitor groundwater quality (along with selected existing wells) near theperimeter of the BVL. The new well locations are presented in Figure 2-1. The new welllocations include one upgradient well and three perimeter wells downgradient of the BVL. The
AROOOI79A
upgradient well (EA10), located approximately 900 ft northwest of the landfill, a backgroundwell, geochemically independent from the BVL. The three downgradient wells (EA11 throughEA13) located south and southeast of the landfill will be used in conjunction with 10 existingonsite wells to assess long-term natural attenuation. The downgradient wells were installed inthe sand aquifer that underlies surficial clay and silt deposits. Monitoring well installation and^construction was completed in accordance with the Final RDWP (EA 1998) and expanded WorkPlan (EA 1999).
2.6.1 Monitoring Well Borings
Drilling and well installations were performed by E2SI, a licensed Maryland well driller, as asubcontractor to and under supervision of EA. Monitoring wells EA10 and EA12 were installedin accordance with EA standard operating procedures (GtS-201) and Maryland Department ofEnvironment (MDE) specifications (MDE 1991). Due to soft ground in the marsh area east ofthe landfill, monitoring wells EA11 and EA13 were driven to target depths using a tripodmounted cathead.
Soil was continuously logged via 2-in. split barrel samplers, and lithologic characterizationscompleted during drilling activities for EA10 and EA12. Due to marsh conditions, lithologiccharacterizations for EA11 and EA13 were completed by evaluation of soil cuttings collectedwhile advancing a soil boring adjacent to each marsh well site via tripod-mounted augers. Thedrill cuttings derived from the downgradient borings were containerized in 55-gal drums andmoved to the fenced staging area along the western landfill boundary. Boring logs are providedin Appendix A3.
EA10 was bored to a depth of 18 ft below the ground surface (bgs). In general, interlayered bedsof wet silt, sand, and clay, ranging in thickness from 1 to 4 ft, were encountered over the 18-ftboring interval. Headspace readings on soil samples collected from boring EA10 revealed nodetectable organic vapors.
EA12 was bored to a depth of 26 ft below ground surface. Silt/clay was predominant from thesurface to approximately 11 ft. Wet sand and gravel were encountered from 11 ft to a depth ofapproximately 20.5 ft and running sand was recorded at a depth of 18 ft (Appendix A3>. Theboring was terminated in a silt/clay layer at 26 ft. The saturated sand and gravel aquiferencountered from 11 to 20.5 ft represents the single underlying sand unit discussed in Section2.3. Trace levels of organic vapors (i.e., <2 ppm) were detected at depths of 4 and 12 ft.
2-7 AROOOI80
Tripod-mounted auger refusal was encountered at approximately 13 ft bgs in the soil borings atEA11 and EA13. The lithology identified at both marsh well sites was similar and consisted of aclayey silt from the surface to approximately 13 ft. Sand content appeared to increase with depthand auger refusal was likely due to the lithologic change from clayey silt to sand at each location.The lithologic change is believed to be the contact between the surficial silt and clay deposits andthe underlying sand aquifer.
2.6.2 Monitoring Well Construction
Monitoring wells EA10 and EA12 were constructed of 4-in diameter schedule 40 PVC casingwell casing and 0.010-in. slotted PVC well screen. The screen interval in Well EA10 extendsfrom 7 to 17 ft below ground surface (bgs). The screen interval in Well EA12 extends from 8 to18 ft bgs. Well construction diagrams are presented in Appendix A}. Water levels gauged inmonitoring wells EA10 and EA12 on 13 and 15 April 1999 were 8.2 and 8.7 ft, respectively.
Following auger refusal, Wells EA11 and EA13 were driven to depths of 17 ft and 18 ftrespectively via a tripod-mounted cathead. A three ft section of pre-packed stainless steel wellscreens is seated within the underlying sand aquifer at the base of each well. Well constructionfor EA-11 and EA-13 diagrams are presented in Appendix AS. Groundwater levels in the marshwells were at, or near grade.
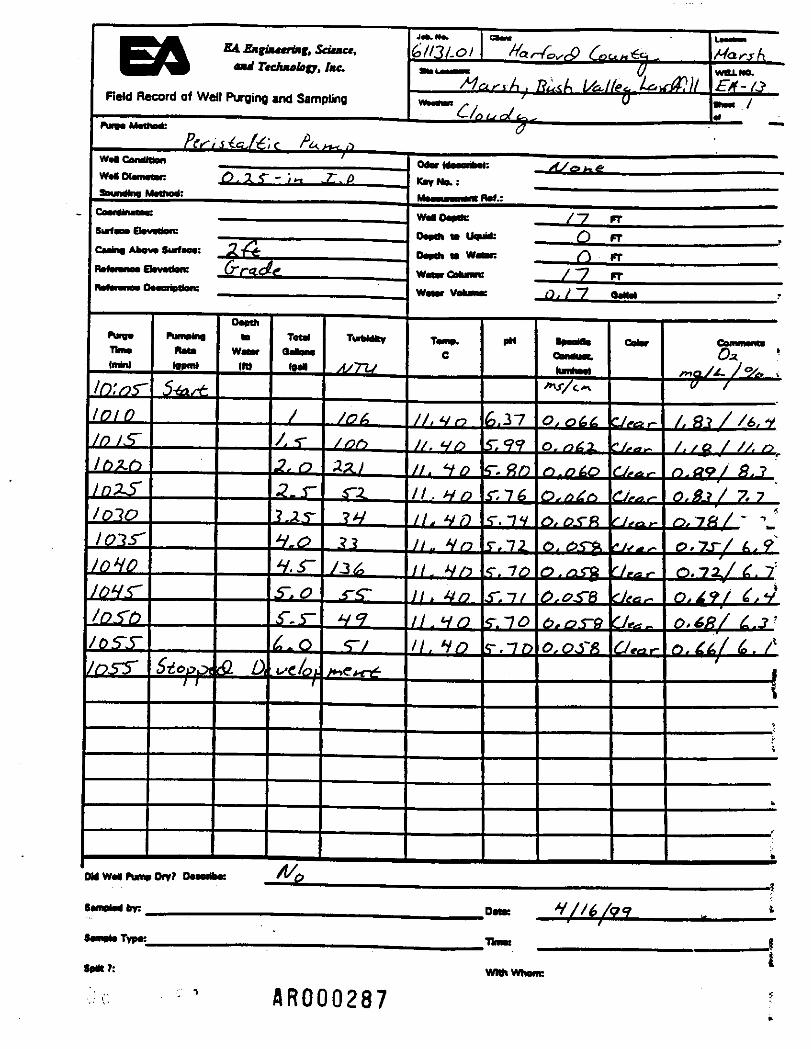
2.6.3 Well Development
Well development was completed for each well in accordance with the expanded Work Plan (EA1999). During pumping, water quality parameters were measured to assess well stabilization.The parameter measurements included temperature, specific conductivity, and pH readings. IEach well will be developed until the above-mentioned parameters stabilized over three readings utaken at 5-minute intervals. Well development records are presented in Appendix A .
2.7 MONITORING WELL ABANDONMENT
Four existing groundwater monitoring wells (MW1 through MW4) were abandoned 4-7 May1999. The location of the four wells are illustrated in Figure 2-1. These wells were initiallyinstalled at the landfill in the 1970s and constructed with solid steel casings that extended fromapproximately 2-3 ft above grade to the bottom of the hole. Well depths for MW 1-4 were 52, j42,22, and 21 ft, respectively. L
*
1
U
;;{ ,»;*/! 2"8 flROOOISI
The well abandonment process for each well began by attaching the casings to the drilling ng inan attempt to "unseat" and remove each casing by using the weight of the rig to physically "pull"the casings from the ground. Casing removal was unsuccessful. Consequently, each well wasabandoned by perforating the steel casings through the use of a pneumatic device. This deviceconsisted of a drill bit equipped with a "spiked" wheel that, when lowered into the well, puncheda straight series of 2-in. holes in the casing every 3 in. This device was used to create threeevenly spaced "punch lines" in each well that extended from the surface to the bottom of thecasing/hole. After perforation, the well was grouted and the casing in each well was cut offbelow grade. Preparations were made to capture and contain any water displaced during thegrouting process; however, no displacement water was generated. Displaced water is believed tohave escaped through the perforated casings, a good indication that perforation was thorough.
Well abandonment reports are included in Appendix J.
2.8 WETLAND DELINEATION
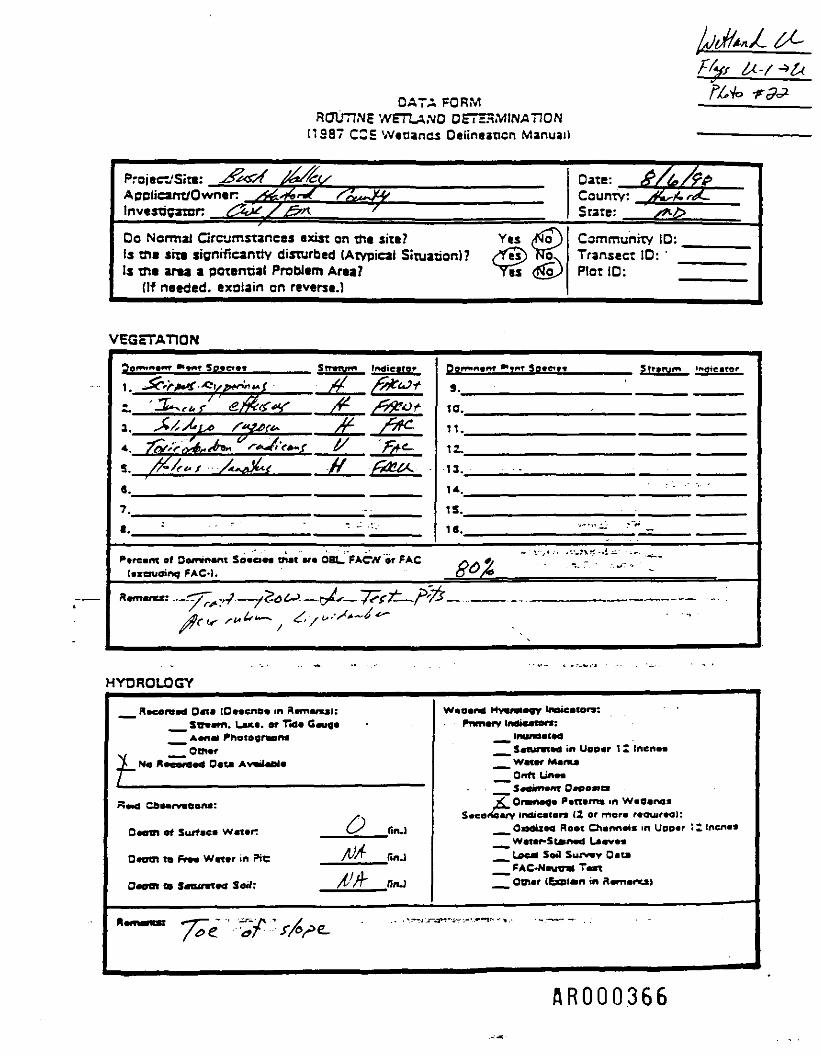
EA conducted a wetland delineation at the BVL site on 5 and 6 August 1998. Poor grading andlocalized subsidence of the various fill areas created depressions throughout the BVL site thatsupport wetland vegetation and/or have other wetland characteristics. The objective of this studywas to identify, delineate, and characterize the wetlands on the existing cap and in those areaspotentially encroached upon by the installation of the future cap.
The guidance contained in the 1987 U.S. Army Corps of Engineers (USAGE) WetlandDelineation Manual (USACE 1987) was used to determine the wetland-upland boundaries.Flagging labeled "Wetland Delineation" was hung along the wetland-upland interface. Each flagwas labeled in the field with a unique designation. A survey crew surveyed the wetland flagsand mapped the locations of the wetland areas to provide a mechanism of determining wetlandacreage and distribution.
Since the wetlands on the existing cap and immediately adjacent to the limit of waste wereinduced by past grading activities, a Corps-approved variation to the Corps' RoutineDetermination (i.e., three-parameter approach) was used for wetlands in these areas. The three-parameter approach relies upon the existence of wetland vegetation, wetland hydrology, andhydric soils. Because this site is dominated by (relatively) recently disturbed soils (i.e., fill andcover material placed during past landfilling activities), the presence of hydric soils could not beused to determine the wetland boundaries on and adjacent to thejimit of waste. Vegetation andhydrology were used as field indicators to determine wetland edges in these areas. ,
2"9 BROOOI82
Data sheets were completed for each wetland area and are included as Appendix D. Plantsoccurring within a wetland area were identified to genus and species whenever possible. Noteson hydrology were also recorded on the data sheets.
The majority of the wetlands present on the BVL site are the direct result of poor gradingactivities associated with past landfill operations. Areas with wetland characteristics onsite (i.e.,wetland vegetation and wetland hydrology) have developed in depressed areas (due to poorgrading and/or subsidence of fill material) or in drainage areas that developed due to excesssurface water.
Twenty-six wetland areas were delineated at the BVL site on 5 and 6 August 1998 (Figure 2-5).Wetland types present onsite include emergent, scrub-shrub, and forested wetlands. Emergentand scrub-shrub wetlands are the dominant wetland types at the BVL site. The wetland areasrange in size from extremely small (approximately 100 ft2) to those that are somewhat larger(less than 7,000 ft2). Most of the wetlands are distributed throughout the existing fill areas, witha few larger wetland areas along the perimeter of the property. These larger wetlands aretypically beyond the anticipated extent of disturbance to be caused by remedial action.
Approximately 57,061 ft2 (1.3 acres) of wetland areas are anticipated to be disturbed at the BVLsite by final closure activities. The wetland areas to be disturbed are on or adjacent to theexisting cap, small in size and low in quality, and are a direct result of previouslandfilling/grading activities. The majority of the wetland areas delineated on the existing capcontain only one or two common wetland plant species (e.g., Juncus effusus, and Scirpuscyperinus),
Wetland areas outside of the proposed limit of disturbance are larger in area, have greater plantr
species diversity, and greater habitat value. These areas are associated with the floodplain ofBynum Run and the Bush Declaration Natural Resources Management Area. These higherquality wetlands (i.e., those wetlands not previously impacted by historical site activities) willnot be disturbed by final capping activities.
2.9 ECOLOGICAL MONITORING
The selected remedy for the BVL site includes an ecological monitoring program to determinethe effectiveness of the remedial action in protecting the ecological resources. The PerformanceStandards in the ROD (p. 53) specify that: ;"JJ;' '
So - Ori; 2'10AROOOI83
RROOOI8U
• The Ecological Monitoring Program shall include monitoring of the adjacent wetlandand stream surface water, sediment, and benthic environments.
• An ecological reference station for wetland/marsh samples shall be established.
Ten sampling stations were established for monitoring the wetlands and streams (Bynum RunCreek, Bush River Tributary, and the unnamed tributary). The marsh reference station was sitedin the Church Creek basin. Sampling locations are shown on Figure 2-6.
The first round of sampling, or baseline monitoring, was conducted as part of the pre-designactivities. The monitoring plan will be developed as part of the remedial design.
* **
2.9.1 Sampling Program
As described in the RDWP, sampling locations were designated SW/SD 1, 2, 3, 4, 5, 6, and 7and two marsh sediment locations were designated MSD08 and MSD09. Sites 1 and 5 areupstream of the BVL site and were considered to be background locations on Bynum Run andJames Run. Sites 2, 3, and 4 are located on Bynum Run and Site 6 is located on the Bush RiverTributary near its confluence with the Bush River. Site 7 is located east of the landfill on theUnnamed Tributary to the Bush River. An additional sediment location, MS-13, was added afterapproval of the Work Plan. It is located in the northeast section of the site in an area thatfunctions as a sediment basin.
Samples were collected in accordance with the procedures specified in the RDWP (EA 1998).Each of the surface water and sediment sampling locations, as well as.the two marsh locations,were staked and later located by field survey.
Samples were collected during the low tide window on 5 and 6 August 1998. Low flowconditions were further defined by occurrence of less than 0.2 in. of rainfall in the prior 72 hoursas measured at Martin State Airport. MS-13 was sampled on 11 September 1998.
At sampling location SW-7 the water level was too low to allow for collecting a water samplewithout disturbing bottom sediment. The collected sample had a total suspended solids (TSS)concentration of 2,620 mg/L. Since this does not represent a water-column sample, all resultswere rejected in the data useability review.
Sediment samples were collected from areas estimated to have a minimum of 50 percent fines(percentage of sediments that can pass through a 63-micron sieve). Strict compliance with thisspecification was not possible due to the material present in the system. However, all sampleswere collected in depositional areas and, with one exception (SD-6), contained at least 50 percentmaterial with a particle size less than 100 microns. The remaining material was mostly finesand.
2.9.2 Analytical Protocols
Samples were analyzed for the suite of parameters listed below:
• Surface Water—Temperature, dissolved oxygen, pH, TSS, alkalinity, ammonia,hardness, biological oxygen demand (BOD), chemical oxygen demand (COD), totalorganic carbon (TOC), Target Analyte List (TAL) metals, and cyanide.
• Sediment—Grain size, TOC, ammonia, TAL metals, and cyanide.
Leachate influence on surface water and sediment quality is best distinguished from othersources by evaluating a profile of analytes that typically represent indicators of leachate insurface water. The most significant of such analytes are alkalinity, ammonia, aluminum, barium,copper, iron, lead, nickel, manganese, and zinc. Since the complete TAL scan was run, data foradditional metals were also obtained. Among the metals that are not characteristic leachateindicators, standard laboratory reporting limits for cobalt, cyanide, mercury, and silver aregreater than the EPA or MDE screening values. Since these analytes were not considered to beCOPC by the other ROD, more sensitive analysis protocols were not provided for in theapproved work plan. In addition to the TAL metals, alkalinity and ammonia data are essential toeffectively assess whether leachate may be affecting the surface water system. In addition tobeing an indicator of leachate, ammonia is a potential toxic constituent in surface water andsediment.
Grain size and TOC data are essential to the accurate interpretation of sediment data. Sinceconstituents of concern tend to adsorb to finer grained sediment particles, it is essential thatsamples are representative of similar media. TOC is necessary to define biological availabilityof some chemicals and thus to derive benchmarks that indicate whether there is a potential foradverse ecological impact.
2'12 HROOOI86
SW/SD5^\
SW/SD4jT
BUSH VALLEYLANDFILL
TRAILERARK
GRAPHIC SCALE IN FEET(APPROXIMATE)
EA ENGINEERING,SCIENCE, ANDTECHNOLOGY
ECOLOGICAL MONITORINGSAMPLING LOCATIONS
BUSH VALLEY LANDFILL CLOSUREHARFOftO COUNTT, UARVLWO
RROOOI87
2.9.3 Results
The results of the sampling program are shown in Tables 2-3, 2-4, and 2-5. The findings arereviewed in relation to the principal objectives of the study below.
1. Screening of chemical concentrations against ecological screening values todetermine whether there is a potential for adverse ecological effect
The only screening values or water quality standards for surface water (with theexception of sample SW-7, which was excluded based upon data useabilityevaluation), that were exceeded were aluminum and dissolved oxygen. Exceedancesor, in the case of dissolved oxygen, deficits were recorded at all stations, bothreference locations, and potentially impacted locations. These results are consistentwith the findings of the RI, that there were no constituents of potential concern(COPC) in surface water.
Screening values that were exceeded for stream sediments include chromium, copper,iron, manganese, nickel, and TOC. These analytes exceeded screening values atstations that are upstream of the landfill as well as downstream. These same analyteswere found to exceed screening values in marsh sediments. Two of the reference areamarsh samples also exceeded the lead screening criteria by a minimal amount andwere generally similar to concentrations found elsewhere. One result for zinc (MS-8)was 9,930 mg/L, an order of magnitude higher than the screening level and all otherresults.
2. Evaluation of whether the distribution of leachate indicator analytes shows a landfill-related effect
The analytes that have typically been found to be indicative of leachate impacts arealkalinity, ammonia, aluminum, barium, copper, iron, lead, nickel, manganese, andzinc (IT Corporation 1993). There is some indication that ammonia, barium, copper,and iron, in sediments to the east of the landfill, are elevated compared to upstreamand reference locations. These analytes are also elevated in the groundwater samplesof GM-3 and/ or GM-4 LSS.
3. Assessment of whether there are leachate-related effects that are potentially toxic tobiota and recommendation for toxicity testing, if necessary
2-13 RROOOI88
Of the potentially leachate-derived analytes, only copper and iron have ecologicalscreening values. These screening values, as previously noted, are exceeded atlocations upstream of the landfill as well as downstream. There are no indicationsthat the observed conditions would adversely affect ecological resources in thesurface water system. Therefore, there is no need to conduct further evaluations suchas toxicity testing. f
Surface water and sediment data were analyzed in accordance with the Quality AssuranceProject Plan (QAPP.) and are usable for evaluation of environmental conditions, with theexception of the surface water sample for SW-7. Sample SW-7 was taken in a location withshallow standing water and, as indicated by the TSS concentration of 2,620 mg/kg, is not a ?•representative surface water sample. Therefore, this sample was rejected from consideration in Jthe data evaluation as being unusable.
The laboratory qualified several of the antimony results for the sediment samples with the Nr
qualifier indicating that spiked sample results were outside control limits (75-125 percent).These results are useable with the recognition that results may be biased low.
t
The detection limit for cyanide exceeds the reporting limit identified in the QAPP for sediment. *The reporting limits identified for sediment samples are based on the limits achievable for soils. ?However, the detection limits that can actually be achieved for sediment are dependent on the ;.percent moisture of the samples since the wet weight result is converted to dry weight by
9
calculation for reporting.i
Several analytes are reported as estimated values at levels well below the reporting limits. Such Iresults are above the level detectable by the instrument but below the level that is considered to *be reliably quantified. r
»
2.10 MONITORING WELL SAMPLING
Two groundwater sampling events have been completed. The first sampling was conducted25-26 August 1998. The second sampling event was conducted 6-7 May 1999. A general *discussion of both sampling events is provided in the following sections. A discussion on »natural attenuation processes in groundwater at BVL is also provided. The data will also be used ?in the development of the long-term BVL groundwater monitoring program. Table 2-6 presents ia comprehensive list of the BVL monitoring wells monitored during the two sampling events and
2'14 flROOOI89
tzJ
*• ^4* f 1 i^d" g,*
"S i—
£ Sea
§kB "V 3L_ W5 >
r-•t "O^ •*— *«
11
en
^
£
1£
«
M
^
x
WN . "3tn =^ w o
« 1 "g> W 3!? « o
1
& «(V ^ M•< _E
V**
Ma
£
|TALMeta
sOH03pCN
gmCNrN
CQNO
caop-
m•t
CQmp-
CQoCN
CQONO00
NO
.d
SOHCQOd
CQVI
3o1-4
o
"3p»
o
3o
o
oNO
(Antimony
ONS
WQ
o
3oCN
CQp-C*l
3oCN
3oOJ
3oCN
3oCN
3CN
O
3_o
•—•
O
CQgOo4
CQO
CQen^
CQCNOO
CQ
O r
CQ
*
CQmS
CO
5
g<N
'irn
soHCQ
£
CQ
3oo
3CNO
3oCNO
3o:o
3od
3oCMd
«n
{Beryllium
ONO\
W«
*""!
3o
3o*+Jo
NO1o
3o
*o
Do%o
3od
3
d
d
u
OP-ON
S
<**O
"gr~>n
O
gOo*
S<N
§m
31
5|n)
SON
UQS::
CNm
3o~ f
3o^
3pf
3o
3o
o
o
- -S
9
1
CoON^
a.33p
CQmj
3o
3o^
3op
3p(-**
3o
3o
2
i
mON
WQ
CN
ONON
3orN
3oCN
3ofNj
3oC4
3o
3o(N
O
u
n
rnONON
UQSvi
3o
3o
3o
3o•
3o•
3o
3o
o
1
Ua|oo<— 1
ogON*-•CN
OOON
r-
00
p-00
*rn
fNO
g
1
ONON
UJSSCN
O
CN
DOM
3o
3o»4
3oW4
3o
3o
m
)|
omr-
o
VO
O
vO
O
omNO
O*nON
OooNO
§f—
' I
§
OOv«
p
p-ten
O0000
00
Ji
m*
«n
(*•
j
mOv
WQSCNSO
op-1cs
3o
Bo
CQoo
CQ
o
CQ«nO
CQid
CQ
d
d
,u
\i
0?ON
Uao
06
3om
3o«n
3ol/
3p«n
3om
3o<n
§
L
o
orN4
oo
"O
M
O
rt
OON— •
1"
§—
!••'1 •
A.
-1
O
Hpm'
CO
•J
CQ*O
•J
3oM
3oN
CQ00p
CQ»nrj
03rM
m
,
ISelenium
mON
WQ
P-4
d
3o——
3rs*-4
3o
3oM
3o•— t
3o^
3o-
p
r/j
Ooo00"»x.
o^
J>
oooON
OO9N
Om3\
S
r
OmON
§—
1
—O
3od
3o— -4
3o••4
3o
3of+4
3o»— «
Do
~3o
"2
iThallium
—O
fflioV
OstN
3o
3om
3pro
3o"O
3am
3om
O•n.
j
•n^
WQ5o
N
33N
*"
3oP-4
3oN
3ors
3o—
3o«s
o(N
1
UBnffObB4>51^
2
1a?:"e0
e
•nON
uTQ211*/ 3-J V~jA oo
M
«
H
NO
S
£D.•M
mON
W
S
> p^*
N
ON
mNOdCN
dN
dN
enOCN
mood
Ueg
euH
CDOCDQC
3
(N
CQ<H
BJ9 ,
'5 —V r.U W
CQ
00
\om
CO
Ten
u oCQ k.w u
•W 3« O
•
V
fl-
-J IE <
CN
3O 00 • - 5 ~ .: S. S: «» *J
X-n Q
md
<nd
«< =
30
m
m
P-
«n
cSl1
NO
OO
NO
00
d
_ »a 4 * i ^ *- •« ^ jr
3
3
3 « rym v ^-
3
« « ta .s 5 a .s g «i »^ »-° w S « -1 (» u •• s yp^&
oom
oo
ON
"3-
m
t*— \r? """ON ™
H ON .2
ai °5~ 1
ri C
g w §• Ioo < 'a 2i\0 U -- Qrs « —1 _.~ 3 c ^•2 §
O o
^ ^vi /™\BO ;£; UJCtf ~" CT3 5* S
Si M ^3 *-*- 'h y Ho u jc .o£ £ H o
O J T3 C*> 5- S M
U4a H
Q, to c M goM "u O ^2 —« > O -S 3• o
"•c SP •aa!*- ,
* .5 JS~S3Oi_ tfl * titO 2J S oo 3> (:? rt S c w f
S < B«
K
.2«S tc IIN—• "o
. a a« & u i 1
L
3 « "E1 £ U O </>
II asi y -1S c I *O ft. . O > « „ _f a - P £ e 'sil•a k. S if Ji3*2 S S5 g « - « — »'
S XB u
"S j
33S SSm
A R O O O I 9 I
i-rtu-7"*?, 1
_1
>
onnCQ
H
QHWN—— »
QWonQ
onUJD•~j^O
Zrntur iuon-JU0OouwtUJ_]5H
W
SJ > 1= £"g w W J
(fl
O 2% > ~« i £ «S ~ j W "JO
Qen
*?Qen
Qen
Oen
Cen
m eO « cen cfl £*** M
9 <" P
enE —
< u Sw * •-
OS
>.«c
&J?"3su*EBos
rnrn
Oo
ji
1mo"
CN"
1„ ..
oCN
00*
ooCN
I Aluminum*
ZCN
Zm
O
Zp-d
Zm•od
r-NO
d
Zoo
o
CQp-d
0o
| Antimony
omm
ONO
-:
in
P-;
r-d
CN
-:
-
o—
| Arsenic
mCN
1,
NO
ON
inCNp-
rnON
P-;
ON
>nNO
OOCN
| Barium
"
OOp-d
ON
d
od
>np-d
d
mmd
od
j?
oo—
NOo
3NOOd
3CNO
3CN
d
3mOd
3
d
3CN
d
3NOOd
od
| Cadmium
oCN
(N
OON
OmriCN"
oONO_
O•O00_
oONNO
-*
O
oo
| Calcium
oo• — '
oNOCN
in
mm
odm
mrnCN
OooCN
PN1
m'rn
T.PN)
O~
| Chromium
P-;m
ON
pm
^
2
min
r-id
Om
"c3•su
oo—
os
CNNO
^
mPNJ
ON
OdCN
ooCN
NO
o—
!
3mCNd
3mCNO
3mCNd
3md
3mP-Id
3
d
3»n<NJd
CMO
u
U
cp2o"
o"
800ON"m
§
P-"
g
fN|
g
CN
1mCN
8o(N
OO
u
I
Oom
O
m
m'p-l
mON
CNNO
ON
m'
s
o«N
eno
1
op,m"
o
^
ooCN,m"
O
rn
ONO
m"
ONO
m
O00«np-T
cp-
1
ooo__"
oo•o
ONP-NO
ON
OP-.
NO
«nON
1M
NO»nr-
•n—
u8
O
CNO
CQON
d
CQONOO
CQONOd
CQmOd
CQSd
CQ£o
CQgd
—o
ggs
op-
oNO
ONOOCN
CNCNCN
NOoo
ONrn
<nNO
CNd
ONrn
O•*
1Z
op.
o
1 '
omp,
g
OCN
r-mNO
OinP-.
p-
| Potassium
3oCNd
OONO
d
CQmd
3
d
CQ00md
CQON
d
CQmd
mo
| Selenium
3od
3oo
3od
300oo
3
o
3od
3od
o—
I
mCNCN
r-
om
»n
m
ON
mm
P
!
CDr--d
CQp-o
CQCN
d
CQ
d
CQ
d
3oood
3od
o— •
| Thallium
p-
r-dm
oo
NO
ONm
NO
ONCN
inm
oin
| Vanadium
oofN
OO
CN
inm'ON
ON
PslenNO
ooON
00
m
rn
OM
i
w
"5«OTriVB
§M"3**B
?me
inoo
pONCN
OOONm
5
r-m"
5
ON
inCNOd
Btuouimv 1
o.o
cpoo
osON"
CN
o8— "
goo"
1CN"
NOcT
grfCN
g»noo"
<pNO"
Bjb
0.
| Total Or
gai
p — i« "° riM O Q
1 s S1« o .E.S ^ J" Q .1V. H flj
U '.J ^3 c T3
S -2 10 tj U— o 5« Q o
1 Is5 a ZLC- «—
Sj tn e**** G C
2 *S .2E p ur-1 CL +**
Z ^-o QM in 2 "S*- ON •£ atU ^- C C
i H S °o * S•- ^c M> i> w 73i CL. *5 S
flj W nj 'Q
** ^ S 'p*-0 w ob .2& r ^ i ^*3 s ^
'2 c x-c S*S o «-Jo u v *S3 Q '1 «n o -) *w _ . i/>"& oo v)•*•> i— e uja 0-5 —-o g g .«fit ftS 0. C .O si O v)• ~i ?• pf*pj rt ,ts *f \> |5 fil SN:O " U rS -^ * '
il i! H!l*™iifi O V "^tsfiSK= «'§• %'-Q Q~*[j[ 6 go. S '5 e <4j i,tl O V ~O ** " V*3f^ rr ^ ^ rt pi— 14
o^ °c c. f l S k ,WT ^^ C ^ ij ' ^ *>*« ^J
"8s- l8||l-S|t 6 0 0 " e 8 Its
** "(S ¥t" 1 a
- ^ 3 g - W - « «'^i iii U fit!-—^ o -^>^.e ^CQ 3 z # +
Xjp— 1UH
Z^
-J>H
UJ
,-J
__J
>
ffiCO
CQ
H
Q
2WSQOJ
on<|•M
ZonW
J
OZ
§t/3nJ
UN —— 1nOOOUJ
^Wt-JpQ
H
M)C'5uu —«£
0 •>e2O
^ W «fc
*• fc a>«w J
£ «£ *J
ONcn5
00en*
en
Qen
31g
sl i*S B*
0 i "O7 u §M * °S * on
OJDC _
<u
SBi1CflB<
I Inorganic
1
|oCN
§
mm"CN
8CNo"
O00
NO*
gp.CN"
OdCN
•tJ
| Aluminum
p
p
Zp-iood
ZCN
ZNONOd
Zod
ZooNOd
NOd
g
'Sa
om
oNO
O
rn(N
—
^
P-;m'
oq
in
p
| Arsenic
NOPS
CN
ONO
mP-I
ON"NO
O
m'm
J
OdfN
09
p
p
NOOOd
m
CN.ood
d
r-d
omd
—
I Beryllium1
oo
NO
o
3md
3CN
d
NOOd
3NOod
CQOd
3§O
CQmd
od
| Cadmium
or-ONCN
OmCN
Or-
oCNm_
O
ri
o
o<N
g
I Calcium
oo^
oNOCN
mNO"m
oONm
ON06CN
S
o06m
Odm
oq
p
I Chromium
ONNO
>noo
£
m'
en
oqrn
NO
pm*
I
Oo^
oNO
ooCNm
NO
m
rnoo"CN
OJ
CN
oqoi<N
(Nm
p
U
3md
3md
3mCNd
3mCNd
3mCNd
3m(Nd
3md
d
| Cyanide*'
poo•J
^oo
gP--in
8ONNO
8p-ONCN
800ON"
8o"
8p-~
im"
Od
\
oomfN
Om
O•op-1
fN
mp-i
m"
oqrnm
oqrn
ONpn
md
3
NO
"*
Op-«n"*
g
Op,m"
Ooo
o«nrn
gmp
g
_,
j
ooo*—"
os1
oONO"
O00
"""
r-ON
ONNO
mO
00NO
r-
in
u
|
OCN
CNO
3mO
CQOrNO
CQON
d
CQONd
CQCN
d
1d
1d
d
j
omP-
ONO
P-;
CN
ON
NOOO
ON00p-1
CN
OON
NO<N
O
Z
moo
ooCNOO
O00
OmO
mmm
NO
m
NOmm
g
•S
a.
CQod
3oCNd
SCNd
3od
CQCNd
CQod
3oPMd
md
| Selenium
3
d
3od
ONO
d
3od
3od
3od
3od
p
1Cfl
S
S
p~
«nCN
PN
in
CN
1
1
COON
d
CQNO
d
d
CQr-d
CQmd
CQ
d
CQr-d
p
i
in
TTCONO
inNO>n
2
00
NOONCN
vi
Om*
j
0oCNVI
oofN
mO
rn
ON
CNCNON
CN
CNO
NOON
2
pCN
|
8BM£Jo"eS
Bri•5S<t*•
GeIt•=BI|
mOfN
pm'
^
inoo
cnCN
in
CNd
IPmCN
|
<r>oOO
ooo'
0
^~"
100ON
NO,
ON
ON"mCN
8
800rim
8«ns"
NO"
B
r t'ud
H
*> "19 r—]
1 s•*- oc ^li ,-yw y
£ -gtn • —u J— c> .2
- s^ Q
1 gat isiT> c£ 5o isS ^r- O-u . -Q
4-1 ON 5C ON U
i H •£0 -S -S1-1 2 c1 H.IW W U£ •< «o UJ ob
M ti- "S C c:S O j2, <% a*o Z^
o *° T 13 00& o • £•o b ia & S.
ii ItC M UK B411 IS
4J CJtA "^ C S
•3 2 «
fr « SQ "** S3 2-3 +* ^^ U "O «rj
§*« $
.« C - "S 8.B fe e.J &D £ £2 a:
-JQ
RROOOI93
TABLE 2-6 GROUND-WATER MONITORING WELLS SELECTED FOR THE BUSHVALLEY MONITORING PROGRAM
~ Well
GM1-LSS
GM-2-LSS
GM-2-LSD
GM3
GM4-LSS
GM5
GM6
GM7
GM8
GM9
EA10
EA11
EA12
EA13
Rationale for Inclusion inMonitoring Program
Considered an onsite well due toimpact by organic constituents.
Onsite (downgradient well)
Onsite (downgradient well)
Onsite (downgradient well)
Onsite (downgradient well)
Onsite (downgradient well)
Onsite (downgradient well)
Onsite (downgradient well, butwill be evaluated for potentialuse as a second background well)
Onsite (downgradient well)
Considered an onsite well due toimpact by organic constituents.
Selected as a background well
Selected as a downgradient well
Selected as a downgradient well
Selected as a downgradient well
Total DepthFrom Ground
Surface
42.0
27.5
39.5
15.0
15.0
16.0
20.3
13.0
12.0
40.0
17.5
17.0
18.5
18.0
Top ofCasing
Elevation(MSL)
39.51
27.66
27.81
10.46
11.10
12.36
16.44
10.84
9.24
36.32
12.21
3.59
9.46
2.57
Elevation ofGroundSurface(MSL)
37.91
26,09
25.88
8.55
9.04
10.46
14.65
8.54
7.32
34.65
10.41
1.24
7.55
1.24
AROOOI94
selected for inclusion into the monitoring program. The new wells, EA-10, EA-11, EA-12, andEA-13, since they were installed in April 1999, were only sampled once.
Groundwater samples were collected using the low-flow method, in accordance with the FinalRDWP (EA 1998). Groundwater quality and elevation data were recorded on field purgingsheets and are included in Appendix E. Groundwater quality parameters included pH,conductivity, oxidation-reduction potential (ORP), temperature, turbidity, and dissolved oxygen.Groundwater samples were submitted to Severn Trent Laboratories (formerly EA Laboratories)and analyzed for the following:
• Target Compound List (TCL) Volatile Organic Compounds (VOC) using EPAMethod 8260
• Target Analyte List Metals (TAL) using EPA Method SW846
* Anions (nitrate and sulfate) using EPA Method 300.0
• General Chemistry (alkalinity, ammonia, cyanide, ferrous iron, hexavalent/chrome,and TOC) using Method # 310.1, 350.1,9012, SM3500DFe, ASTM 7196, and 415.1,respectively
Onsite analysis of hydrogen (Hz) and methane (CH4) was conducted during the August 1998 andMay 1999 sampling events. Field samples were collected in accordance with the Final WorkPlan.
Field Screening Analysis
Compound-specific identification and quantification was performed using an onsite gaschromatograph (GC) and reduction gas analyzer (RGA).
For the identification and quantification of CH^a Varian 3300 GC equipped with flameionization detector (FID) and packed column was utilized. Due to the nature of CR*, anisothermal temperature program was utilized. An RGA was used for the identification andquantification of HI-
Calibration was performed by injecting a known amount of a single compound vapor standard ata known concentration. This process was then repeated several times. The data from these
2"15 flROOOI95
injections was then used to determine a response factor for the analyte of interest. This thenallowed for the determination of the vapor concentration for the analytes of interest. The vaporconcentration was then transformed into an aqueous concentration using Henry's Law.
For QA/QC, multiple standard analyses, blanks, and spiking were conducted to ensure that theanalytical system was producing defensible results.
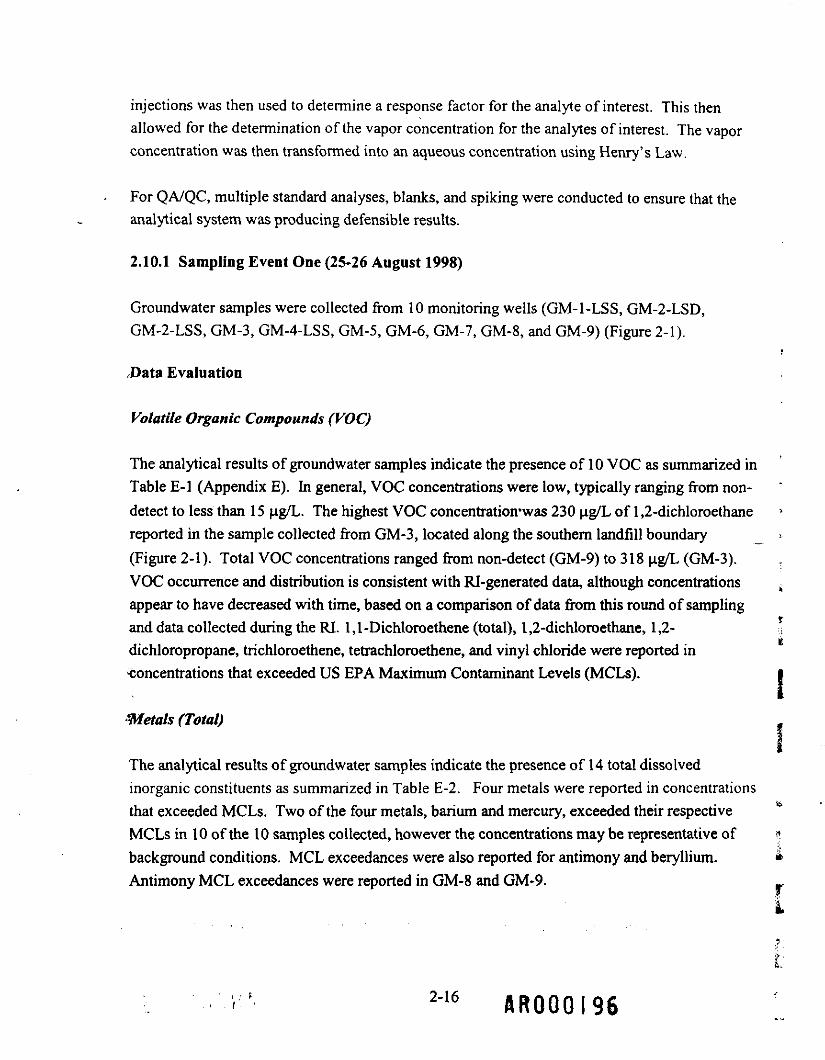
2.10.1 Sampling Event One (25-26 August 1998)
Groundwater samples were collected from 10 monitoring wells (GM-l-LSS, GM-2-LSD,GM-2-LSS, GM-3, GM-4-LSS, GM-5, GM-6, GM-7, GM-8, and GM-9) (Figure 2-1).
.Data Evaluation
Volatile Organic Compounds (VOC)
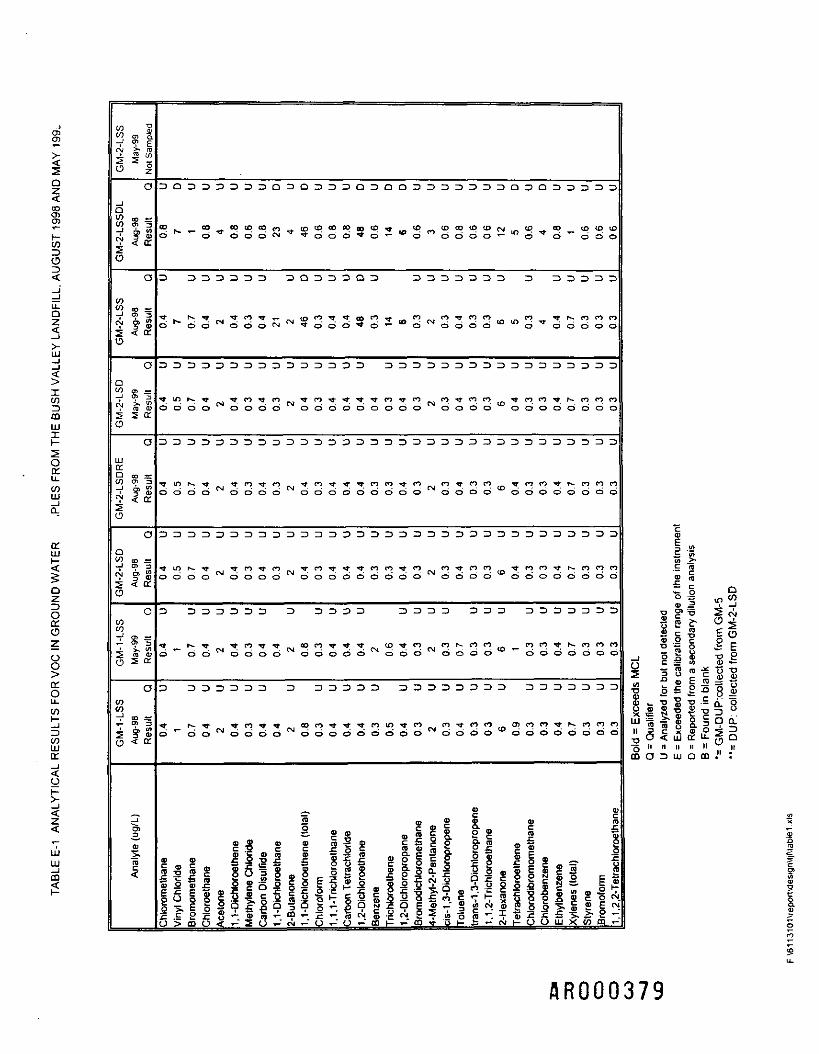
The analytical results of groundwater samples indicate the presence of 10 VOC as summarized inTable E-l (Appendix E). In general, VOC concentrations were low, typically ranging from non-detect to less than 15 ,ug/L. The highest VOC concentration'was 230 fig/L of 1,2-dichloroethanereported in the sample collected from GM-3, located along the southern landfill boundary ___ >•(Figure 2-1). Total VOC concentrations ranged from non-detect (GM-9) to 318 ng/L (GM-3).VOC occurrence and distribution is consistent with Rl-generated data, although concentrations .appear to have decreased with time, based on a comparison of data from this round of samplingand data collected during the RI. 1,1 -Dichloroethene (total), 1,2-dichloroethane, 1,2- ;
•2dichloropropane, trichloroethene, tetrachloroethene, and vinyl chloride were reported inconcentrations that exceeded US EPA Maximum Contaminant Levels (MCLs). I
Metals (Total)
The analytical results of groundwater samples indicate the presence of 14 total dissolvedinorganic constituents as summarized in Table E-2. Four metals were reported in concentrationsthat exceeded MCLs. Two of the four metals, barium and mercury, exceeded their respectiveMCLs in 10 of the 10 samples collected, however the concentrations may be representative of t»background conditions. MCL exceedances were also reported for antimony and beryllium. *Antimony MCL exceedances were reported in GM-8 and GM-9. ™
2-16 AROOOI96
General Chemistry
The analytical results of groundwater samples collected for the identified general chemistryparameters are summarized in Table E-3. Alkalinity ranged from 5.7 mg CaCO3/L atGM-l-LSS to 224 mgCaCO3/L at GM-3. Ammonia was reported at eight wells ranging from,0.11 mgN/L at GM-l-LSS to 3.1 mg/N/L at GM-3. TOC ranged from 1.2 mg/L at GM-9 to6.7 mg/L at GM-8. Nitrate was reported at three wells ranging from 0.1 mg/L at GM-8 to2.2 mg/L at GM-5. Sulfate was reported at all 10 wells ranging from 0.56 mg/L at GM-2-LSD to41 mg/L at GM-5. No MCL exceedances were reported for the general chemistry parameters.
2.10.2 Sampling Event Two (6-7 May 1999)
Groundwater samples were collected from 13 monitoring wells (GM-l-LSS, GM-2-LSD, GM-3,GM-4-LSS, GM-5, GM-6, GM-7, GM-8, GM-9, EA 10, EA11, EA12, and EA13,) (Figure 2-1).Monitoring well GM-2-LSS was not sampled due to high concentrations of methane gas andhealth and safety considerations. Off-gassing was observed at the time of sampling and vaporsamples collected and analyzed onsite by GC revealed the presence of elevated concentrations ofmethane. The well was left uncapped and reassessed for potential sampling. Off-gassing fromGM-2-LSS had not decreased after several hours. Consequently, sampling of GM-2-LSS wasdiscontinued due to health and safety concerns, and the well was recapped and locked.
Data Evaluation
Volatile Organic Compounds (VOC)
The analytical results of groundwater samples collected during the May 1999 sampling eventindicate the presence of 10 VOC as summarized in Table E-l (Appendix E). In general, VOCconcentrations were low, typically ranging from non-detect to less than 5 ug/L. The highestVOC concentration was 20 ug/L of 1,2-dichloroethane reported in the sample collected fromGM-3, located along the southern landfill boundary (Figure 2-1). Total VOC concentrationsranged from non-detect (GM-7 and GM-9) to 80 ug/L (GM-3). VOC occurrence anddistribution for the May 1999 analytical data is consistent with RI and August 1998-generateddata, and concentrations appear to decrease with time when compared to previous data. 1,1-Dichloroethene (total), 1,2-dichloroethane, and vinyl chloride were reported hi concentrationsthat exceeded MCLs.
AROOOI97
Metals (Total)
The May 1999 analytical results of groundwater samples indicate the presence of 20 totaldissolved metals as summarized in Table E-2. Six metals (antimony, arsenic, barium, beryllium,mercury, and nickel) were reported in concentrations that exceeded MCLs. MCL exceedancesfor barium were reported in each of the 13 monitoring well samples collected. The highestbarium concentration (204 mg/L) was reported in EA-10 the background monitoring well, anindication that the barium reported in onsite samples may be representative of ambientconditions. MCL exceedances were most frequent in the sample collected from GM-6. Theanalytical results for GM-6 revealed MCL exceedances for antimony, beryllium, mercury,nickel, and selenium, however, the reported concentrations for antimony and beryllium wereless than the background concentrations.
General Chemistry
The analytical results of groundwater samples collected for the identified general chemistryparameters are summarized in Table E-3. Alkalinity ranged from 8.3 mg CaCO3/L atGM-l-LSS to 268 mgCaCO3/L at GM-3. Ammonia was reported at thirteen wells ranging from0.17 mgN/L at GM-l-LSS to 2.1 mg/N/L at GM-4-LSS. TOC ranged from less than 1.0 mg/L(GM-9, EA-11, EA-13) to 6.7 mg/L at GM-6. Nitrate was reported in concentrations rangingfrom less than 0.50 mg/L at GM-3 to 1.1 mg/L at GM-5. Sulfate was reported at alll 0 wells ,ranging from 0.15 mg/L at GM-2-LSD to 94 mg/L at GM-8. For GM-7, hexavalent chromium k(0.014 mg/L) was reported in a concentration that slightly exceeded just one-tenth of the non-
r
carcinogenic RBC for hexavalent chromium of 0.11 mg/L. No MCL exceedances were reportedfor the general chemistry parameters.
silT,
fSummary of Analytical Results *
The VOC concentrations varied slightly between the August 1998 and May 1999 ground-water !sampling events and concentrations appear to be decreasing with time. The occurrence anddistribution VOC constituents, however, remains consistent with RJ-generated data. The highestVOC concentrations occur in ground water on the south side of the landfill (GM-3 and GM-2-LSS).
•Significant changes in metals concentrations were not observed between the August 1998 and _May 1999 sampling events. Although MCL exceedances for metals were reported for several £wells, background concentrations may be responsible, particularly for antimony and barium.
2-18 ffROOOI98
Background concentrations and long-term changes in groundwater quality can be better assessedas additional data becomes available through the groundwater monitoring program.
Additional discussion of water quality is provided in the following section on NaturalAttenuation.
Quality Control (QC) Evaluation
Analytical QC was evaluated on the basis of laboratory method performance and sampleperformance. Field collected QC samples included trip blanks, field duplicates (GM-DUP-1,collected from GM-5 during the August 1998 event and DUP from GM-2-LSD and MS/MSDs.In summary, the data are generally of good quality and significant impacts to data usability arenot anticipated. The analytical results of the QC samples are provided in Table E-4. Thelaboratory analytical narratives, which include comprehensive discussions of QC results, areprovided in Appendix E.
2.103 Discussion of Natural Attenuation
2.10.3.1 Background
A possible environmental impact of landfills, such as Bush Valley, is the impact of groundwaterby leachate. Dramatic changes in aquifer geochemistry and microbiology are quite commonwhen landfill leachate comes into contact with native groundwater. The introduction of organicmatter (typically indicated by total organic carbon [TOC] data) and inorganic constituents suchas methane, ammonia, hydrogen sulfide, and dissolved iron into an aerobic aquifer leads tooxidation-reduction (redox) buffering reactions. Iron is one of the primary inorganic speciesdriving these redox reactions. Redox reactions typically range from methanogenic conditions
1- ' ..• • '.»•..- ,- •' ";• , '"''.'.close to the landfill, to sulphate-reducing, iron-reducing, manganese-reducing, and denitrifyingconditions, to aerobic conditions at the periphery of a leachate plume.
2.10.3.2 Interpretation of Results Monitoring
Two groundwater sampling events were conducted as part of the remedial design. The majorityof monitoring wells are located on the periphery of the landfill area, hence it is difficult tointerpret the extent of individual redox zones. However, it is clear from the geochemical datathat highly-reducing conditions are prevalent at the landfill periphery. Dissolved oxygen (DO)concentration ranges from 0.1 to approximately 2.5 mg/L within the landfill boundary, with the
flROOOI99
exception of GM5. GM5 reported DO concentrations of 10.8 (August 1998) and 5.4 (May1999). The upgradient well to the west of the site, GM9, reported DO concentrations of 8.5 and3.3 mg/L in August 1998 and May 1999, respectively. These DO concentrations indicate thatgroundwater migrating into the landfill area is aerobic. In addition to the DO data, otherinorganic geochemistry supports the highly anaerobic nature of groundwater once it reaches thelandfill area.
Dissolved hydrogen concentrations at Bush Valley range from manganese-reducing (<0.05 nM),iron-reducing (<0.2nM), and sulfate-reducing (1-1.5 nM), to methanogenic (>5 nM). WellsGM2-LSD, EA-13, GM4-LSS, GM5, and GM6, all downgradient from the landfill, reportedhydrogen concentrations in the methanogenic range. Wells outside the landfill area andperpendicular to groundwater flow (GM8, GM7, EA-11, and GM3), reported hydrogenconcentrations in the sulfate and iron-reducing range.
Iron primarily occurs as iron oxides (Fe+3) and hydroxides in the presence of organic matter(such as organic carbon from landfill leachate) and will readily be reduced to Fe+2 or ferrousiron. Ferrous iron concentrations at the Bush Valley Landfill range from <5 mg/L in theupgradient well, GM9, to 4730 mg/L in EA-12, located downgradient of the landfill. UnlikeFe+3, Fe*2 is quite soluble in water and will migrate with groundwater flow.
The presence of excess Fe+2 (four orders of magnitude greater than that found in the upgradientwell) in groundwater is a good indicator of the redox buffering capacity of the aquifer sedimentand helps mitigate the impact of leachate (indicated by TOC) offsite. Total organic carbonvalues range from <1.0 mg/L in GM9 (upgradient) up to 6.7 mg/L in GM6. TOC concentrationswithin the landfill are likely to be significantly higher than those reported at the landfilliboundaries. The low redox environment created by groundwater deficient hi DO, has allowedredox processes such as iron reduction and methanogenesis to dominate. It is apparent from thedata collected during the two groundwater sampling events that natural attenuation processes arepositively impacting groundwater downgradient of the Bush Valley Landfill.
It should be noted that the evaluation of natural attenuation is an ongoing process. The Post-Construction Sampling and Analysis Plan proposes the continued monitoring of the groundwaterfor general chemistry parameters that are the indicators of natural attenuation. Data from thesefuture sampling events will be utilized to monitor the status of natural attenuation at the BushValley Landfill.
f, .1 2-20AR000200
2.11 AIR SAMPLING AND ANALYSIS
In order to assess the offsite transport of airborne VOC as well as the impacts that suchemissions may have upon onsite personnel and the adjacent community, an ambient airmonitoring program was performed around the perimeter of the BVL site. Two air samplingevents (8 and 22 September 1998) were conducted at the same locations with the samemethodology. To ensure the quality and accuracy of ambient air VOC measurements, a series ofgeneral field sampling procedures, field quality assurance/quality control (QA/QC), andlaboratory QA/QC procedures were employed throughout the program. A summary of the airmonitoring and sampling program is presented in Table 2-7.
TABLE 2-7 AIR MONITORING AND SAMPLING PROGRAM
Parameter
TO- 14 VOC
FieldSamples
6
QualitySam
CollocatedSamples
2
Controlpies
FieldBlanks
2
Total No.of
Analyses
10
AnalyticalMethod
TO- 14
Preser-vation
None
HoldingTimes
Analyze:14 days
Containers6-liter (L)Summacanisters
2.11.1 General Field Sampling Procedures
U.S. EPA Method TO-14 using Summa evacuated canisters was used for the sampling events.Upon receipt of the 6-L sample canisters from the laboratory, all equipment was inspected fordamage and signs of leakage. On the day of each sampling event, the Davis Weather Monitor nmeteorological equipment was installed to assess wind direction and to ensure its properfunction. Throughout each day of sampling, the wind speed and direction were checked toensure that the upwind/downwind orientation of the sampling sites was generally consistent withactual site observations. These sampling locations were selected during a preliminary site visitin September 1998 and were based on the typical meteorology for this area of Harford County(winds out of the south/southeast). One sampling site was established approximately 500 ft fromthe southeast corner of the landfill property line to measure upwind ambient air VOCconcentrations, and two were placed downwind of the landfill along the northwest limit of thelandfill waste as determined by the RI (Figure 2-7). Care was taken to establish these locationsas far as practical from vehicle traffic and other interferences. Sampling locations are shown onFigure 2-7.
The TO-14 sample canisters were transported to the sites and assembled. Each sample consistedof a paniculate prefilter, flow controller with vacuum gauge, and 6-L canister. Initial canister
RR00020I
pressures were then checked and recorded. A canister vacuum less than 25 in. of mercury wouldindicate canister or valve leakage during shipment. Canister intakes were located at a height ofapproximately 2 ft above the ground. After sampler placement, the canister valve was opened toinitiate the 8-hour sampling event, which typically ran from approximately 0800 to 1700 hours.To ensure that a Comparable volume of sample was obtained at each of the sampling locations,each canister was equipped with a flow controller that was set to obtain an 8-hour sample. Sincethe recommended sample volume is 5 L (five-sixths full), sample flow was set to approximately10.4 ml/min. This ensured that the canister was still under vacuum upon the conclusion ofsampling. After the 8-hour sample period, the canister pressure was again checked and recorded.Canister sampling was then discontinued, and the samples were dismantled and shipped to theanalytical laboratory. Gas chromatograph/mass spectrometer (GC/MS) analysis of the sampleswas conducted by Air Toxics, Ltd. of Folsom, California under subcontract to EA. Both initialand final vacuum pressures were recorded on the chain-of-custody forms sent to the laboratory.Upon receipt of the canisters, the laboratory immediately verified the final vacuum to ensure thatcanister leakage had not occurred during transport. Any out-of-the-ordinary circumstances notedduring the sampling event were also recorded. Meteorological data (wind speed, wind direction,temperature, and barometric pressure) were recorded at 15-minute intervals over the course ofthe sampling event and are presented in Table 2-8.
Results of the air sampling are presented in Table 2-9. Based on the laboratory results of the twosampling events, eight compounds were detected above TO-14 analytical detection limits:1,4-dioxane, acetone, carbon disulfide, chloromethane (methyl chloride), ethanol (ethyl alcohol),methylene chloride, toluene, and vinyl chloride. See Table 2-9 for the sampling event, location,and concentration of each compound detected. All of the eight compounds detected, with theexception of 1,4-dioxane, ethanol, and vinyl chloride, were previously detected in ambient airsampling conducted for the RJ dated November 1994. f
U
Although the source of each compound detected is difficult to assess, literature (U.S. EPAAP-42, Section 2.4, November 1998) indicates that acetone, carbon disulfide, chloromethane,ethanol, methylene chloride, toluene, and vinyl chloride may be from the landfill while1,4-dioxane may or may not be from the landfill. Based strictly upon an upwind/downwindcomparison of the results presented in Table 2-9, it appears that vinyl chloride, methylenechloride, toluene, 1.4-dioxane, chloromethane, and ethanol may originate from the landfill. :However, other possible local sources of these compounds cannot be ruled out. Also noted inTable 2-9 are the U.S. EPA Region III risk-based concentrations (RBCs) for the compounds rdetected. As shown in the table, TO-14 results for four of the compounds detected during the air L
2'22 ftR000202
&R000203
TABLE 2-8 METEOROLOGICAL DATA FOR AMBIENT AIR SAMPLING EVENTS
BAROMETER(IN. OF HG)29.61429.61429.61829.62929.64629.64229.64229.63829.65929.6729.66929.67429.67829.67529.67629.68329.68629.67629.68229.68329.69129.70829.71829.7229.72129.7129.70229.69229.67829.66729.65829.66329.66229.66629.66129.66129.66529.65629.652
HI OUTTEMP(°F)68.869.670.570.371.376.780.374.976.881.278.277.877.779.979.479.676.877.581.586.886.384.387.583.78182.487.986.683.279.976.573.573.475.67573.873.273.27373.972.871.5744
_As part of the ambient air monitoring QA/QC program, both collocated samples and field blankswere obtained. The collocated sample was an additional canister within 3 to 4 ft of thewesternmost downwind sampler. The purpose of this second canister was to evaluate theprecision of the sampling results. Field blanks were taken to assess whether the canistercertification procedures employed by the laboratory prior to canister shipment and actual fieldprocedures were a source of contamination. In addition to field QA/QC procedures, thelaboratory performed routine laboratory blank analyses. Lab blanks consisted of the analysis ofone randomly chosen empty canister that had been certified as "clean." This canister wascharged with humidified zero air and analyzed along with the received sample canisters.Additional laboratory QA/QC consisted of surrogate recovery, method spikes, and instrumentcalibrations. Samples were analyzed within 14 days of sample collection, which meets orexceeds TO-14 guidance regarding sample holding times.
The results of the collocated canister sampling compared favorably with each other during bothair sampling events. For the first sampling event, toluene and acetone were detected above thedetection limit in both samples with comparable consistency. Chloromethane was detected inone sample but not in the other; however, its detection is marginally above the detection limitand is based on an estimated (data qualifier "J") technique. See Table 2-9 for an explanation ofthe "J" data qualifier. For the second sampling event, chloromethane and ethanol were detectedin one sample but not in the other; however, their detection is slightly above the detection limitand is also based on the estimated (data qualifier "J") technique mentioned above.
The results of the field blanks for both sampling events showed the detection of compoundsabove analytical detection limits. For the first sampling event, methylene chloride was detected.This is most likely attributable to contamination in the field since methylene chloride wasdetected in another sample. For the second sampling event, carbon disulfide was detected wellabove the analytical detection limit. Given the magnitude of the detected amount and the factthat carbon disulfide was not detected in any other samples, it is likely that either the sourcecanister or receiving (sampling) canister was contaminated at the lab either before shipment tothe site or during analysis at the lab.
2'23 AR000207
All laboratory blank samples resulted in "not detected" for all of the Method TO-14 targetcompounds.
2.12 SITE ACCESS AND EASEMENT REQUIREMENTS
EA developed the remedial design to minimize the impact of the remedy on surroundingproperties. Adjacent properties that will be impacted by remedial construction and post- •'construction monitoring activities during the remediation are as follows:
Parcel ^ Owner
P670 Eleanora B. VesselsP642 State of Maryland, Department of Natural ResourcesP598 State of Maryland, Department of Natural Resources
Impacts to these three properties during construction are anticipated to be limited to grading,access for construction equipment, and installation of groundwater monitoring wells and landfillgas monitoring probes.
Access is required for landfill gas, groundwater, surface water and sediment monitoring, andregular inspection of the integrity of the cap.
?EA has identified the parcels for which access agreements and easements will be necessary. *Figure 2-8 shows the anticipated required easements. Permanent easements will be required forthose areas beyond the site property boundaries on which permanent construction features \(grading, fencing, etc.) will be placed. Temporary easements are necessary for constructionequipment to gain access around the site; no permanent construction features are anticipated for \these areas. Access agreements and easements for construction will be further pursued byHarford County as the design progresses. *
2'24 HR000208 M
RR000209
3. LANDFILL CAP DESIGN
3.1 SCOPE AND PURPOSE
The-BVL cover system has been designed to conform with the requirements of the ROD. Thelandfill will be capped using a geosynthetic capping system as shown on Figure 3-1. A beddinglayer of varying thickness will be placed on top of the existing waste before the geosynthetics areplaced. The geosynthetic layers will consist of a gas venting layer above the bedding layer, ageomembrane, and a drainage layer. The geosynthetic layers will be covered with a 2-ft depth ofsoil. The cover system meets the standards of Maryland Sanitary Landfill Closure Regulations,COMAR 26.04.07.21 A, B, D, and E, and is also in conformance with the single barrier coversystem specifications presented in the EPA Municipal Landfill Guidance (EPA/540/P-91/001)and the ROD, dated September 1995.
Further detail concerning each cover system component is presented later in this chapter. Thischapter also addresses:
• Site Grading• Stormwater Management and Site Drainage• Passive Gas Venting System-• Settlement and Slope Stability Considerations• Groundwater Monitoring Program• Ecological Monitoring Program• Future Use Restrictions
Calculations prepared in support of the closure cap design are presented in Appendix F.
3.2 SITE GRADING
In accordance with the substantive standards of Maryland Erosion and Sediment ControlRegulations, COMAR 26.17.01.01,26.17.01.05 A and B, 26.17.01.07 B, and 26.17.01.08 A andB, the site will be graded to promote surface water drainage off of the landfill cap surface.Surface water drainage control off of the cap reduces the potential for erosion and provides anadequate factor of safety for slope stability; The proposed final grade for the closure cap isshown in Figure 3-2 and on the drawings; The high point of the cap will be positione4>in thewest-central portion of the landfill. The cap will be graded provide a minimunr4.0 percent
3-1 flR0002IO
slope on the upper landfill cap surface, thus promoting positive drainage from the cap whileminimizing the potential for erosion of the cap final cover. The final grades are oriented to forma ridge-line in a general southwest/northeast direction.
The existing slope along the BVL site ranges from approximately 1.5H:1V to 6H:1V. Site slopeswill be graded to adjust for more consistent grades, with maximum slopes of 3H: 1V within thelandfill cap area and minimum slopes of 2H:1V beyond the limits of the landfill cap. Theproposed final grade of the closure cap is shown on the drawings.
3.3 STORMWATER MANAGEMENT AND SITE DRAINAGE
t3.3.1 Surface Drainage
The closure cap has been graded to allow for surface drainage to drain radially off of the cap,ultimately discharging under sheet flow. In areas where the surface drainage may otherwise tendto become concentrated flow, benched slopes will convey surface water drainage under channel ?flow to riprap-lined slope drains. The slope drains will convey the drainage to the base of the ^landfill slope. Slope Drain Nos. 1, 3,4, and 5 will convey the drainage into the temporarysediment traps (or in the Case of Slope Drain No. 5, into a channel leading to a sediment trap),while Slope Drain No. 2 will convey the drainage from the base of the landfill slope towards thewetland to the north. At the outlet of each slope drain, a level spreader will be used to dissipate Iithe energy of the stormwater discharge and convey the discharge away from the cap as sheetflow. Similarly, at the outlet of each temporary sediment trap, a riprap apron will be used to %convey the discharge away from each temporary sediment trap as sheet flow. The sheet-flow ifrom the cap and sediment traps will be released to the existing surrounding wetland areas to the »east, north, and southeast, and towards Bynum Run Creek to the north. Drainage will also be |released towards the existing drainage swales along Bush Road to the west and along thesouthern perimeter of the landfill. These drainage swales convey surface drainage to Bynum Run £Creek and wetland areas to the east, respectively.
The slope drains and benches will be sized to carry the peak discharge of a 24-hour, 25-yearfrequency storm at a non-erosive velocity. Calculations supporting the detailed design of the ?slope drains and benches are presented in Appendix G. Surface water drainage calculations ^(comparing existing site conditions to the proposed developed conditions) are also presented in „Appendix G. .Stormwater management devices are designed in accordance with the requirements ||of the Maryland Stormwater Management Regulations, CQMAR 26.17.02.02,26.17 2.85 A andB, 26.17.02.06 A(2), and 26.17.02.08. $j
'^'? C / 3-2 ftRQOOZM 11
IOO
SO
tro|o»IT
IR0002I2
HR0002I3
3.3.2 Subsurface Drainage
A subsurface geosynthetic (geonet) drainage layer (described in Section 3.4.1) will beconstructed on top of the low-permeability geomembrane of the closure cap. Infiltratingprecipitation will drain by gravity off the surface of the closure cap, discharging through theperimeter daylighted drainage system. The daylighted drainage system (shown on theMiscellaneous Details sheet) will be sloped to provide positive drainage away from the cap andwill release collected drainage as sheet-flow from the landfill. The drainage will flow from theperimeter of the landfill in the same manner as described in Section 3.3.1.
3.3.3 Sediment Control
Temporary sediment control during construction will consist of a stabilized construction entranceoff of Bush Road, silt fence and super silt fence positioned along the perimeter of the site, andtemporary sedimentation basins. The two existing stormwater ponds in the northeast andsoutheast corners of the landfill will be excavated and regraded for use as sediment traps toprovide for temporary control of sediment release during construction. A third sediment trap isproposed for the southwest corner of the site. Upon completion of the closure capping systemand proper stabilization of the entire drainage area, each of the sediment traps will no longer berequired and will be abandoned. Abandonment of the temporary sediment basins will be inaccordance with Maryland Erosion and Sediment Control practices. Calculations supporting thedesign of the sediment traps are presented in Appendix H.
Of the total 29-acre parcel, a total of 18 acres will be disturbed by this proposed construction anddevelopment; however, only approximately 14.8 acres are considered within the BVL drainagearea boundaries. The site area consists of five individual drainage areas; the Existing SiteConditions map and both the Existing and Proposed Conditions Drainage Area maps arepresented in Appendix G.
The Soil Conservation Service TR-55 hydrologic method was used to determine the compositerunoff curve number (CN) and time of concentration (tc) for the site drainage area under theoriginal existing conditions in 1986 and the proposed post-developed conditions. The TR-20hydrologic model was used to route the stormwater runoff of the 2-, 10-, and 100-year stormevents for the existing and post-developed conditions. The TR-55 and TR-20 worksheets andrelevant calculations are included in Appendix G. All curve numbers were developed assuminggood hydrologic conditions. Individual drainage areas and flow paths were determined for both
AR0002U
conditions. The site drainage area and condition for the existing conditions were based on aerialphotographs taken during the period 1980 to 1986. The site drainage area and condition for theproposed post-developed condition were based on the proposed design for closure of the landfill.The figures used for the hydrologic models for existing conditions and post-developed conditionsare included in Appendix G.
Based upon the 1986 aerial photograph, as shown in Appendix G, the original area of this sitewas significantly disturbed by the past landfilling operations. In 1986, the site consistedprimarily of exposed earth and sporadic vegetation (grass). The current vegetation on the site,consisting of wooded and grassed areas, will be removed prior to the proposed development.After closure, the area will be revegetated with a native grass species, which will promote thedevelopment of habitats. Grasses suitable for support of ecological habitats will be used tostabilize the final closure cap. The hydrologic analysis indicates that stormwater managementfacilities are required for the site to attenuate the post-development runoff to levels near theexisting conditions for the 2- and 10-year storm events.
Flow routing computations were performed for each individual drainage area considered underthe existing and post-developed conditions. The computed runoff for each individual drainagearea was totaled for each respective storm event. The results of the TR-20 hydrologic flowrouting analysis for both the existing and post-development conditions of the site are summarizedbelow in Table 3-1:
TABLE 3-1 HYDROLOGY SUMMARY
~ Storm Event
2-year1 0-year100-year
Total FlowExisting
Conditions*(cfs)33.967.9104.6
Total FlowPost-DevelopedConditions
(cfs)18.444.675.0
Percent Change(Total Existing to Total
Post-Developed Condition)- 45.6 %-34.3 %- 28.3 %
* Based upon
As shown by the above table, there is a net decrease in the stormwater runoff from the site due tothe proposed development. As a result of the estimated decrease in stormwater runoff betweenthe existing and post-developed conditions, a waiver of stormwater management requirements isbeing sought from Harford County for the closure of the Bush Valley Landfill.
3-4 flR0002IS
ll
3.4 CAPPING SYSTEM COMPONENTS
The final closure capping system is designed to minimize infiltration of precipitation into thelandfill and to reduce the potential for contact with the waste. The closure capping system willutilize geosynthetic materials and a soil cover to accomplish this purpose (Figure 3-1). Theclosure capping system is in conformance with the Maryland Sanitary Landfill ClosureRegulations, COMAR 26.04.07.21 A, B, D, and E. The capping system is described in thefollowing sections.
3.4.1 Geosynthetic Cover System
Bedding Layer
The bedding layer will consist of a compacted fill layer of varying thickness located directly onthe surface of the landfill, over the waste. At present, the landfill is covered with a soil layer ofvarying thickness, 0 to 6 ft. The bedding layer will provide a cover soil system over the waste tosupport the geosynthetic layers of the closure capping system. A minimum of 2 ft of soil isrequired above the waste prior to the installation of the geomembrane (COMAR 26.04.07.10F).The cover soil will be placed to ensure the minimum bedding layer thickness of 2 ft.
Gas Transmission Layer
The gas transmission layer will be comprised of geosynthetic materials, consisting of a geonetenveloped by a geotextile filter fabric. This layer will provide a safe means of passivelytransporting landfill gas, which may accumulate under the low permeability barrier layer of theclosure cap. The gas transmission layer will serve to equilibrate gas pressures below the landfillcap. Landfill gas will be transmitted through this layer toward the passive gas vents of theclosure cap. Passive gas vents will be constructed throughout the closure cap to vent gastransmitted by the geosynthetics. A discussion of the passive gas system is presented inSection 3.5.
Hydraulic Barrier Layer
The purpose of the hydraulic barrier layer is to minimize or prevent infiltration of precipitationinto the waste. The reduction of precipitation reaching the waste minimizes the decompositionof the waste material, hence reducing the generation of landfill gas and leachate. Geosynthetic
AR0002I6
and7or natural soil materials are both commonly used. Although many materials are availabletwo of the most appropriate types used for landfill closures are natural soil material (clay lim_and geomembranes [linear low density polyethylene (LLDPE) membranes].
COMAR 26.04.07.21 permits the use of either a clay liner or a geomembrane liner for use as thelow permeability layer or hydraulic barrier layer of the closure capping system. An economiccost comparison of each lining system was conducted to determine the most cost-effectivesystem. As per COMAR 26.04.07.21, a hydraulic barrier layer constructed of soil materials mustbe a minimum 1-ft-thick soil layer with a permeability of 1 x 10"5 cm/sec. The ROD, however,requires the use of a 2-ft-thick soil layer with a permeability of 1 x 10'7 cm/sec. In order to beconsistent with the intent of the ROD, a hydraulic barrier layer consisting of a 2-ft-thick layer ofsoil material with a permeability of 1 x 10"7 cm/sec was compared to a closure capping systemusing a 40-mil LLDPE geomembrane.
The clay capping system utilizing a 2-ft-thick clay layer would require more than 43,000 cy ofmaterial that has a permeability no greater than 1 x 10"7 cm/sec. The issues related to claycapping systems include the following:
• Higher permeabilities than synthetic liner; therefore, post-closure leachate genera*may be greater for a clay liner.
• A larger volume of truck traffic will be traveling over local roads to deliver clay to thesite.
• Susceptible to weather damage during construction and erosion following5 construction.
The geosynthetic capping system would utilize a flexible geomembrane as the hydraulic barrierlayer in the closure cap. Both polyvinyl chloride (PVC) and LLDPE liners were considered forthe flexible geomembrane. Both geomembranes satisfy the ROD and COMAR permeabilityrequirements and have similar relative cost; however, LLDPE has better friction characteristics,particularly on the side slopes of the landfill. Economic and slope stability comparisons betweenthe two geomembranes are presented in Appendix F. The benefits of implementing ageosynthetic closure capping system include the following:
3-6 AR0002I7
• Lower permeabilities than clay. The low permeabilities of the geosynthetics makeinfiltration more dependent on geomembrane defects and damage rather than onpermeability.
• Chemically inert material.
• Relative ease of quality control during installation.
• Less truck traffic required to mobilize materials to the site.
• Reduction in potential dust problems in hauling clay material for the hydraulic barrier.
A closure capping system utilizing a clay soil material for the hydraulic barrier layer is estimatedat $507,000. A closure capping system utilizing a 40-mil LLDPE geomembrane is estimated at$216,000. Based upon this comparative cost evaluation, a 40-mil LLDPE geomembrane wasselected for the hydraulic barrier layer of the closure cap. Both smooth and textured LLDPEgeomembrane materials will be implemented in the closure cap. Due to the steep side slopes onportions of the landfill, textured LLDPE liner will be specified to improve frictionalcharacteristics in areas having slopes of 5H:1V or steeper. The closure capping system costcomparison is presented in Appendix F.
Drainage Layer
A drainage layer will be placed over the geomembrane, consisting of a geosynthetic drainagemedia using geotextile filtering layers on each side of the geonet. Calculations supporting thesizing of the drainage layer are presented in Appendix F. These calculations take into accountfactors of safety for field loading and reduction factors for creep, biological clogging, andchemical clogging.
The drainage layer will carry precipitation infiltration off the cap. Precipitation infiltration willbe discharged to the daylighted drainage systems and will subsequently be released as sheet-flowfrom the landfill perimeter. Collected drainage will flow from the perimeter as described inSection 3.3.1.
3-7ftR0002l8
Anchor Trench
An anchor trench will be used for securing of the geosynthetic components at the top of theslope. The layers of each of the components of the geosynthetic cover system will be extendedover the edge of the anchor trench so as to line the side and bottom of the trench. The trench willbe backfilled with onsite soils and backfilled in lifts as specified in the Specifications. Aminimum 5-ft-wide flap of the geosynthetic components will extend from the upper slope, overthe anchor trench, and terminating downslope of the anchor trench location. This overlappingflap is used to prevent the introduction of infiltrated water carried by the drainage layer of theclosure cap into the anchor trench. The design procedure for an anchor trench typically includesa factor of safety (FS) of between 1.5 and 2.0, and is calculated based on a varying cover layerthickness and slope. The anchor trench configuration consists of a 3-ft-long runout section and a2-ft depth. This design considers both the horizontal and vertical forces that may be applied tothe closure cap system in order to resist liner pullout from the anchor trench. A detail of theanchor trench is provided on the Miscellaneous Details sheet in the drawings.
3.4.2 Soil Cover System
A 24-in. soil cover system (Figure 3-1) will be placed over the drainage layer. The soil coversystem will consist of 18 in. of common borrow soil and 6 in. of topsoil to prevent erosion of thecover system and reduce the potential for human or animal contact with the waste.
The topsoil layer will consist of a soil suitable for establishment of low-maintenance vegetation.The vegetation will be planted on the soil cap to stabilize the landfill cover system and reduceerosion. The proposed cover system incorporates a "habitat-friendly** vegetative layer by usingseed mixtures of appropriate plant types to create a diverse vegetative growth withoutjeopardizing the cap integrity. The vegetation will have a shallow root system so it does notthreaten the integrity of the geomerhbrane.
3.5 LANDFILL GAS MANAGEMENT
The BVL gas management system will be a passive venting system. However, the design alsoconsiders conversion of the system from passive to active in the event that site monitoringwarrants this change at a future date. Therefore, components of the system,'such as number ofvent wells, well design, and well placement, have been designed based on an active system. Thefollowing subsections summarize the components of the gas collection system.
3"8 AR0002I9
3.5.1 Passive Gas Venting System
Based upon the calculation of the maximum expected gas generation rate, and in accordance with40 CFR 60.752, an active landfill gas withdrawal system is not required. A passive gas ventingsystem has been designed for installation at BVL. However, the passive system has beendesigned so that modifications may be made in the future to facilitate active landfill gaswithdrawal. Figure 3-3 indicates the locations of the passive gas venting wells, gas monitoringprobes, and subsurface gas vents, along with the associated calculated radius of influence.
3.5.1.1 Well Field Design
The well field was designed in accordance with 40 CFR 60.755 to provide a system of verticalwells capable of controlling and extracting gas from the landfill sufficient to meet operationaland performance standards. The well field design at BVL was based upon estimates of the radiusof influence of each well based on the depth of waste, flow rate, unit weight of waste, and gasgeneration rate. The passive gas venting wells have been positioned along the ridgeline of thelandfill cap as shown on the Figure 3-3. A gas collection layer will be constructed directly belowthe geomembrane of the closure cap, and will serve to equilibriate the gas pressures below theclosure cap geomembrane. Gas collected within this layer will be transmitted to the passive gasvents positioned along the ridgeline of the cap and vented to the atmosphere, provided the gasvents meet emission limitations in accordance with the substantive standards of Marylandregulations governing air quality and toxic air pollutants.
The methodology employed in the design of the passive gas vents was taken from the SWAN A16th Annual Landfill Gas Symposium and is described as follows:
The gas generation rate is defined as:
where:GGR = Gas Generation Rate (cf/ton/year)Qt = Total Gas Emission Rate (from Landfill Gas Estimation Model) (cf7year)V = Volume of Waste (cy)X = Unit weight of waste (ton/cy)
RR000220
Once the GGR is determined the approximate radius of influence is determined using thefollowing:
D GGR Kwhere:
ROI = Radius of Influence (ft)Qw = Individual Extraction Well Flow Rate (cf/year)D = Depth of Waste (ft)GGR = Gas Generation Rate (cf/ton/year)X = Unit weight of waste (ton/cf)
The depth of waste was estimated from information presented in the RJ/FS, from historicalinformation, and from elevation contours detailed on the Drawings. The actual well depths areapproximately 75 percent of the depth of the waste in order to avoid installing wells into thewater table. The individual extraction well flow rate (12 cfrn) was initially estimated by dividingthe total gas emission rate (from the Landfill Gas Emission model) by the number of wells to beinstalled at the site (19 wells). The radius of influence (ROI) is then determined for each we!location based on the specific depth of waste at that location and a 12 cfin flow rate. Thecalculated ROI for each passive gas vent well is between 133 and 160 ft for depths of waste from46 feet to 30 feet. The calculated ROI for the subsurface gas vents is approximately 150 ft.Calculations detailing this well spacing procedure are included in Appendix I.
TJhe gas vent well design is based on the employment of an active landfill gas extraction systemand a relatively non-intrusive conversion to an active system. However, placement of the wellsnear the top of the landfill was selected in order to facilitate passive venting of landfill gas. Atotal of five passive gas vent wells will be used along the ridgeline of the closure cap to providefor release of landfill gas to the atmosphere. The use of the gas collection layer, whichequilibriates the gas pressure below the geomembrane and directs landfill gas towards theridgeline vents, eliminates the need for additional gas vent wells.
Table 3-2 presents a listing of each vent well, the ROI for that well, total depth of well, andassumed depth of waste.
3"10 AR00022I
QQ_ .-: tZ
t
O S— 2 *<7> O u! * .. £LJJ e "3 (>i ^Q uj ^ _, 3 d eco H ••<c ^ IO * <
to o yCO * =£
AR000222
TABLE 3-2 SUMMARY OF VENT WELL CONSTRUCTION
Well ID
GVW-1GVW-2GVW-3GVW-4GVW-5
ROI(ft)
139127117127155
Total WellDepth(ft)2530363020
AssumedDepth ofWaste*(ft)3540504030
* Depth of waste was approximated based on the difference between the surface elevation at thewell location and the elevation of the surrounding topography outside the limits of the landfill,plus additional historical information from the original landfill design drawings concerning theproposed depth of cells.
AR000223
3.5.1.2 Landfill Gas Monitoring Probes
A total of nine landfill gas monitoring probes will be installed along the southern and westernlandfill perimeter to monitor the migration of landfill gas. The gas monitoring probes willconsist of a 2-in.-diameter perforated pipe installed in a 12-in.-diameter borehole, within a gravel-pack. The probes will be installed down to the water table. A minimum 2-ft bentonite seal willbe installed above the gravel pack. A landfill gas field analyzer can be attached to a lab cock forsampling the gas. The proposed locations of the gas monitoring probes are shown on Figure 3-3.
3.5.1.3 Subsurface Gas Vents
The additional soil vapor analyses conducted in November 1998 revealed elevated concentrationsof methane in a sand layer beneath the southern and western perimeter of the landfill at a depth ofapproximately 17 ft below ground surface (bgs). A total of 14 subsurface gas vents will beinstalled along the southern and western edges of the landfill beneath the closure cap at the limitof waste. The subsurface gas vents will be 10 in.-diameter drilled boreholes, filled with porousgravel placed around a center perforated pipe. The pipe allows flexibility for inclusion into afuture active gas system if site conditions warrant. The subsurface gas vents will be installed to adepth of 20 ft bgs and will be spaced at 100-ft intervals. The vents will be tied in to the geonetgas transmission layer beneath the cap. Gas collected by the subsurface vents will be transmittedthrough the gas collection layer of the cap and will vent via the passive gas vents to theatmosphere, provided Maryland regulations regarding air quality and toxic air pollutants are met.
The 100-ft vent spacing interval (ROI of 50 ft) was selected for the subsurface gas vents. Sincethe landfill gas generation rate was calculated as 12 cfm, the graph in Appendix I indicates anROI of approximately 150 ft (for a depth of 20 ft). However, a more conservative estimate ofROI of 50 ft was used in order to ensure better capture of the landfill gas along southern andwestern boundaries.
3.5.2 Active Gas Withdrawal System
As identified in the ROD, if an active gas collection system is necessary at a future date, theproposed passive system shall be convertible into an active system. Among these modificationsand additions to the gas management system are the following:
• Installation of additional passive gas vents
AR00022U
• Installation of the main header and collection laterals• Installation of a gas control/destruction system• Modification of the vent wells to change from passive venting to active extraction
Detailed design of an active gas system will be conducted in the future, should existing landfillgas monitoring warrant a change from passive venting to active extraction. The discussionpresented herein is intended to portray only the concept of the potential future gas extractionsystem.
3.5.2.1 Vent Well Modification
In the event that the passive venting system is required to become an active extraction system,several modifications to the vent wells will be required. These modifications include:
• Installation of a valve above grade to eliminate gas flow through the top of the well• Installation of a sampling port• Connection of the lateral to the well via the T-fitting
Figure 3-4 indicates the new configuration of a typical vent well retrofitted for active gasextraction.
3.5.2.2 Conceptual Future Gas Collection Header Network
As part of a future upgrade and design, the gas collection headers and laterals should be sized toprovide negative pressure at the wellheads in accordance with 40 CFR 60.755 (a) (3). Headersizes will be iteratively assumed, utilizing the Hardy Cross Method to balance the flows in thegas collection header network and Bernoulli's equation to determine the pressures at each nodein the header pipe at each wellhead. The pressures at each node will be calculated consideringhead losses in the header and laterals and the performance of the selected blowers.
3.5.2.3 Gas Control System
Based on the results of the landfill gas migration evaluation and the calculations performed aspart of the landfill gas production evaluation (Appendix C), the gas extracted from the landfillwill not support the operation of a flare station. The concentrations of NMOC are below thethreshold limits of 50 Mg/yr, as presented in the New Source Performance Standards(40 CFR
AR000225
GOOSENECK
MNUM C* HBHx r SOLMOUW
ACTIVE GAS EXTRACT WELL DETAIMOTTO 8CH£
EA ENGINEERING.SCIENCE. ANDTECHNOLOGY
REMEDIAL DESIGN FORBUSH VALLEY LANDFUHMPOTO COUNTY.
FUTURE ACTIVEGAS EXTRACTIONWELL DETAIL
PTOJECTMGftPAP
DE9GHEDOT
BMORAtN BY
JBSCHECKED BIT
PAPSCALE
NTSDATt
6-4-99PROJECT W
61131.01FIGURE
3-4
flR000226
Part 60.752), and are appropriate for direct release to the atmosphere using a passive ventingsystem. However, in the unlikely event that these concentrations increase significantly (to >25tons/yr VOCs), the installation and operation of a flare station or other type of gascontrol/destruction system should be re-evaluated.
3.5.2.4 Condensate Management
Under an active gas extraction system, condensate will be managed by proper sloping of thecollection pipes back towards the wells. The main header and the laterals should have aminimum 1.0 percent slope toward the wells to prevent condensate accumulation in the pipes.Condensate will flow back towards the wells, into the perforated pipe, and back into the landfill.
3.5.3 Gas Monitoring Program
It is anticipated that routine sampling and recording of landfill gas generation will commencefollowing installation of the closure cap system, including twice-yearly sampling at gas dischargepoints and at the site boundary, and should include VOC analysis. A detailed monitoringprogram for the BVL site will be included as part of the Operation and Maintenance Plan to beincluded with the Pre-Final Design.
3.6 SLOPE STABILITY CONSIDERATIONS
As a result of the age of the landfill (site began operation as a landfill in 1974, and ceasedaccepting waste in 1982), most settlement due to waste decomposition is expected to havealready occurred. Landfill settlement due to the installation of the closure cap is not anticipatedto be significant. Design calculations analyzing the slope stability at the geomembrane liner andgeocomposite interface, as well as the overlying/underlying soil and geocomposite interfaces, arepresented in Appendix F.
Slope stability analyses were performed to specify suitable capping materials for the landfill.The analyses followed guidelines set forth in EPA's "Stability of Lined Slopes at Landfills andSurface Impoundments, August 1990." The following interfaces were analyzed to determine thefactor of safety based on their interface friction angles:
The interface friction angles used as part of the slope stability analyses are based on industrydata. A range of interface friction angles were provided based on historical data that uses thespecified materials in similar project applications. Each of the interfaces will be tested in thefield to verify their actual interface friction angles. The calculations and conclusions are shownin Appendix F.
3.7 GROUNDWATER MONITORING PROGRAM
The groundwater monitoring program will be initiated following the completion of the landfillcapping system. The groundwater monitoring program will include plans for sampling frequencysample locations, types of samples, and analytical parameters and will be prepared following acomprehensive review of data collected during the pre-design and previous RI activities. Reviewdata will include groundwater samples collected from four additional wells which were installedand sampled during April and May 1999. A description of the groundwater monitoring programfor the BVL site is presented in the Post-Construction Sampling and Analysis Plan, a separatedocument that is part of the Pre-Final Design Submission.
3.8 ECOLOGICAL MONITORING PROGRAM
The ecological monitoring program will be initiated following completion of the landfill cappingsystem. The details of the program will be determined following a comprehensive review of datacollected during the pre-design activities. A description of the ecological monitoring program forthe BVL site is included in the Post-Construction Sampling and Analysis Plan.
3'14 flR000228
3.9 FUTURE USE RESTRICTIONS
3.9.1 Deed Restrictions
Proposed deed restrictions and other institutional controls are described in the Bush ValleyLandfill Land Use, Access and Deed Restrictions Plan, submitted to EPA on 3 November 1997.EPA provided comments to this plan in a letter dated 11 November 1998. Harford Countyresponded in a letter dated 26 January 1999 regarding the recordation of the Consent Decree inthe County Land Records, and further responded in a letter dated 1 February 1999. The Countywill continue with the plan as submitted, pending further comment by the EPA.
3.10 SITE ACCESS CONTROL
Control and restrictions of access to the closed site will include warning signage and boundaryfencing. A perimeter fence will be constructed around the boundary of the site to restrict thepotential for direct contact exposure to landfill waste or landfill gas between possible trespassersand/or vehicular traffic. Specific information regarding the fencing can be found in theSpecifications and a detail is shown in the drawings. Warning signage, including "NoTrespassing" signs, will be located along the perimeter fence. The integrity of these site accesscontrols will be inspected as part of the Operation and Maintenance Plan.
Pursuant to 40 CFR 300.400(e), "No federal, state, or local permits are required for onsiteresponse actions conducted pursuant to CERCLA Sections 104, 106, 120, 121, or 122." Onsiteactivities for which permits are not required include the landfill cap construction, landfill closure,stormwater runoff, construction near wetlands (tidal and nontidal), landfill gas vent emissions,temporary construction easements, erosion and sediment control, and well construction andabandonment. However, the Bush Valley Landfill will meet the substantive requirements ofpermit equivalencies for these activities.
A summary of the required and substantive permits for the Bush Valley Landfill Closure Cap ispresented as follows:
GovernmentApproval/Permit
Closure Cap System
Stormwater Management
Erosion and Sediment Control
Approving Agency
Maryland Department of theEnvironment
Harford County Departmentof Public Works
Harford County SoilConservation District
Comments
Agency review and approvalin conformance with COMARand RCRA landfill closurerequirements. No formalpermit document required.MDE will issue an approvalletter of the closure design andcontingent upon localjurisdiction approval (HarfordCounty SCD) of the erosionand sediment control plan.
A waiver from stormwatermanagement requirements hasbeen requested based upon anet reduction in the estimatedstormwater runoff fromexisting conditions at the timeof landfilling to proposedconditions after site closure.
Local approval of erosion andsediment controls requiredprior to interaction ofconstruction activities.
RR000230
5. PROJECT SCHEDULE
The remedial design is scheduled to receive final approval from EPA in December 1999.The remedial construction is planned to occur during the year 2000 construction season. Aproposed preliminary construction schedule for accomplishing the work is shown inFigure 5-1.
5-1AR00023I
•tfl
£
UJ
DDUJx :oV> zZot— _J /-I
MINARY CONSTRl
3H VALLEY LANDF
RFORD COUNTY,
Month]
UJ CO Xoc0.
« ;UJ *o:
;
-
1
1
«f~3
i
$n5
i
;
t
i
!
1 0
„
i
i
MoMzatoSrte
y
Eraton and Sedwiwrt Control
—
Cto«r«ndGnib
Io
Prow* Bo
rrow
Prt
Ta
il
1I
i
i
n
UiJ
1
n
iji
m
i
i
(
j
5 i! i
:: y
c
J;
-IrvniTopMi
1
u.
I
R
kvM GH
Monitoring Pr
obe*
1-Q
>
^
iAR00023;!
Appendix A
Boring Logs, Well Constructionand Groundwater Monitoring Records
k^m<g> EA Engineering,^ k Science, andfl A Technology, Inc.
LOG OF SOL BORING»:evition:ove Surface:FlevBtion-D«criDtJon:
Recvrdm.
i"{
7f''Is* ——
•JU*t-1
11"
(X
Samp*Depth
5"11<i9nn/(>57?7
M(581
CGI%LEL
O
PID(ppm)
IP
0.5
O.o
0.0
DepthInFeet
0
1
2
3
4
S
6
7
8
9
10
USCSLog
hL
//
///
CL
Job. No. Client Harford County Location:nisi.* am Department of Public Works Bush Valley L.F.drifting Method: Boring No.ghSB-2.Sampfina Method: 2 In ID splK spoon sampler
Shelbytube Sheet 1 of 2Drilling
Water Lev. Start FinishTme /^vr /*fZ.Oate 1 septsa i s.|rtQflRtffHWf uv
0-2. / CC . H/i y^V. JV?^</v J> 7
T if * c/w yC K
2-V J 'n<_fir Q-l. '
i
V-C/ JVs-n*? ?J" 2-V , £xf-
/ *>
Skelbf l?c-50M <-
>/0-'<9 fceft ±o If-fcy.w/jt. C/a/ T///V C V———— <— ——— y ———— - ———— —— / 7 ——— ^ ——— T —
M f//td? ,A*o»sf-
n««: 1 September 199BLogged by. Steve WeteantDrilling Contractor E2SI——————————————.——
AR000239
Engineering, Harford County*Science, andTechnology, Inc.
Department of Public Works
LOG OF SOIL BORING .2 In ID soft spoon samplerampling Method
Harlord County Location:Department of Public Works Bush Valley L FPick-up truck mounted Geoprobe Borina No.direct push technology EASB-7
Sampling Method: 4 ft PETG liner. 2 in IDsoil oas • collected usina 1/4 In polyethylene tubina through Sheet 1 of 2rods and attached to vacuum pump. Extracted with 60cc syringe DrillingWater Lev.TimeDateReferenceSurface Conditions:
Start Finish830 1015
11/05/96 11/05/98
arass; 1 36 ft east of comer of fence (down access road)on south side of access road
0-4- Moderate to light brown, dry, mottled clayey SILT, trace fine sand, firm.
Job. No. Client: Harlord County61131.01 Department of Public WorksDrilling Method: Pickup truck mounted Geoprobe
Sampling Method: 4 n PETG liner. 2 In IDsofl oas - collected ustna 1/4 In porvethvtene tubing throuahrods and attached to vacuum Dump. Extracted with 60cc svrinoeWater Lev.TimeDateReferenceSurface Conditions: see sheet 1 of 1
Location:Bush ayBoring No.EASB-8
Sheet 2 of:Drilllna
Start Rt,1030
11/05/98 <
*
f.20-22- Same as 16-20
*22-23- Moderate brown, wet. fine SAND, some silt t
23-24- Dark brown, moist CLAY, firm
24-26- Moderate brown, wet, sandy SILT, trace gravel ^Increase In medium to tine SAND near bottom
J.
-
-26-32- Light brown, wet. fine SAND ;»
y
*f
BOHO32H ft.
— Ir————————————————————————— i
L'
Logged by: Steve Welant . ______ Date: Nov. S. 1996
Drilling Contractor Taroet Environmental_______ Drtlen Jeff Green
Was a temporary groundwater sampling point instated? No If yes, give construction details
Job. No. Client: Hartord County Location:61131.01/2002 Department of Public Works Bush Valley LandfillDrilling Method: Pick-up truck mounted Borina No.Geoprobe EASB-JSampling Method: 4 ft PETG liner, 2 in ID -*soil gas: collected using 1/4 in polyethylene Sheet 2 of 2tubing to pump; extracted with 60 cc syrinqe DrillingWater Level Start FinishTime 1145 1330Date 11/05/98 11/05/98 11/05/98ReferenceSurface Conditions: grass
20-22- crushed grave); rocks
22-24 Light brown, moist, nVc SAND, little silt and gravel,some white-gray sand
24-28 same as 22-24
28-32 same as 24-28; increase in light grayish brown fine SAND
32-35 same as 28-32
35-38 same as 32-35; becoming saturated O 35'
BOH O 36 ft
Logged by: - ~- Steve Welzant -••'-.--_____'____ Date: 11/05/96
Drilling Contractor Target Environmental__________ Driller Jeff Green
AR000250 fj
EA Engineering, Science,and Technology, Inc.
LOG OF SOIL BORINGCoordinates:Surface Elevation:Casing Above SunReference Elevation;Reference Desc:
SampleType
PETGliner
PETGliner
PETGliner
PETGliner
PETGliner
InchesDrvn/lnRecvrd48/48
48/48
48/48
48/46
48/28
Dpth.Csg.
0-4
4
8
12
16
SamplNo.
1
2
3
-
4
5
PIDppm
0.2
21
10.3
0.7
0.8
0.2
0.5
0.2
13.1
0.5
0.7
0.2
3.3
2.3
Blowsper6 in.
Depthin
Feet0
1
;ii
(
i
(
9
K
11
1;1;V
15
ie17
18
19
2C
USCSLog
OL
ML
SPSMSM
CL
CL
CL
SP
SP
Job. No. Client: Harford County61131.01/2002 Department of Public WorksDrilling Method: Pick-up truck mountedGeoprobeSampling Method: 4 ft PETG liner, 2 in IDsoil gas: collected using 1/4 in polyethylene
Location:Bush Valley LandfillBoring No.
EASB-1 0
Sheet 1 of 2tubing to pump; extracted with 60 cc syringe DrillingWater LevelTimeDate 11/05/98ReferenceSurface Conditions: grass
Start Finish1345 1530
11/05/98 11/05/98
0-1 organics; top soil
2-3 Moderate brown, moist, SILT, some gravel and fine sand
3-3.5 coarse SAND layer3.5-4 Moderate brown, moist, fine SAND, little silt, firm4-7 same as 3.5-4
7-8 Moderate brown, mottled, firm CLAY, little sitt
8-12 same as 7-8
12-14.5 same as 8-1 2
14.5-16 M/c SAND, moist, little gravel
16-20 same as 14.5*16
Logged by: Steve Welzant____________ Date: 11/05/98
Drilling Contractor: Target Environmental_________ Driller. Jeff Green
Job. No. Client: Harford County Location:61131.01 Department of Public Works Bush VallevDrilling Method: Pickup truck mounted Geoprobe Boring r-'
EASB-1,.Sampling Method: 4 ft PETG Hner. 2 in IDsoHoas- coHeded usino 1/4 in porvethvlene tubino through Sheet 2 ofrods and attached to vacuum pump. Extracted with 60cc svrinae DrilllnqWater Lev. Start Fir/Time 1345Date 11/Q5/9B -.ReferenceSurface Conditions: see sheet 1 of 1 c
20-24- Moderate brown, moist meoSum to fine SAND, little gravelaettinc wet O bottom ?
-
f*
24-26- Same as 20-24; becoming wet/saturated
-26-28- Gray, moist-wet sandy CLAY, firm
'
26-30- Same as 26-28; color changing to moderate brawn „
*
No sample »
*
32-36- Light brownish-gray, wet fine SAND, Nttte sRt loose f
1.
FBOH O 36 ft . f
H ,
ll
Logged by: Steve Wetzant Date: Nov. S. 1998
DrfBing Contrador Tarott Envtronmental _______ Driller. Jeff Green
Wasatempwan/grouTKhrttersamollnQporrrtinstaled? No lives, give construction details
AR000252
EA Engineering, Science,and Technology, Inc.
LOG OF SOIL BORINGCoordinates:Surface Elevation:Casing Above SunReference Elevation:Reference Desc:
SampleType
PETGliner
PETGliner
PETGliner
PETGliner
PETGliner
InchesDrvn/lnRecvrd48/48
48/46
48/48
48/46
48/30
Dpth.Csg.
0-4
4
6
12
16
SamplNo.
1
2
3
4
5
PIDppm
0.2
2
1.2
0.3
0.1
0
O.B
9.6
0.1
9.5
3.4
5.4
2.6
B.3
22.3
Blowsper6 in.
Depthin
Feet0
1
t
*
i
5
e7
f
c
K
11
1!
1;14
1£
1C
17
18
19
2C
USCSLog
Job. No. Ghent: Hartord County51131.01/2002 Department of Public WorksDrilling Method: Pick-up truck mountedGeoprobeSampling Method: 4 n PETG liner, 2 in IDsoil gas: collected using 1/4 in polyethylenetubing to pump; extracted with 60 cc syringeWater LevelTimeDate 1 1/06/98ReferenceSurface Conditions: grass
Location:Bush Valley LandfillBoring No.
EASB-1 1
Sheet 1 of 2Drilling
Start Finish800 1000
11/06/98 11/06/98
0-1 Moderate brown, dry, SILT, little gravel
1-1.5 crushed rock fragments1 .5-4 Moderate brown, dry, sandy SILT, little gravel, trace clay
4-8 Moderate to light brown, moist, silty CLAY, little sand lensesfirm
l> EA Engineering,^ Science, and| Technology, Inc.
LOG OF SOIL BORING
a:
i:
SampleDepth
20-24 .
24-28
26-32
32-36
PID(ppm)
1.5
0.8
0.2
1.8
1.2
DepthIn
Feet20
22
24
26
26
30
32
34
36
38
40
USCSLog
CL
CL
ML
SM
Job. No. Client: Harford County61 131.01 Department of Public WorksDrilling Method: Pickup truck mounted Geoprobe
Sampling Method: 4 ft PETG liner, 2 in IDsoH oas • collected usina 1/4 In polyethylene tubtna throughrods and attached to vacuum pump. Extracted with 60cc svrinoeWater Lev.TimeDateReferenceSurface Conditions: see sheet 1 of 1
29-30- Light brown, moist, fine sandy SILT, trace dayHner broke O 30. In 2 pieces
*
t30-32- Same as 29-30; increase in fine sand *S
132-36- Light brownish-gray, wet, fine to medium SAND j
.
*
rBOH e 36ft i
*"
—— LLogged by: Steve Weteant ______ Date: Nov. 6.1998
Drwmg Contractor Target Environment*_______ Driller Jeff Green
Was a temporary groundwater sampHng point Installed? No____ H yes, give construction details
^ • •••' flR00025l»
Earth Borin9Page 1 of 2
PROJECT: Bush Valley Landfill BORING No: EASB-1Harford County, Maryland
PROJECT No. : 98-162
ELEV DATE START: 9/1/98 FINISH: 9/1/98HAMMER: 140 Lbs HAMMER DROP; 30 In. SPOON O.D. : 2 In. FOREMAN : D. FinchamBORING METHOD : HSA ROCK CORE DIA :———— , — _ ——————————————————— I ——————————————————————————————————————————ELEV DESCRIPTION DEPTH
Brown-Gray moist Silty CLAY,trace fine Sand
iiii
• ' 10.0
SCALE
0"™
~
5^
_
10 "
; Brown moist Silty fine-mediumSAND, some gray silty clay
12.01
Brown dry Silty fine-coarseSAND, some Rock Fragments
I1
I |
1
; 20.01 ;
15_I
.
—20
No. Blows / 6 in
S-1 4 - 6 - 6 - 8
S-2 5 - 8 - 8-10
S-3
S-4
S-5
S-6
4 - 7 - 7 - 8
PUSHED TUBE
3 - 4 - 4 - 5
3 - 2 - 3 - 7
S-7 7 - 7-10-13
S-8
S-9
S-1C
23 - 20 - 24 - 36
24 - 30 - 39 - 25
19-30 -50/5"
TYPE REC NOTES
,4- Stonei
DS 16"
OS
DS
PT
DS
24' '
24" •
24"
i No Groundwater24" t Encounteredi
DS 24"
DS
DS
DS
DS
15" !
i —— i i12- !
10"
0
LEGEND GROUNDWATERns DRIVEN SPOON WATER ON RODS ; NONE .,,..."ST SHWTUK AT COMPLETION : Dry CAVED^ISJ fe«t
IPS PISTON SAMPLE AT Hours „..-.-'RC ROCK CORE WATER : CAVED:HSA HOLLOW STEM AUGER
IDC DRIVEN CASINGMO MUDDRILUN3-C-, ARQ00255
/ _ /iIsE_j f"£Z7 EJ Earthpci* bigg's Engineera aVJaVB B 6 ScienceSn, Boring Log
Page 2 of 2
i PROJECT: Bush Valley Landfill BORING No • EASB-1: Harford County, Maryland
— i! ELEV :
PROJECT No. : 98-162
DATE START: 9/1/98 FINISH: 9/1/98HAMMER: 140 Lbs HAMMER DROP : 30 In. SPOON O~D.':~2 In FOREMAN- n Pinrh-! BORING METHOD: HSA ROCK CORE DIA: ruHbMAN . D. Finch;
; ELEV. i! I
I
'
I
I
I
j
I
• i: ;
j
I-ii
ii-
iii
ii it i
DESCRIPTION
Brown moist Clayeyfine-coarse SAND, somerock fragments
Red-Gray moist Sitty CLAY
bottom 01 boring ai 24.u leet
DEPTr• SCALE NO. Blows / 6 ini-- rzg —— ——————
TYPE
J iJS-1
1 ——REC
10 - 8- 11 - 131 DS 16"22.0 1 • ' i "1 J ———
24.0TS-1S
25 —
i —i ——1 ———
i ——] __
5 - 7 - 9-16
li
Ii
! 30-3 i
DS 20'
; ~] ! :
NOTES
——————— —— #
iii
Us«d 1 Drum forcuttings and 6 -baps of bentonchps for backfL
,i 1 i i
!
1i
1
H] • i— 1 - i i j,
ii
i
— — —
35 —
40 — i ii ii
!i
1
ii
i-
*•'
LEGEND GROUND WATER flDS DRIVEN SPOON . .WATER ON RODS : NONE U.ST *HBJfllJK .;,.' ': AT COMPLETION : Dry CAVED: 15.7 totPS WSTbriSAftptE * AT Hours *RC noCKCORE_ WATER: CAVED:HSA HOLLOW STBd AUGERDC DRIVEN CASINGMD . MUD DRILLING
~;- :Ta AR000256
f Engineering BONnO LOQ& Sciences. Inc. » ^
Page 1 of 2
PROJECT: Bush Valley Landfill BORING No.: EASB-1A -Harford County, Maryland
PROJECT No. ; 98-162
ELEV DATE START: 9/2/98 FINISH: 9/2/98HAMMER: 140 Lbs HAMMER DROP: 30 In. SPOON O.D.: 2 In. FOREMAN : D. FinchamBORING METHOD : HSA ROCK CORE DIA :
ELEV DESCRIPTION
Brown moist fine- mediumSAND and Clayey SILT
Brown moist Silty CLAY,trace Sand
Brown moist Silty CLAYi
i;1i
—————————————————Brown-Gray moist ClayeySILT, little sand and TOOKfragments
LEGEND GROUND WATEROS DRIVEN SPOON WATER ON RODS: NONEST SHELBYTUBE AT COMPLETION: Dry CAVED: 17.6 feet
[- PS PISTON SAMPLE AT HoursRC ROCK CORE WATER : CAVED;HSA HOLLOW STEM AUGER
I DC DRIVEN CASINO
MD "—*.' HR000257
C3 Earth1 Engineering6 Sciences. Inc.
Page 2 of 2
PROJECT: Bush Valley Landfill BORING No - EASB-1 AHarford County, Maryland
PROJECT No. : 98-162
,ELEV: DATE START: 9/2/96 FINISH: 9/2/98i HAMMER: 140 Lbs HAMMER DROP: 30 In. SPOON O.D.: 2 In FOREMAN- n Fi! BORING METHOD: HSA ROCK CORE DIA: ruHbMAN. D. Fi
ELEV.I
DESCRIPTION
Gray-Brown dry fine-coarse! SAND and rock fragments
Gray moist fine-coarseSAND
bonom OT boring ai 24.u ieet
-
DEPTH
j ————
22.0
24.0
I SCALEt NO. i Blows/ 6 in1 i20 i
Js-9 10 - 20 - 21 - 19
Js-io1
25 — I
—
30 —
9 - 10 - 10 - 6
ii !
1 ———TYPE REC
OR
DS
1fi"
18"
i[
!! NOTES t
'- ——— ———————————— $
Encountered „Groundwater®24*
Used 1 drum f<auger cu** gT7 bags 1 3 »chips for Ddclc
B
I
9
i
35
40
LEGEND i .;\ . GROUNDWATERDS OWV6N8POON •'/ : WATER ON RODS: NONEST SHELBYTUBE AT COMPLETION: Dry CAVED' 176 feetPS P1STONSAMPLE AT Hours ^«vcu. W.O TOOlRC HOCK CORE WATER :HSA HOLLOW STEM AUGERDC DROfEpCASING „MD MOD DRILLING ' >,
£2 EarthEngineerim;& Sciences. Inc.
Page 1 of 2
PROJECT : Bush Valley Landfill BORING No.: EASB-2Harford County, Maryland
PROJECT No. : 98-162 j
ELEV DATE START: 9/1/98 FINISH: 9/1/98HAMMER: 140 Lbs HAMMER DROP : 30 In. SPOON O.D. : 2 In. FOREMAN : D. FinchamBORING METHOD : HSA ROCK CORE DIA :
! Brown-Gray wet fine-coarse Ii SAND, some rock fragments ': and black peat
15
S-7
S-8
20
3 - 5 - 6 - 6
4 _ 6 - 4 - 5
DS
DS
S-g 4- 4- 6- 6 DS|24
S-ld 2- 4-13-17 DS 24'
1 Encountered24" 1 Groundwater
13'
24"
LEGEND GROUND WATERDS DRIVEN SPOON WATER ON RODS : NONE
1 S SS5KS5* ATCT*Tlo ours17'6teet CAVED: 18-°RC ROCK CORE WATER : CAVED:HSA HOLLOW STEM AUGER
I DC DRIVEN CASINGI MO MUD DRILLING - ft ROD 0259
_ Earth1 Engineering BONnO LOO• B Sciences. Inc
Page 2 of 2
PROJECT : Bush Valley Landfill BORING No.: EASB-2' . Harford County, Maryland
PROJECT No. : 98-162
JELEV: DATE START: 9/1/98 FINISH: 9/1/98! HAMMER: 140 Lbs HAMMER DROP: 30 In. SPOON O.D.: 2 In. FOREMAN- D Fincrul BORING METHOD : HSA ROCK CORE DIA :
ELEV.
;
iiIii
DESCRIPTION
Tan-Gray dry fine-coarseSAND and rock fragments
-
bottom OT boring at Z4.u leei
iiii
PflPNO
DEPTHi
24.0
,i
ji
i
SCALE
20
__^_
25 ~
——
30 ~"—
35 —
40 ~~
NO.
S-11
S-12
4
————————————————————————
Blows / 6 in
6-15-16-22
5 - 8 - 1 1 - 1 1
GROUND WATFR
TYPE
DS
DS
REC
20"
15"
NOTESn
*
Used 1 drum f*auger cuttings8 bags bentorii.chips for backfi;
K
V
*
»
L
FLf
i-i
——— nu••SRC ROCK CORE WATER : CAVEDHSA HOLLOW STEM AUGER v,«vcwDC DRIVEN CA81N3 - ,MD ^OooRiLUNa;/'. flROO.0260
EarthEngineering& Sciences. Inc.
Page 1 of 2
! PROJECT : Bush Valley Landfill BORING No.: EASB-3' . Harford County, Maryland
PROJECT No. : 98-162
'ELEV DATE START: 9/2 8 FINISH: 9/2/93: HAMMER: 140 Lbs HAMMER DROP : 30 In. SPOON O.D. : 2 In. FOREMAN : D Fincham: BORING METHOD: HSA ROCK CORE DIA:ii ——— —————————————————JELEV DESCRIPTIONi
iBrown moist sitty CLAY
i
i!Gray moist Clayey SILT,trace fine Sandi!. Gray moist fine Sandy SILT
• Gray wet Clayey fine SANDi
i Gray moist silty fine-mediumSAND
i Gray dry fine-coarse SAND!t
|ii
DEPTH
8.0
10.0
12.0
14.0
16.0
20.0
SCALE No.
~o —
!:•
±5____I
________
10 ~
S-2
S-3
S-4
S-5
S-6
8-7Jr|S-8-I S~9
" S-1G20 ~ ~— — — __ _ _
Blows / 6 in
,1 - 7-11-10
7 - 1 1 - 1 2 - 1 3
6 - 7-10-10
PUSHED TUBE
4 - 8 - 9 - 9
4 - 6-10-12
5 - 5 - 5 - 6
2 - 3 - 3 - 5
4 - 9-12-13
6 - 7-11-19
TYPE
DS
DS
DS
PT
DS
DS
DS
DS
DS
DS
REC
16"
20"
24'
24"
20"
24"
24"
24"
18"
15"
NOTES
•
LEGEND GROUND WATERns DRIVEN SPOON WATER ON RODS: NONE „„_ ^ 0 ,S? SHELBYTUBE AT COMPLETION: Dry CAVED: 20.8 feetPS PISTON SAMPLE AT Hours CAVED'RC ROCK CORE WATER : WWtU.HSA HOLLOW STEM AUGERDC DRIVEN CASINGMD MUOOnilJNG - AR00026I
1LJ EarthnginSciences. Inc.
Page 2 of 2
Boring Loo
PROJECT : Bush Valley Landfill BORING No.: EASB-3Harford County, Maryland
PROJECT No. : 98-162
ELEV: DATE START: 9/2/98 FINISH: 9/2/98 fHAMMER: 140 Lbs HAMMER DROP: 30 In. SPOON O.D.: 2 In. FOREMAN: D Find,BORING METHOD : HSA ROCK CORE DIA:
!ELEV.
!
IiiIi
i
!
,_
i|
DESCRIPTION
Tan dry fine-coarse SAND,some Rock Fragments
Brown wet fine-coarseSAND and black clayey Sift(peat)
bottom or boring ai zo.u leet
DEPTH
22.0
26.0
SCALE
20
-—
25 ~
30 ~~
35 ""
40 ~"
NO.
S-11
S-12
S-13
Blows / 6 in
14 - 25 - 27 - 33
25 - 26 - 21 - 13
5 - 9 - 5 - 5
TYPE
DS
DS
DS
r ——REC
15"
14"
24"
NOTESe•a.
Encountered -Groundwater@23'
-Used 1 drum ftauger cu**!-gi6 bags t achips for Dackt
^*9
'i.
r
i
rfLEGEND GROUNDWATER *~
DS ORtVENBPOON ; WATER ON RODS: NONEST SHELBYTUBE AT COMPLETION: Dry CAVED: 20.6 feat nPS PISTON SAMPLE AT HoursRC ROCK CORE WATER : CAVED:HSA HOLLOW STEM AUGERDC • DRIVEN CASINOMO
where:A - hydraulic conductivity, cm/*,« « c/t area of reaervoir of permeate, cm'L * length of apecimum, cmA - craaa-aectional area of apecimum, cm7T - elapted time between det. ol h, & h,, secA! a upper head burette reading at tima T,, cc/)j » upper head burette reading at time Ty, ccht - lower head burette reading at time T,. cc/ik - lower head burette reading at time T,, ccp, « p, x 70.55, cmp, - P. x 70.55. cm
AR00026S
-
e
e"
100
90
80
70o:UJ
H 60u.z 50uuUJ 40a
30
20
10
02C
Test1
GRAIN SIZE DISTRIBUTION TEST REPORTc
c c e• CM • — — —
C C C -v C O O— — r- — » (M « O O O O •* O
«•»•», • ••*••^""*"*"•
)0 100 10.0 1.0 0.1 0.01GRAIN SIZE - mm
% +3"0 0
LL. 31•*.
% GRAVEL0.2
% SAND6.3
% SILT
t
.
fy
r
^
0
% CLASi93.5
, . , _ , —— . ———— t
PI13
DBS °60 °50 °30, , , , , . *
MATERIAL DESCRIPTION•Brown S Ity CLAY.troce f -m Sond. Grave
Project No. : 98-162Project: Bush Vo 1 ey Londfil• Loco t ion: EAS8-1 . Somp I e-4 . Depth: 6. '-8.0'
Dote: 09-21-98GRAIN SIZE DISTRIBUTION TEST REPORT
; EARTH ENGINEERING * SCIENCES. INC.
DIO
uscsCL
Remark
Moi stu
Labora
F gure
cc 1
IiAASHTO
A- 6 t
T5 :
re Content :
lory Number :
No.
20 2X
n
Project* 98-162Lab* EA162-1A
MEASUREMENT OF HYDRAULIC CONDUCTIVITY OFSATURATED POROUS MATERIALS USING A FLEXIBLE WALL
PERMEAMETER <ASTM D 5084)Project: Bush Valley Landfill
ample Type: Brown Silty CLAY.Iittle fine Sand Tested By: Ranjan PatelSample ID: EASB-1A. Sample-2. Depth : S.O'-B.O' Test Liquid: Distilled De-Aired Water
Test Date: B-Sep-98Test Sample Length « L «= 7.112cm Wet Weight Before Test: 473.1 gms
Test Sample Dia. = D •= 7.112 cm Wet Weight After Test: 478.0 gmsCross Section Area = A • 39.73 cm2 Dry Weight After Test: 388.15 gmsArea of Stindptpe • a • 0.98 cm? Dry Density: 85.7 per*
Cell Pressure«P« 5.0 psi Compaction: NA %Lower Cap Pressure - Pi = 3.0 psi % Moisture: 21.9 %Upper CvpPressure - P.* 2.0 ps/ Gradient: 0.14 psi/cm
* VS T *• - I* x L ViA K T} x Ln1 DIE-OSBMMil——————————— __..... ————————————————————, ^^
B. IDE-OS * - hydraulic conductivity, cm/a,710E-06
__ * « c/a area of reaervoir of permeate, cm*610E-06 —————————————————- - - - ——
a 310E-06210E-061 10E-06100E-07
f 510E-06S ..__-. _____________________________________ A - cro«K-s«ctional ir«a of «p«cimum, cm7c « "OE-Oo ————"—"—^—•——"— —————^^————————————————.—
Tintt (LOO H S«condt) . __ __p. - P. x 70.55, cm
L » length of apecimum. cm
T * elapsed time between del. of h, & h,, sec/), - upper head burette reading at time T,, ccAj - upper head burette reading at time T?, cch, - lower head burette reading at time T,, cc/)fc - lower head burette reading at time T,. ccp, - P, x 70.55, cm
AR000267
•
•
«;
100
90
80
70o:UJ
H 60U.
550UJUS 40CL
30
20
10
02C
Test19
GRAIN SIZEc~ -- c .5
e c e ' x. c 7 "" '~— «- - * <N »e n N <!••*) *- n
where:ft •• hydraulic conductivity, cm/a,j - c/a araa of reaarvotr of permeate, cm2L « length of specimum, cmA m crosa-cectional araa of cpacimum. cm7T - elapaed time between det. of h, & h,, sec/>i - upper head burette reading at time T,, cc/>j - upper head burette reading at time T,, ccht - lower head burette reading at time T,. cc/>b - lower head burette reading at time T7. ccPi • P, x 70.55, cmp. - P, x 70.55, cm
frRGG0269
e
e-
100
90
80
70uH 60L.
z 50LJ(J
5 4Oa.
30
20
10
02C
Test18
GRAIN SIZE DISTRIBUTION TEST REPORTc
c c cc c c x ' c ~ oo
• - . - - » PW « O O OO •» O
)0
•
k ! N«i•*— ,,i
• »- •• i -
:
?
'-i.
9
1OO 10. 0 1.O 0.1 0.01 UGRAIN SIZE - mm 8
f% +3"0.0
LL
31
% GRAVEL0.0
% SAND4.5
PI1 1
D85 Deo DSO °30
% SILT % cJ95.5
- — ' 1i
MATERIAL DESCRIPTIONBrown S t ty CLAY. trace fine to medium Sand
Project No. : 98-162Project: Bush Va ey Landfi• Loca t i on : EASB-2 . Samp 1 e-4 . Dep t h : 6 . 0 ' -8 . 0 '
Dote: 09-21-98GRAIN SIZE DISTRIBUTION TEST REPORT
EARTH ENGINEERING Jc SCIENCES. INC.
D10
USCS
CL
cc Ir&
AASHTO
A-6
Remarks :
Moisture Content:
Laboratory Number :
F i gure No .
k.
18 6:rL
r;
Project # 98-162Lab# 98162-3
MEASUREMENT OF HYDRAULIC CONDUCTIVITY OFSATURATED POROUS MATERIALS USING A FLEXIBLE WALL
PERMEAMETER (ASTM D 5084)Project: Bush Valley Landfill
Sample Type: Brown Silty CLAY,trace f-m Sand Tested By: Ranjan PatelSample ID: EASB-3. Sample-4. Depth : 6.0'-8.0' Test Liquid: Distilled De-Aired Water
Test Date: 15-Sep-98
Test Sample Length = L = 5.969 cm Wet Weight Before Test: 490.1 gmsTest Sample Dia. * D = 7.112 cm Wet Weight After Test: 494.1 gms
Cross Section Area « A = 39.73 cm3 Dry Weight After Test: 405.6 gmsArea of Standpipe = a = 0.98 cm? Dry Density: 106.6 pcf
k vsT1.01E-091ioe-06 ————————————————=———-——- where:
k » hydraulic conductivity, emit.
i
7 10E-06610E-06 ______..^______- -_-. * - c/s area of reservoir of permeate, cm5 IDE-08410E-06
t 3 ioE-06 1 i -J- _ e|apied time between der. of h, & h^, tec^TOE-oe L ._ _,._ _,. ._________ _______ /t} « upper heed burette reading at time T,, cc1 IOe-06 —————————————————————————————————————————100E-07
Time (LOG M Stconfli)
I* x L }/(A x H x Ln
L - length of epecimum, cmA - crose-eectional araa of ipecimum. cm'
ft, m upper head burette reading at time T2, ccht - lower heed burette reading et time T,, cc/ib • lower head burette reeding at time T2, ccp, - P, x 70.55, cmp. - P, x 7O.55. cm
AR00027I
-
•
•
100
90
80
70oruH 60U
550uu£ 40a
30
20
10
02C
Test17
GRAIN SIZEc
c c cc c c Cl e J - '-- — _ . - * « « >,0 m n J . ^ S ' i ' r t
)O 100
% +3"0 0
LL32
C).
*
r•
S"
mm
FRIo•t•MMM 1
B
3N*1 «
L
5
rc•^
TION TEST
s I I«. *i « ^*•* * ^ L :
•
REI
• -
<3Fnr
*
'
t
r
*
^
*
a
10. 0 1.0 0.1 0.01 0GRAIN SIZE - mm f
% GRAVEL0.0
PI10
% SAND6.9
% SILT % CLA-i93. 1 v
i
D85 D60 °50 D301
Dl5
MATERIAL DESCRIPTION•Brown S Ity CLAY. trace fine to medium Sand
Project No. : 98-162Project: Bush Vo 1 ey Londfi• Location: EASB-3, Somple-4. Depth : 6.0'-8.0'
Dote: 09-21-98GRAIN SIZE DISTRIBUTION TEST REPORT
; rCARTM cENGINCERXNC * SCIENCES. INC.
DIO
USCSCL
cc i
AASHTOA-4 fc
Remorks :
Moisture Content: 20 . 8|1
Loborotory Number ; *•
HF.QIJT^ NO. jv
Appendix A2
Monitoring Well Boring Logs(EA10-13)
AR000273
EftCoordinates:Surface ElevatCasing AboveReference ElevReference Des
SampleType
SS
SS
SS
SS
SS
SS
SS
SS
SS
InchesDrvn/lnRecvrd
24/19
24/21
24/24
24/18
24/18
24/20
24/18
24/20
24/24
EAan
on:3ur:ation:c:
DpthCsg.
0
2
4
6
8
10
12
14
16
Engineering, Science,d Technology, Inc.
LOG OF SOIL BORING
CGI(% LEL)
0
0
0
0
0
0
0
•
0
0
PID(ppm)
0
0
0
0
0
0
0
0
0
Blowsper6 in.
1113344422354111492443134689981311121212141415
Depthin
Feet
0
1
2
3
4
5
6
7
8
9
10
11
12
13
14
15
16
17
18
19
20
USCSLog
ML
SM
SM
CL
SM
SM
SM
GM
Job. No. Client: Location:61 13101/2007 Harford County DPW Bush Valley LFDrilling Method: Hollow Stem Auqer Boring No
EA10Sampling Method: StandardPenetration Test (SPT); 140 Ib hammer Sheet 1 of 2freely falling 30 in; 2 in OD split-spoon DrillingWater Leve 10'4" 82* StartTime 1430 1535 1210Date 04/13/99 04/13/99 04/13/99Reference grade grade
Finish1530
04/13/99
Surface Conditions: Dirt covered area between Bush Roadand Bynum Run. Sunny and Breezy.
Brown, moist clayey SILT and m/f SAND, trace orqanics
Brown, moist m/f SAND and clayey SILT
Light gray and brown, moist c/f SAND, some clayey SILT
Gray, moist, CLAY and SILT, little fine sand
Light brown, very moist, c/f SAND, some clayey silt
Dark gray, very moist, c/f SAND and clayey SILT, tracefine gravel
Dark gray, wet, c/f SAND, some clayey silt, trace fine gravel.lense of clayey silt at approx. 9 ft (added 5 gal of water dueto running sand)
Gray, wet, c/f GRAVEL and c/f SAND, some clayey silt. .
Green and white. SILT and CLAY, some fine sand anddecomposed rock
Green and white SILT and CLAY, some fine sand anddecomposed rock
BOH Q 18 ft; boring terminated1 330 - began reaming borehole with 1 2 in OD HSAAdded -10 oal of water while drilling with 12 in OD HSA
" " >
.oggedby: Courtney Lowe____________ Date: 04/13/99_____
Drilling Contractor: E2S1___________________ Driller: Dan Rncham/Sam Boyd
:: r3RR00027«t
Coordinates;Surface ElevatCasing AboveReference ElevReference Des
SampleType
InchesDrvn/lnRecvrd
-
--
EA Engineering, Science,and Technology, Inc.
LOG OF SOIL BORING
on:Bur:ation:c:
UpthCsg.
CGI(% LEL)
PID(PPm)
Blowsper6 in.
Depthin
Feet
0
1
2
3
4
5
6
7
8
9
0
1
2
3
4
5
6
7
8
9
0
USCSLog
Job. No. Client:6113101/2007 Harford County DPWDrilling Method:
Sampling Method:
Water LevelTimeDateReferenceSurface Conditions:
Location:/ Bush Valley LF
Boring No.EA10
•--Sheet 2 of 2
DrillingStart Finish1210 153C
04/13/99 04/13/1
•
*
Screen set from 1 7' to 7' below arade pSandpack set from 18' to 5' below grade (No.2 18'-6': No.1 £Bentonite seal from 5' to 3.7'Grout from 3.7' to grade »-14 bags No.2 sand &1 bag No. 1 sand1 bucket of bentonite pellets ?
30 —i- ————4 ti ID. SCHEDULE 40 PVC RISER. * CASMC FROM US FT. MCNE
-270, w _..._.._ — _ _ _ _ _ ._ _._ . ..
40-
f3 FT. SQUARECONCRETE PAD-%
owoe-i \\ . —— V— r-7
——— __- — 1. ——— . —————— lp " " v.
'W Xt/mTER LEva s.r — *-15 M>RL 1999
fl
ll51
1
1
1 1
1
'" 1
•••••i
*
I
1ZOM.OflEHOL
•
*
•
V
•
•
W
IM
^
:
i
i
^
«BH
r
bArnlUnOPLASTIC Of
3 — r —— • — » — ,p ^ —— a —— a..., . . . . . v , . ____
\ x< ^^ « M. OJl PRCrTECIW
STKL CASK
———— CEMDff-BOOWm CROUTFROM fiRMC TO 4.1 FT.
CASMG FROU 2JO FT. AflOVtORICHM. CWOt TO LO FT.
- ——— flEMTOWTE PEllTTSFROM 4.1 FT. TO 5J FT.
i ———— GWOMKINIU. FLTER PACKSAND 18 FT. TO 185 FT.
———— 4 N. UX OjQ2 M. SLOT
FROM 10 FT. TO 1BA FT.
s~ THREADED SCHEDULE 40^ PWC CAP AT 18,0 FT
U ——— BOHEHOLf DEPTH AT taS FT.
1-260so-j
-25060H
fl * """-240
I____I -*—————CtttfyflOWL FILTH* HCK70-1
-23080H
L_ 210
100 -1
NOTE: WELL FEATURES NOT TO SCM£
EA ENGINEERING,SCIENCE. ANDTECHNOLOGY. INC.
BUSH VALLEY LANDFILLHARFORD COUNTY. IWTlUND
WELL COMPLETION DIAGRAMWELL NO: EA-12
PROJECT MGRPAP
DESIGNED BYCBL
DRAWN BT
JBSCHECKED BT SCALE
AS SHOWNDATE5-12-99
PROJECT NO61131.01
AR000282
FIGURE2
Appendix A4
Well Development Records
AROQ0283
EA EngutttriMg, Sdaue,«wf Technologyt Inc. ^MUMMM / ^ f wet MO.
______________________________P/?~/gField Record of WeN Purging and Sampling
Bush
* '
v - i *t StL&jvtfSS, 6 ATWM Condition
Sounding'Mfthod:
Odor MMvitot:lUyMo.:
WMD^de ^ FT
CMing Atow Surf MK t. WMMS 7. 5s? FT
7. fl M
Fu*.Tfaw
Oiplll
Wmm
ToM TuffeUkyC
/.r•"rH2
Z ML
22- LLB./•rJ"o 2i
±512fl.
Uio
HIM:
Spit 7: WNhWhem:
AR00028U
CDCDCDroooen
, Sdmcc,, Inc.
Field Record of WeU Purging and Sampling
""•" **•*•*D- - _ , / , < _ P " ~ #
WBLMO.
PeristoJ&c
B«NM*H Ovtm&arOMOdftt
Ttaw
//JS"
//r.r
Wm
TOM
fa*
,7.5-0
ThrtUfey
££.
Ji£i
£%L
Mar Mi inir- Xt/aIteyNo.: ___
//9FT
D*rti «• WMR O FTAS
WoMr VMHHK g>. / ft flalM
c
11.10
,rg.
t*>io
£21
/gti -
CoiMliar
* -
Q>77/ 7.
PA- i - - - -,la.
«* Mb»: Qua;
_____________________________ Tin*
WHn Whonc
//n*r
Field Record of Wen Purging and Sampling
wttiMO,
*l Jb/fe
W»i Condition Odor
Sowiding Mrthori:
Swtao BCM** Abw* SurfMK %, 0 Tp-
U*u** ti.&BUl ^ ^
//.
Ttn»m
T«OI IMWty
. /J"36 Hi o
^^ 7
As. g.6J g.JJO
?«5i m.
7
'HHQ.tCJ
7T Jd. O-T&Vf W h
/yyp 42A
OU wol Pump Orr? Ooioribo: fo
SpMt 7: Whh Whom:
y/""-'
t Scumct,i Inc. (J. . I war NO,
L /fcLT5-A . 7?/;.cA L&V/o*.Field Record of Well Purging and Sampling ^» .
nHVofcbthod:
W«l Condition
Saimdinq Malhod;
__ _________FTSurtooo BovoMon: Oopfli to UquM: ____ O FT
Abovo Surf «oo;
cJOVOQOfC
Rofdvnoo O*«onpitoti!
Oopch M W-or ____ /-\ FT
WMrCohmn: / "7 FTWon
Tlmo(mini
PumpingfUto(ffpmt
WoMim
Tot*
(0*11
Turbidity
4£2£-
PH
•- —— *- - •
a,
6.37
// r>.Q9/ 8.
2JL r. "7¥./ "
/ ^r. 7ll 0,*9/
5"
//. V^ ."7P a**
DM Wo« Pump Dry? OoMfbo:
SamoM by: _...______________ O** _
Svnplo TVp«^_______________„._________ "niM; _
SpHt J: With Whom;
.;;.:: " AR000287
WELL NO: EA-10WELL COMPLETION DIAGRAM
3 FT. SQtWCCONCRETE PAD
GRWC
13 tHOL 1909
NOTE: WELL FEATURES NOT TO SCALE
LOCKMGSTEEL COMER
<t1mm
•
'
1
1
1 1
1
1
v^
^mm
E
_
10 KLKMCHOU
*
•
*
•
»
V
•
^
«
1
^
k
-»*m
mi
f
puenc CAP
5 P" « -» — .y^_g — B — «"- - - ____
r\ < '^ « M. 0.0. PROTECTIVE
STEa OSWC
• ———— CEMENT-eENTONnE CROUTFROM GfWDE TO U FT.
4 M. LO. SCHEDULE 40 PVC RISEROfiMC FROU 2.0 FT. ««ORKWL CRKDE TO LO FT.
• ——— BEHTOMTE PELLETSFROM 16 FT. TO 5.0 n.
i ———— GRMM10WU. FLTER PACKSAND SuO n. TO 17.5 FT.
———— 4 ft LO. 04)1 t*. SLOTSCHEDULE 40 PVC. SCREEN .FROM 7jO FT. TO 17.0 FT.
^ - THREADED SCHEDUU 40S^ PVC CAP AT 170 R
f
EA ENGINEERING.SCIENCE. ANDTECHNOLOGY. INC.
BUSH VALLEY LANDFILLHARfORD COUKTY. MARYLAND
WELL COMPLETION DIAGRAMWELL NO: EA-10
PROJECT MCRPAP
DESIGNED BYCBL
DRAWN BYJBS
CHECKED BT SCALEJOT TO SCALE
DATE6-4-99
PROJECT NO61131.01
FGUREA4-1
AR000288
WELL NO: EA-12WELL COMPLETION DIAGRAM
LOCKMGSTEEL CMER
3 R. SQUARECONCRETE PAD
GRMX
WKIER LEVEL 8.7*15M>R1 1MB
rij
v
T
•i<i
• <•V H
••i
18,0 NtOREHOLJ
»
«
•
»
*
*
••^
-*
1
^
«
T••
^
r*1
PLASTIC CAP
5T ——— »——» —— ,p S —— B —— ffl , | k . , ,, . . ______
x '" V"^»— 6 ti 0 JL PROTECTNE
STEa CASING
1 ———— CaOfT-aEHTONrTE GROUTFROU GRADE TO 4.1 FT.
- — 4 tti LD. SCHEDULE 40 PVC RISERCASMC FROU 24 R. WOVEORICRW. GRACE TO 8.0 R.
• ——— BEHTOWTE PELLETSFROU 4.1 R. TO U R.
———— GRNMTIOIW. nLTOt PM9CSAND 18 R. TO 115 R.
———— 4 M. LO. 0.01 M. SIP''1 1 laiMi i iti aur> 1 1 IK i iiFROM LO FT. TO 18X) R.
^ THRCMED SCHEDULE 40^ PVC CW» AI HO R
L- ——— BOHEHOLf DEPTH AT 18-5 R.
NOTE: WELL FEATURES NOT TO SCALE
EA ENGINEERING,SCIENCE. ANDTECHNOLOGY. INC.
BUSH VALLEY LANDFILLHARFORD COUNTY, UARYIAHD
WELL COMPLETION DIAGRAMWELL NO: EA-12
PROJECT MGftPAP
DESIGNED BYCBL
DRAWN BYJBS
CHECKED BY SCALEIJOT TO SCALd
DATE6-4-99
PROJECT NO61131.01
FIGUREA4-2
RR000289
WELL NO: EA-11WELL COMPLETION DIAGRAM
THREADEDPVC CCMR1
GR«E-\\ WTER LEVEL Otf\ 14 tfHL 1999 w*'4m®r
•
V34) M.IOREHOU
*
*
*
«
*
«, •
'
'<®m&
———— BEMTOMTE SLURRYFROU GRADE TO 134 R.c BI in crucnHC 4A nur* UMJI:UCASWG FROU 141 R. MO*ORIMW. CJW* TO H-0 R.
———— FME FCTERSAND 134) R. TO 174) R
— — — 1 1/4 OJL PRE-MCKED SANDSTAINLESS STEEL SCREENFROU 14:0 R. TO 174) R.
^ — OCPOSBli SUNLESSX STEEL POWT 174) R
^ ____ cvumi/'ri r nrvrij AT \ i n FT
NOTE: WELL FEATURES NOT TO SCME
EA ENGINEERING.SCIENCE. ANDTECHNOLOGY. INC.
BUSH VALLEY lANDFILLHVfORO COUNTY, UARTlANO
WELL COMPLETION DIAGRAMWELL NO: EA-11
PROJECT UCRPAP
DESIGNEDSMW
DRWM BYJBS
CHECKED BY SCALETO SCALti
GATE6-4-99
PROJECT NO61131.01
FIGUREA4-3
RR000290
WELL NO: EA-13WELL COMPLETION DIAGRAM
THREADEDPVC COVERi
GRADE -i\ WATER LEVa Offt 14 ***, 1999 .
1
!
1
1
1
1
•MM
\y
*
*
i
«
^
34) IN.BOREHOLE
———— BENTONTE SLURRYFROU GRADE TO 134) R.
———— £ M. LO. SCHEDULE 40 PVC RISERCASNC FROU 141 R. ABOVEORJCtW. GRADE TO 144) R.
———— FME FUERSAND 134) R. TO 1741 FT.
SHUNLESS STEEL SCREENFROU 144) R. TO 1741 R.
^ DGPOSBLE SWNUSSs STEa POINT 17.0 R
- ——— BOREHOLE DEPTH AT 18.0 FT.
NOTE: WELL FEATURES NOT TO SCALE
EA ENGINEERING.SCIENCE. ANDTECHNOLOGY. INC.
BUSH VALLEY LANDFILLWRFORD COUNTY. MARYLAND
WELL COMPLETION DIAGRAMWELL NO: EA-13
PROJECT UGRPAP
DESIGNED BYSMW
DRAWN BY
JBSCHECKED BY SCALE
JOT TO SCALEDATE6-4-99
PROJECT NO61131.01
FIGUREA4-4
flR00029l
Appendix B
SVGA Procedures
AROQ0292
APPENDIX B SOIL VAPOR CONTAMINANT ASSESSMENT
B.I Methods and Materials
B,l.l Shallow Soil Gas Samples
An SVGA survey was conducted at Bush Valley Landfill to evaluate the extent of potentialmigration of organic constituents through the subsurface soil. Soil vapor sampling locationswere established around the perimeter of the landfill, within and beyond the limit of waste. Thelocations were placed at approximately 100-ft intervals beyond the limit of waste, and 200-ftintervals within, using a Sokkia electronic distance measurer (EDM), tapes, and visual sightings.Alphanumeric designations were assigned to each sampling location. The east-west trendingsurvey lines were assigned alphabetic designations, A through J, and the north-south trendinglines were assigned numerals, 1-17, beginning from the western-most line. The origin of thegrid, Al, was the southwest corner. Four of the proposed locations, Al 1-A14, were notaccessible due to overgrown brush and were therefore, not sampled. A vapor sample could notbe collected from location G4 due to the presence of standing water.
To collect the soil vapor sample, small diameter, hollow steel probes with a 6-in. screenedinterval at the terminus, were driven to a depth of 5.5 ft below ground surface. Six locations onthe southern portion of the grid were sampled at a second depth of 7 ft. A vacuum gauge wasattached to the top of the probe and a vacuum applied for a minimum of 2 minutes to evacuateambient air from the probe. During pumping, resistance to vapor flow was measured via the in-line vacuum gauge. If the vacuum gauge shows essentially no reduction in pressure after thevacuum pump is activated, vapors are being readily obtained. Typically, a 1-minute purge timeis adequate. However, a 2-minute purge was performed during field activities due to theresistance to vapor flow experienced at many of the sampling locations. Subsequent to purgingthe probe, a sampling device was installed on the top of the probe. The device consisted of avacuum gauge with tubing leading to an exterior port on a plastic container. A tedlar bag wasplaced within the container, with tubing leading to the exterior port. A vacuum was applied tothe container, allowing the bag to fill will soil vapor pulled from the subsurface.
This type of device was used to insure an adequate amount of vapor sample for analysis ofcarbon dioxide, carbon monoxide, and oxygen using direct reading instruments. A sub-samplefrom the tedlar bag was used to analyze for benzene, toluene, ethylbenzene, m&p-xylene, o-xylene, methylene chloride, trans 1,2-dichloroethylene (trans 1,2-DCE), cis 1,2-dichloroethylene(cis 1,2-DCE), l,l,l-trichloroethahe(TCA), carbon tetrafchloridCi trichloroethylene (TCE), and
B-l HR000293
tetrachloroethylene (PCE) using a Varian 3300 gas chromatograph (GC) equipped with an flameionization detector and a electron capture detector.
Soil vapor samples tend to contain many compounds. When a sample is injected into the GC,compounds are first separated by an appropriate analytical column. As the separated compoundselute from the GC column, they enter the detector and create a signal. The signal is thenamplified, integrated, and reported as a chromatographic peak.
The integrating software prints out a chromatogram, which is a continuous graph of GC detectorresponse to the eluting compounds. Subsequently, a numerical summary of peak areas is printed.
The GC was calibrated by injecting a known amount of vapor standard containing the »compounds of interest onto each column. Compound retention time and response data are usedto identify and quantify the selected compounds in the samples.
Standards were run at the beginning and end of each day. Blanks were run at the beginning ofthe day and as needed at the discretion of the GC chemist. "
L
B.I.2 Deep Soil Gas Samples -4.
Deep soil gas investigations were completed by Target Environmental Services under contract andsupervision of EA. Direct-push technology was used to advance connected 3-4 foot sections ofnarrow diameter threaded steel casing to the sampling depth of approximately 17 ft. Once at depth,the casing was hydraulically raised several inches in order to release a disposable drive point and Jopen the bottom of the casing. Polyethylene tubing with a threaded stainless steel tip and "O" ring *was inserted into the casing to the bottom of the hole, and threaded through a plug which isolates .. the bottom-hole sampling chamber from the up-hole annulus. A sample of in-situ soil gas was then |withdrawn through the probe with a vacuum chamber and used to purge atmospheric air from thesampling system. A syringe equipped with a needle was used to penetrate a soft portion of the f
Bsampling tubing and withdraw an aliquot of soil gas. The sample was then injected into a pre-evacuated glass vial. The self-sealing vial was detached from the sampling syringe, packaged,labeled, and stored for laboratory analysis by Target Environmental Services. All sampling holes *-were backfilled with bentonite and the surface repaired with like material upon completion of the ?sampling. «
The deep soil gas samples were analyzed by Target Environmental Services "Home" Laboratory by Ia GC equipped with an election capture detector (ECD) for chlorinated compounds following
B"2 BR00029U
modified EPA GO 10 procedures, and a flame ionization detector (FID) for aromatic hydrocarbonsfollowing modified EPA G020 procedures. A thermal conductivity detector (TCD) was used foranalysis of methane and the fixed gases (oxygen, carbon dioxide, and carbon monoxide). Standardswere analyzed in order to quantify the chlorinated and aromatic compounds to a reporting limit of1 .0 (ag/L. The target compound for the deep soil gas analyses are provided in Table B-5.
New tubing and syringes were used for each sample. Prior to the day's field activities all samplingequipment and probes were decontaminated by washing with a Liquinox/water solution and rinsingthoroughly.
B.2 Results
B.2.1 Shallow Soil Gas Samples
A total of 77 soil vapor samples from 71 locations were analyzed on site between 18 and 28August 1998. The sampling locations are illustrated on Figure B-l. The results of the SVGA areshown in Table B-l. Samples were collected from a depth of 5.5 ft unless otherwise noted with asuffix of "-7" indicating a 7-ft sample depth.
Results indicate the presence of trace concentrations of chlorinated compounds within, north of,and at the southwest comer of the limit of waste. The deeper sample collected from location B4reported concentrations of TCE (0.03 ppm), and PCE (0.01 ppm). A concentration of 0.02 ppmof PCE was reported in the sample from location Dl. The sample from El, on the west side ofthe limit of waste, reported concentrations of TCA (0.04 ppm), TCE (1.2 ppm), and PCE (1.6ppm). The sample collected from E8, within the limit of waste, reported concentrations of cis-1,2-DCE (14 ppm), TCA (0.03 ppm), TCE (1.6 ppm) and PCE (4.5 ppm). Trace concentrationsof TCE at 0.06 ppm and 0.09 ppm, were reported in Fl and Gl, respectively. Traceconcentrations of PCE were reported in G10 (0.02 ppm), G14 (0.04 ppm), H10 (0.16 ppm), and110 (0.03 ppm). Location 110 is north of the limit of waste. Cis 1,2-DCE was reported in G14(3.7 ppm) and H10 (3.1 ppm).
The BTEX constituents, along with other unknown hydrocarbons, were quantified as totalhydrocarbons for comparison purposes. Hydrocarbons were reported throughout the site, withconcentrations near or over 100 ppm occurring just at or within the limit of waste exclusively:C4 (86 ppm), D2 (95 ppm), E2 (130 ppm), E4 (200 ppm), E8 (410 ppm), G10-14 (ranging 97-320 ppm), and H10 (280 ppm). Benzene was reported in 1 1 locations: B4-7 (1.4 ppm), C4 (2.9ppm), C6 (0.2 ppm), El (5.6 ppm), E2 (1.9 ppm), E4 (2 ppm), E 8 (3.3 ppm), G10 (2.2 ppm),
B-3 RRQ0029S
G12 (2.6 ppm), G14 (22 ppm), and HI0 (1.7 ppm). Results indicate the highest concentrationsof hydrocarbons occurring near the northeast and southwest portions of the limit of waste.
Methane is a natural breakdown product commonly found at landfills and, as expected, wasfound at varying concentrations throughout the site. The buildup of vapors, especially methane,to potentially explosive concentration is of concern at any landfill. The lower explosive limitconcentration of methane in air is 50,000 ppm (5 %). Table B-2 presents the reported methaneconcentrations as well as carbon dioxide, carbon monoxide, and oxygen, all of which areindicators of biogenic breakdown processes. The concentrations ranged from son-detect to86,000 ppm at location C4. Elevated concentrations (greater than 10,000 ppm) were generallylimited to within, north of, and west of the limit of waste. In addition to this general trend,elevated concentrations of methane were reported in B4 (12,000 ppm), B4-7 (41,000 ppm) andC14 (39,000 ppm), south and east of the limit of waste, respectively. Methane concentrationsappear to disseminate prior to reaching the residential area on the south side of the landfill.
The extent of methane was not fully delineated north and east of the landfill due to the presenceof wetland areas and streams. West of the landfill could not be fully characterized beyond thedirt access road during this field investigation due to property access issues.
B.I.2 Deep Soil Gas Samples
The analytical results of the deep soil vapor samples are provided in Table B.3 and B.4. Ingeneral, chlorinated and aromatic hydrocarbons concentrations in the deep soil vapor sampleswere low (i.e., less than 20 |ag/L). Elevated methane concentrations however were detected in 7out of the 8 samples collected. Methane concentrations, measured in percent, ranged between.21.7 and 48,9.
flR000296
BR000297
1 V)
e-si fN
so
S s* °-X ~ V
™ •• •_g» g BS S
s sss 00 00
(N (S (N
LU
uO
uC/D
ICQ
mUJ
CD
H
SO
9 9
"I£
o9eo oo99 9
99 9 9
o o9999999999 9
899999999999 99 99
gll? 9 9so
99 9SO
9 9(S (N cs $
9 9 999
n *CN (N (N (N
CN CN CN fN
9 9 9 9
0 «u "B '"*u "B '"*••£ B>»S9'
s vt
999999 V V
m s ss0.
s3ss s03 CD CQ ffi
' ft AR000298
I
CQUJUca<:
1 **isllfH*:_SS
V *+.A S B® *-&:..x *cL 1-5-*& s «•*? Jt a.S1 >. o.X ~
l?§f- c &•M|S
S-ffV fi- ft**I"t.H .&
1 *~*H a£§H?U Q.^3
g ASC^#£3lsi * ft3^3e
;SB*
•~ -Si3*1j, H->**sy e« o o.*i*e «lit***ssS
Ji' Of,- -• B: i*'"
VI
rn
*fnOV
1*1nOV
oo
9
o(NOV
om?CNCNO
O?o?o?oen9
ofnOV
CN
9
w
sor-i
*>mOV
C*lmOV
oo
?
ofN
?
Ofi
?
Os
O
O?o?o?ofn?
om?
S?a.r>9«•«u
Pt'
•o<*iOV
r-imOV
ooOV.
ofN
?
Ofn?
<nOd
o?
o?o9ofn?
OfnOV
CN00
9
0
VI
•*>f\OV
mf»iOV
00
oV
ofNOV
omOV
o?o?o?o?em9
om?
S9
SOOO
om
OCN
O«•V
Vlm
ONfN
O
9
o?o9
o9oen9
om?
S9
»3
*T
Vl
•*r
Ov
fNfN
V)
O
SO
OV
o?o?o9
o9
s?rsSO
?
V
VlV
ONfiOV
fnSOd
m
?
wn
?
OCNO
O?fnOO
o9
o9
s?fNSO?
V
v>V
CTim
9
r-fn?
mOV
v>
OV
•o
9
o?o?o?o9
S9
fNSO
9
V
.
VIV
CT.moV
rmOV
mOV
VI
OV
*o
?o9
o?o9
o9
s9
(NSO
?
V
. .
TTfN
o
&r-
fN
9
so
?
O
?
O
9
O
9
O
9
i9
(Mso
?
V
or-
OsmOV
sofn
V)pd
oV
£?
o?o9
o9
o9
S9
CNSOOV
V
ou
ONm
OroV
rVIoV
VI(NOV
m?
Vl
?
O
9
O?o9
o9
$9
<o?
V
U
J-
oroV
r-<nOV
VlfN
?
OV
Vl
?
O
9
o9
o9
o9
S9
VIVloV
V
a.*U
(N
Or-oV
or-
ON
m?
v>?o9
o?o9
o9
s9
Vl?
V
fNU
^fN
Or*oV
t»nOV
VlCN
?
OV
Vl
?
O?o9
o9
o9
S9
VN,
?
V
MU
NO
rr?
VI•?so
9
O<N
?
mCN
9
O
?
O
?
O
9
o9
X9
V)OV
V
TU
m
r*-voV
Vl~OV
•o
?oCN
?
mfN
?
Ho
o?o9
o9
s;9
v>?
V
Q
<N
r"T
?
Vl•«•?—?OP4
?
mCN
?
O
?
O?o9
o9
S9
VIOV
V
«nO
VlON
visOd
VIVl
end
oCN
mfN
9
o9
o9
o9
e9*•«n9
V)?
V
SO•<r
r—v?
VI
VIr-d
fnCN
?
O
?
O?o9
o?39
VlOV
V
a.
3s
oso
ON
VINO
VI
d
oo
?soVI
SO
"CN
~
O
9
So
»n9
o~oV
V
;
W
om
VIm?
1rf
V)so
O>
Os
O
9
o9
o9
o90t
29
oT?
V
Q
oN
ooo
o
oo
oCN
O?o?o9
o9Osm9
O•VOV
V
s
os
o
SOf
r
o?
o9
o9
o9o*m9
3oV
V
a.
s
ooCN
VIm
V
~CN
fN•Vd
soo
VIfN
?
fnoo
o?o9
o9Ot*n9
O^
?
V
oT
oso
V|
O
fnm
VI1
so
~
O9
fnOO
^
O•<roV
V
VIV
vimOV
TmV
<<r
?
oooV
VlfNOV
o?o?o?o9o>m9
o•*r9
V
oUJ
so
VlmOV
•*rmV
TJ-
?
00
oV
VlfN
9
od
o?
o?o?OHm9
o•*!•OV
V
Ul
(N
Tj-OV
vtTT
V
SO
V
OCN
?
fnCN?mCNd
ooV
o?o?VI?•fVIoV
rV
«•Ul
oo
TT
V
VlTTV
so
V
orsV
fnCN
?
O?o?o?o?*TV)
9
~«OOV
t-V
«UJ
-
o>CN
9
m
~00
?fn
?
so
9
o9
$d
o9
o9
m9
m?
$9
viV
ONrNV
N
V
00
V
fn
?
so
?
CN
d
CNO?ooV
o?m?
mOV
Os00
9
<NU.
VIV
ONfNOV
(N
V
00
V
m
?
SO
9
o?(NO
?
O
9
o9
m?
m?
S9
r*h
AR000299
ialll<2":_SS
« vA S i-6g-s
41?*O <J O.S' >-> 0,X~
4*">. S g5 § |w S a-
flQ
s~5 a2 S.3 CLH~
«»s O8 Si &3~u 9"y o.S. o.
WU o.H^Si'50•25? ISS-8 S5H-s5'
< gU 0.H£
-8tA**. « SR sP T Bufinas *C *O <-s•£•= E•a 5 g>* a 3SU
® Protect ?u.«.li \/V, /If./ LfLf^lhil________ Project No. tV f/3/ • O 'Subject /?//?i ,/ti.fti L i !~'-( $*< tet-r . f et*. Sheet No. ____^ of____Xa.-/£_________________________ Drawing No.Computedby. '../n Date /j,/9.£ Checkedbv /•*(}&* Date
Year Opened: 1975 Current Year: 1998 Year Closed: 1983Capacity: 499400.000000 MgAverage Acceptance Rate: 21713.043478 MgfyearAverage Acceptance Rate Required fromCurrent Year to Closure Year: 0.000000 Mg/year
Model Parameters
Methane Emission RateYear Refuse In Place (Mg) (Mg/yr) (Cubic Ft/yr)
DATA FORM JS .__£.ROUTINE WETTJXND DETsSMINATlONnS87 CCS Wettanos Delineation Manual) ————————
Proiect.'SitB: £&trf~ &*</&*Aoolieant/Ownen d&&'&. fdxvfaInvestigator • •xr /-C ^ 1Oo Normal Circumstances exist on the site? Ye£l_(££{PIs tne sits significantly disturbed (Atypical Situation)? c XNoIs tne area a potential Problem Area? Yes (ft$J
Proiecs/Site: $"* &//&/Aooiicant/Owner <&'*£''£•[ 1*r— rVInvestigator f%jt- . fsr> /Do Normal Circumstances exist on the site? Yes ^NcpIs tne site significantly disturbed (Atypical Situation)? X ) NoIs tne area a potential Problem Area? S'es <go>
(If needed, exniain on reverse.)
Date: B / X iSCounty: Xfen&-X.State: /
CommunityTransect IDPlot ID:
v\/>ID::
VEGETATION
Indieerer
i.
4.
S.
6..
7..
8.
Srr.ru
s.10..
11.
12.
13.
14._
1S._
16.
Percent of Dominant Sovete* met ere OBL. FAC^V ar FACsino FAC-I.
Remenea:
HYDROLOGY
ra Recanted Data (Oesenoe in Aemenui:__mi_r Sireem. Lwte. er T«le Gauge
Aeoei Photagrvaney- _ OtBer/\_ No Racartad Oet* AvwlaDla
n«wl C&eervetione:
Oaatn of Surface Weier *— (irU
Q«Rfi to Pr*« Weter m Pin /I/** _ fin.1
Qefltn en S«ur«ed Soil: /yff~ flpj
Weeand H>«n)iagv Inoieaten:. Pnmary Indicecon:
___ inunaaceaSetunned in Uoper 1 2 tncnee
_ water Menu
_^_ Seoimenr Ovoowta
Seeanoary inoieeioni (2 er more reourvol:OadUed Root Otennei* m Uooer '.t Incfle*Weter*StBn«d L»ev«»lAcal Satl Survw Oeu
_ _ FAC-Meutm 7«tOmar (CxDl«n in Rernanul
m^^—— »a » «* ^
RR000328
SOILS
Mao Unit Nemo(Sanaa and Phnei:
Taxanemv (Suttgrawi:
*,*!. 0T l-nPT";Oeoin Matrix Color
/ rlHel Ott varvaaane>xCoflrirm Maeead Tv»a? Yea No
X !Macda Calan Maree Taxiur*. C«nereaana.rMun***i Moml >ltninaenee/Canm«r Smierwf*. tte.
_ Cancreoont_ru- High Orgetve Camam in Surface L»var in Seno ».. Organrt Screew«tg in Sandy Soila
Uatad an Lacd Hydric Soto Li«t * * <_ Uatad an Naaamt Hydrie Seila U«ti _ Ochar (EntaMi in Aamarlul
Rements:
/WETLAND DETERMINATION
"iw ro p n roc Vegatanan Pvvfani/ vY*JWedand Hydralagv Prwam; Ya«Hydnc Soda Preeant/ Y*» (
Na (Crctat (CrcJ*
"S ) , I* tm« S«no*in4 fame WIlMn a Weaand? X Yea y r1-£**ffipP £*&st ^ ——
oy
AR000329
-l -»
DATA FORMROUTINE WETLAND DETERMINATIONU93? CCS Wenanos Deiineaticn Manual)
Project/Site: &<& PA//&SAoDiicant/Owner A6s£sd' fX fa/Investigator dk/£- X_^K
Do Normal Circumstances exist on tne site? Yes < p)Is tne site significantly disturbed (Atypical Situation)? <25* NoIs tne area a potential Problem Area? Yes /ti$
(If needed, exolain on reverse.) ^ ^
Date: S/*/?*County: y jtitsyOWState: X MCommunity ID:Transect 10:Plot ID:
VEGETATION
t.
3.*.
5.
a..7.
I/ ErfC.
10..
11.
Soectr* Srrtruf* indieirer
1*-.13..
**•.IS.
16.
Percent of Domnent Soeciae tnat ere OS1_ FACW or FAC(eKcmoino FAC-). * ' ."''"' "**.'"T' ——
Remenu: <*£.
HYDROLOGY
___ Recorded Data (Oeeenoa in Remanui:____ Strvem. LMO. or Tide Geuge^ Aenel Phoiogni0ne
Soila Ptveant/ "" Ya« Na Is tfta Stfming Pomt Wltfiin a Wedand? ( Yaa ) Na
HR00033I
DATA FORMROUTINE WETLAND DETERMINATION
(1387 CCE Wetianas Delineation Manual)
Project/Site: J l£/k*SAooJicant/Owner: fifafc fa fa/Investigator tffc>*~ / £s* /
Do Normal Circumstances exist on the site? JxpiC 2'is tne site significantly disturbed (Atypical Situation}? (i**)J&.Is tne area a potential Problem Area? Yes (No)
(If needed, exotain on reverse.)
Date: f/f/f/ -County: Ms&etState: ,&•&
Community ID:Transect ID:Plot ID:
VEGETATION
Srren/m
3.
s6..
7.
Soectv. Sfrtnjm t«aie§r,r
9.
10._
11.
1Z._
13..
1*.
is..«
Percent of Oominent Seectee met urn 08L. FAOV or FAC(ezcmoinq FAC-). _ , J 1"1'**", ---
Remeru: H
i_
HYDROLOGY
-_' Recorded Data {Descnoe in Romenut:*•' ' __•. Streem, Lue. or Tide Geuga -
- .. Seoiment OeoostaV^ Orwnege Penem* in Wettenas
Second ary Indicator* (2 or more reouireo):__O»dued Root Otenrte4e in Uooer '•;___ Weter-St*n*d Leave*_ _ Local Soil Survey Oeu__ FAC-Neutrtf Te«^__ Otfter (Enian in Remanul
Conanoani_ _ High Organ* Cantant in Surface Liver in Sandy Soil*
" ~ ~"_"__ Organic Straateing in Sandy SWe r———••---•——Regime Uatad an Uc* Hytfnc Saito L»«' " \
, Reduerng Candioart* Uatad an Na n Mydric Sdfla U»t "*•"'', Clayad er U Chrome CffHer. j.- .. _ pmar (g«* n in Remartu)——..__:-.__'
Remenca*
~7
WETO-AND
Vagvcnwn Pmam/Wedand Hvdratagy Preaam/Hyane Soda Preeain/ Yew Na —
(Grtiet
la trua S«no«nq Point Wflhm a Wedand? Yew No
oy nOU&AC*
AR000333
DATA FORMROUTINE WETLAND DETERMINATION
:'• 987 CCS Wetiancs Delineation Manual)
Proiecr/Si»: $S*s4 tfeJf&SAooiicant/Owner jf fa J W-V1 n vestJcator &o <- /<F/n /Do Normal Circumstances exist on the site? Yes (Is tne site significantly disturbed (Atypical Situation)? < 5f) ifeIs tne araa a potential Problem Area? Yes No)
(If needed, exotain on reverse.)
Date: /A/£tfCounty: A&r&*c£State: /?//)
Community 10:Transect 10:Plot 10:
VEGETATION
Bf f aiy»f Specie* S_tr-tum
1 . /Va / />
3.*.
5..
a._7.t.
s.10..11..12..
13.
IS..
15.
Percent af Oaminam Soeciee mat are 08U FACA/ or FAC[•xauain FAC-J. "'1
HYDROLOGY
R*can9e< Data (De.enOe in Remenut:_ Streem. LM.«. or Tide Ceuga
_^ Aen« Photo qreoneV _ Omer/ Na Reearaod Oeu AwlaBla
n«*d Ctiaarwnanet
Oeotn of Surfece Weter C_-X fin.)
Oeotn ta Fr»« Water in Pic /T/rT fin.l
Oeooi ta 3«turvted Soil: fUn firU
^ _RMiurui _i? y*vf tf/
Weeend Hvarotogy inoicatamPnmary Indieatars:
_m_ inunaetad__ Saturated tn Uoper 1 Z Incne*_ Water Menu
Qnft LJnee_ij Seoiment OeeoMCi>^ Oretnege Pettem* m WeOanas
Secanoery Indiceton (2 or more reauirea):_ Ondized Root Chennvts in Uooer \2 Incne*_ Wetef Started Leevea
Do Normal Circumstances exist on trie site? Yes <ao2Is tne site significantly disturbed (Atypical Situation)? <£e}J NoIs tne araa a potential Problem Area? Yes^^No)
(If needed, exolain on reverse.)
Date: £/$~/?%County: Mrrt4>sr(State: 'yy?vO
Community ID:Transect ID:Plot ID:
VEGETATION
OommeT "»f*r So»-t»» Stnrum tndieeror
i. -?£,,*,< e$k&f A- ffct*)*Z. .*f /urf'h M O£<—3. < X-X * #<vi>< / //C-A.s.6.
7.
a.
Percent of Dominant Soeciee Wet ire OBL. FAOV or FAC(•xauoin? FAC*).
Ramanu: J *+S *&?& **f++- --?** * **~
Domnenf »*f*r Soeeip* Sfr.ruirt maietror
S.
10.
n.1Z.
13.
1*.
IS.
16. '
*"''
HYDROLOGY
.._ Recarted Octe I0«_enae in Aemencj):Streem. Laxe, er Tide GeugeAenel PhotogreoneOmer
V^ No RecwQed Oeta AvwiaDle
"*td Cbeerveoon*:
rOQeam of Surieee Weiert *• — fin.)
Octroi to Fr*« Werer <n Pttr r\J/r fin.]
OeoOi to S«iume<l Soil: «y7" finj
RementK ,t>>/T?J*X £?rT<S. « (T-V
Weoend Hyarology Inaieetor.:Pnmery Indicator*:
_ inunaeteoSetunned in Uoper 1 Z IncneeWeter Mems
^ Onfl LJnee
X" Dreinege Pirterm rn WeOengsSeconoery Indicators tZ or mere reoutreol:
___OndUwJ Root Chenneia in Uootr *,t lncn«»_____ Weter-Staned Leeve*
L0cM Soil Survey OeuFAC-NeutrM i e»tOW»r (Esitan in Remenu)
Do Normal Gr cum stances exist on tne site? Yes (3)Is tne site significantly disturbed (Atypical Situation)? Sftt tfoIs tne arva a potential Problem Area? Wrt $
(If needed, explain on reverse.)
Date: ft&/?£County: >fc£-*<i-State: & b
Community ID:Transect ID:Plot ID:
VEGETATION
1. j r***/' , rt*. it &*> /r3. Ml~ /*£*+>*> ~7~
/. V3. < i/<Z "*.+*&•'<*. s)**"*"*-*' r
f t7.
9.
1°-.11.1Z,.
13.
1*.
IS..
16.
Percent of 0 eminent Soecta* tnat ar* 08^ FAC" or FAC(excluding FAC*}. ~
Remaru:
HYDROLOGY
_ Recanted Dot* (OeeenOa m Remenul:Str*em. Lute, ar Tide Gauge
. Aenei Photograone
/\ No Racortad Data Avedada
netd Ctiaorvatian*:
Oeaai of Surface Water CX finj
Deotn to Fr»« W«tar in Pic /"// (InJ
Oaetn to S«nmted Soil: A^f* finJ
Remarvos *£ 0(-'**-Jr~ ; r pc.fr " - - -:
Weoond Hyonrtagy inoicoton:Ptwnary Indicator*:
__ tnwnoateaSaturated in Uoper 1 Z Incnee
__ Water Menu__ Onft Line*
Seoiment Deoe*iQ>C Qrotnege Petteirw in Wedenoi
Seconoary (ndieaton (Z or more reouireal:Ondiied Root Chennet* in Uooer '. Z Inene*
___ Wat*r-Stjon«d Leave*Locri Soil Survey 0*u
__ ( FAC-Neutr** Te*tOtner lEacstMn in Revnanut
SOILS
\
Mao Unit NametSene* and Pn**at; Oramogo C«*a: _
Betd O&*arvaaan*Taxonomy (Suowowot: _______________ Confirm Maooad Tyo« x' Yea Na
Doom Matnx Color Moid* Color* Mont* £a£tura. Coneroaono.M«i»Tt
XH rtrie Soil Indicator*:
_.Hwtoool / '•' Concrooon* . ......... -__ Ht*M CatoaooiyX _ _ _ _ High Orgarec Cont*nt in Surface Liver in Sanr • S
SuUtdicOdotX _ Orgonia StfeeKJng in Sandy Soil* _"_ /___ Aowc Moiriton R*gimo Uatod on Local Hydhc Soil* U*t__ Roduong CAndiocns __ Uatod on Nonnol Hydric Soil* Lwt__ GIoyM or Law-Chrome Color* - __ Othor (Sxaimn in Mamarkal/ _____
Do Normal Crcumstances exist on tne site? Ye_? (tioj1Is tne site significantly disturbed (Atypical Situation)? ( «3> NoIs tne ar%a a potential Problem Area? Yes $>
Oo Normal Grcumstances exist on me site? Yss /NgIs tne site significantly disturbed (Atypical Situation)? /rei NoIs me area a potential Problem Area? TVs <$2
(If needed, exolain on reverse.)
Date: £ A~/fCounty: / ^ '•*<State: S#J>
Community ID:Transect ID:Plot ID:
VEGETATION
joeete. ___ Stratum
T3.
S.
6.,
7.m
I.
Comment **yf 3o*ett«_________ Stratum fajeafor
3.
10..
11..
12..
13.
15.
Percent of Pomtnant Soeae* mat are OBl_ FAC// or FAC(exouoing FAC-l.
Remenu:
HYDROLOGY
r__ Recoraed Pot* (0**eno* m Remerut:__ Stream. L*«a. or T_Se Ceuge
Aanol Phetegraon*\f __ otn*r
/£__ No Recorded Pau AvwlaCM*
n*»d Cb*ervaoane:
ODeem af Surface Water - fin.)
Oeotn to Frw Watar in Pic /L//' fin.)
/ /y4-Oeetn to Samrotad Soil: f f\ fl-j
Remamo: ^ ^ r/fy> ~ <& £"
Weoand Hyoralogy Inoicetor*:Primary Indiootor*:
___ inunoatad__ Sotum*d in Uooor 1 Z Incne*
__ Water MenuOnft Line*
^?< On*neg* PeRem* in WeoendsSeconaary Inorcaior* (2 or more reoureal:
Oi»dU*d Root Chermvl* m Uooer '•! tncn**_ u W*t*r-Stoined L**ve*
Loc« Soil Survey Q*u_ FAC-NOUV* T*«
Omer lEnlain in Ramenui
-,-tT - AJkt -
flR0003U6
SOILS
Mao Unit NameCSenea and Phaaat: _____________ _______________/Oranogo Caaa:t5raino
Oaotn Mount Color MotB* Colon / More* Tonura. Con«ro«ona.MO left'' A puffd *nc*rCtfff O*T amjC UT . OfC. ___
Hydho Soil
_..... ^^ Cancraoon* . _ . . ... ___w Gsioooon _ High Orgarac Content in Surface Uivar in Sana-
tor _;~ ~*_ _ Orgor-o Siro*ejnq in Sandy Sotfa - ""'_, Agiao Moi*tur* R*guno "~ Uatod on Uc-< Hy nd Soilo Uat 'f~_ Reduang CondtQons __ Uatod on Nooonal H rte Soilo Uat-___Cloyod or LowOiromo Colon Othar l£™iawi in Ramanta) . . . ._.——— -..
WETUXND DETERMINATION
Hydroorryoc VagaoHMn Pr»**m7Wedond Hydrelagy Pr***m7Hydnc Sod* Pi leem.
YaoY**
No ICrdolNoNo
(Cm*
1* tft* S_mo-r*g Point Whhin o WeOend? / ** J h
AR0003I*?
DATA FORMROUTINE WETLAND DETERMINATION
It987 CCS Wenancs Delineation Manual)
Proiecs/Site: &S/ J /'tyAooiicant/Owner: dLrfird '(S~jUsInvesticaton / ^ X >'
Oo Normal Grcumstances exist on the site? Yes (No)Is tne site significantly disturbed (Atypical Situation)? YM NoIs tne area a potential Problem Area? res <tfo>
Oo Normal Grcumstances exist on tne site? Y_s (JTOIs tne sha significantly disturbed (Atypical Situation)? *cs) NoIs me area a potential Problem Area? res t&
(If needed, explain on reverse.)
Date: &/T/P&County: /ftx » — State: /9i$
Community ID:Transect ID:Plot ID:
VEGETATION
Soeei-« Sjr»tvm Indicator
3.
A.
S.,
e.7%
I.
3.
™>.
'K12.
13.
IS.
Percent of Dominant Soecie* mat ar* 08t_ FAOW or FACJ *«cniding FAC-1.__________________________
Remencs: --- -.——-_..._ , .—— . ._ , _- .^
HYDROLOGY
_ Recoraed Oata (D**enO* in Remenui:Slreem. Low*, or Tide Geug*
_. A«nel Photograan*y/" OmeriA^ No Raeonlad Pata Avodaote
Do Normai Circumstances exist on the site? Yes /RbIs tne site significantly disturbed (Atypical Situation)? / es) J2\Is tne area a potential Problem Area? T1" <£S/
(If needed, exnlain on reverse.)
Date: £/S*/frfCounty: flfa&rd.State: /n&
Community ID:Transect ID:Plot ID:
VEGETATION
Str»Tum
i.
3.
4.
S._
s._7.
S.
Oormnenr "»nr So.dM Sfrerur- '"tficirer
S.
10._
11._
'*•.13..
1*-.IS.
16.
Percent of Dominant Soecie* that ar* OBL. FACJV or FAC(exaucrtng FAC-}.
Remenu:
Recorded D*t* (Oe.enOe in Remerui:Streem. Lane, or Tide Geug*
__ Aenel PhotogrooneOlfier_._._
No Recwded Data AwlaDle Weter Maru
CA*erveaona:
Oeoin of Surface Water
„W«.r m Ac
ta Setunrted Soil:
O (inJ
finj
Weoand Hydrology tnaieetors;Pnmary Indicators:
^__ inundatedSaturated in Uoper 1 2 Incne*
Onft IJneeSeoiment Oeoenta
Pattern* in WeOenasSecondary Indicator* (2 or more reouirea):
Oadiied Root Chermet* m Uoo«r M Incne*___ W*ter-St*n«d Leave*__Loc« Soil Survey Oata
Om*r
RR000356
J
SOILS
Mao Unit Name > • 1(Sana* ana Phnai: __ Ononogo ^ '_ _
field Qttoo«voo7onaT«K*nomv rSuttgrouot: • - Conflfnvntfaoooo Typo? Y*a Na
Motm Color Moca* Colon More*
Z.
Hydrie Soil Indieatonc
. L Concnaon* - . - . . . ._ ,. _Hf*M f toeoon ^ High Orgonrc Content in Surface Lavwr in Senoy
Odor _ ~_~ " ~ ,_ „, Orgonia Scroacing in Sandy Soil* _ ._.._"!__ A fio Moiatur* R*9m* __ U»iod on Loetf Hydric Sod* Lurt
tang Condition* __ U*t*d on Novonol Hydlio Soilo lot '" ''Gleyod ar Law-Chroma Colon Olnor (£n**n in Mantanto) .... .,.
Oo Normal Circumstances exist on trie site? <rej) NoIs tne site significantly disturbed (Atypical Situation)? Yes (±$Is tne area a potential Problem Area? £Jf?P No
(If needed, exoiain on reverse.)
Date: £/&/?#County: /fa fy-atState: /*L&
Communitv ID:Transect ID:Plot ID:
VEGETATION
3om**e*r •l»wf Soeete* Stranjm Indicator
1. Jcv'tAbr' f*(At+"'at*r /¥ &Mu +Z. ' ''3.4.
S.
6.7.
a.
Percent of Dominant Specie* met are 081. FACW or FAC(excusing FAC*|.
Rements: . _._ -. . , .-. ... . . .. _.. ._ .. __
Oo-mnanf **«nr Sotete* Srf»tum '"Oiettor
3.
10.
11.
12.
13.
u. " " •- •'IS.16. -.-..,.._
-. . ———— .._-..-.. ... , - .._ — -— • —
HYDROLOGY
__'_ Recorded Data IOe«enOe in Remenui:_ Streem. La*o. or Tide Geuge
, Hf*to*ol / _ _ Concreoon*, Ht*«« CaioedopX __ High Organic Content in Surface Laver in Sendy, Sulfidio Od r _ Organic Str*e«ing in Sandy Soile, A«M M ctur* R*guna _ Uotod on Lae Hydrie Soil* Li*t
Condioons __ Luted on Nooonot Hytfrie Soilo Li«tor LavrChromo Colon __ Othar (Eniam in RenwUt
Praiic=.'Site: /7 -V A '*VAnnlieant/Qwnen farv srt Sa u »>V
Do Normal Circumstances exist on me site? Yes Q*o)Is me site significantly disturbed (Atypical Situation)? (?e$ NoIs me area a potential Problem Araa? Yes (No)
(If needed, exolam on reverse.)
Date: 8 /&/?*County: / ^ ^State: _•*,£
Community ID:Transect 10:Plot ID:
VEGETATION
3omt»»e»»T •l»«f Soecte« Stratum Indicator
1. -S/vl-ftwr rw>'«<u M /ftfti-fi2. <fo*cAf 'eMttw # Ffc»+-3.4.
5.
9.
7.1. " " "" -" - ' -
Percent of Dominant Soeciea tnat are OBL. FACW or FAC(excmoing FAC*). „
Remenu: 2 '«AU*-X--/S6i*:'t,X ~&S.*&*
Oe*T«tner<r »»«"r Soeciev Stratum "«dtetfer
s. •10.11.12.
13."
1*.
IS.
IB. ' "' —
.-.• . ' .-•-;:•, -.. - - ———
•
HYDROLOGY
, Recorded Oata (Oe*cno* in Remenul:___Str»*m, La*a. or Tide Geuge_ Aenei Photogrean*
\s* — _ OO»*rA No R*cttrd*d Oeta Aveilabla
ne*d Cbaerwoom:
7Oeotn of Surface Water <— S (IrU
Oeotn to fn* Water in Pic /V ~ (inJ
Deotn to Summed Soil: X*vT (InJ
Remareo; " -11 -'• ' • ' • -" '~
Weoand Hydroiegy Inoieaton:Pnmary Indicator*:
_ inundated_ Saturated in Uoper 1Z tncne*Water Menu
_<i_ Onft LJnee
^^C Orainege PeRem* in WetlandsSecondary inoieatar* (2 or more r*duiredt:
__ Ondized Root Channel* in Uooer '1 Inen**___ Watar-Stamwi Laava*
Local Soil Survey Oeta. _ ( FAC-M*UV« T*«t
Omer (Exstain in Remarxjt
AR000360
SOILS_____
Moo Umt Nome(Senea and Phe*ei:__________________________________ Onwiogo C««
RoM Oaaervaj_T«onomv tSuogrewl:_______________ _________ . - Connim M*Wed Type? Y.o N
Oe«eriBiiimOaow Momx Color Moot* Colon Mom* S Tenure. Caneroaons.SSSSS3L M7*It" (Mun*** M«»«Tt o+j*** MoMtt A&uf-a.- Cgmtett 8tr--rui"i. «te.
Hydrio Soil
Concreoon*. __ High Orgarva Content in Surfece Layer in Sonav So**
Do Normal Grcumstances exist on the site? Yfis No)Is ma stta significantly disturbed (Atypical Situation)? (£e£ N£»Is me araa a potential Problem Area? Yes &)
(If needed, exolain on reverse.)
Date: «4/*>County: / ' / <-State: /%D
Communitv ID:Transect ID:Plot ID:
VEGETATION
1.^_ S rratum In i afor
»JT // ft
3.
6. tfT.me.
Severe* Stratum '"aiearor
10.
11.,'*-.13..
14.
/y
IS..
IS.
Percent of Dominant Soeoe* mat are OBl_ FACW or FACtexouoing FAC-)._
Hemanu: ---—/£./-<,-
HYDROLOGY
__ Reel
S\ Ho*
Se»d Ctt
Deotn
Oetnn
Davtn
tided Oota (Deecnoe m Aemerui:_ Stream. I_*K*. or Tide Ceuge
AeneJ PhotograeneOmer
acomed Oata AvwIaOle
aerwuon*:
of Surface Water ( finj
to Frve Water m Pic /"/I finj
to Saonted Soil: -- fl/A (InJ
Wetlend Hyaro**gy Inwcetor*:Pnmery Indicator*:
_ Irkinoated_ Setui *t*U in Uoper 12 Inert**_^ Weter Menu_ Onft Unee___ Sediment Oeoonay£ Ononeg* Pattern* m Wedandi
Secowary Indteaiort (2 or more reouiredl:Ondiied Root Channel* in Uooer '• 2 Incne*W*ter-St*o*d Laeve*Local Soil Survey OatJ
Soila frveenc/ Yeo No — la tree Swncwng PoiM Wltfm o Weflond7 ** No
oy
flR000363
DATA FORMROUTINE WETUXNO OETHHMINATION
(1987 CCE Wecanos Deiineaticn Manual)
P reject/Site: ts-Xn l/A4*&/Aooiicant/Owner r y-v-X /"oWKvInvesticatort £%*)£ / £?ft
Do Normal Circumstances exist on me site? Yes <Sg3Is tne site significantly disturbed (Atypical Situation)? <YeJ NoIs me area a potential Problem Area? * t^i ^es ^-^
Do Normal Circumstances exist on tne site? Yes <tfoIs tne site significantly disturbed (Atypical Situation)? Yes) No,Is me area a potential Problem Area? Yes <rto
(If needed, exolain on reverse.)
Date: £/6>/?t>County: jfafc rd-State: s*-£>
Community 10:Transect ID: 'Plot ID:
VEGETATION
*»*tr Soec»»» Srr_n/m Indicator
a..4.
S.
7._
I.
Depr«ine»r **»f > Soeetf- Stratum n->d>eater
3.
1°-.11..
12-.iav14.
IS.
Percent el Dominant Soecie* met ar* OBL, FACW or FAC(••ouding FAC-). __
Romanes: -—r"T
HYDROLOGY
R*c«
^ NoR
mod 0«t* IO**cno* m Remenul:Stream. Lax*, or Tide GaugeAenal Photegraan*Otfter
ecoraed Ooca Av ilaBla
Se»d Cbcervooan*:
Oeotn of Surf*c* Water £X finj
Oeotn
Deem
to Free Water in Pic A finj
to Sflwnned Sail: & n (InJ
Weoend HyonMogy Inaicaton*Pnmary Indicator*:
_ Inundated_ Setunned in Uooer 1 2 Inene*__ Weter Menu
Qnft Linea_ Seoiment Oeooeia< Or»_nage Pen*rn» m We derma
Secorfoery Indicate-* (2 or more recuirec):_ OadUed Root Channei* in Uoo*r ">Z Inene*__Water»SUmed Leeve*i> Loc* Soil Survey Oau__ FAC-Neutr** 7e«
1* tni* Semoitng Point Within o Wetfand? (J***) Na
ay nQufc>Cc
AR000367
-/ ->> (/-,
DATA FORMROUTINE WETLAND DETERMINATION
(1387 CCE Wettanos
Proiect/Site: £t*i£ v*.#bAonlicant/Own'cr: > -*6 , 3 -XvInvestigator /Hot- Sf-M /Do Normal Grcumstances exist on the site? Yes (N|>Is tfie site significantly disturbed (Atypical Situation!? X»O NoIs tne area a potential Problem Area? -Ycs /fJo)
(If needed, exolam on reverse.)
Date: g/sfaCounty: jfa-£r<fState: /KJ>
Community ID:Transect ID:Plot ID:
VEGETATION
Srr*njm Indicator
1..•
3._
*.a
5.
7"
7.
Oerrtnefff ***"r 3o*c*rT_________ S rr*tum
a. £*£<«10..11.
14._
IS.#
18.
Percent of Dominant Soeciea met are O8L. FAC// or FAC.' (excluding FAC-I.
&/ */
Remenu:: ,p_
HYDROLOGY
_ _ Recorded Deta (Devcnoe in Remanu):_ Streem. Laxa. or Tide Geug*_ Aenei Photograane
\/" _ OtherA._ No Reconted Oata AvwJeale
n«id Cb
Oeotn
Oetnn
Oeotft
•arveaone:
of Surface Water ( J finj
to Fr*« W*t*r in Pic ^ /**- (in.1
to Santnrced Soil: &— finj
Weoend Hydrology Inoicetors:Pnrnery Indicaiar*:
_^ inunoaiaa_ _S«tur*teo in Uoper 1Z Incrtee. _ Water Meru_^ Onfl Linee__^ Seoiment O*OO*IQ></' Oraineg* P*n*rm in Wetland*
Secondary Indicator* 12 or more reouirec):Oadiied Root Channel* in Uooar \2 Incne*
_ Water-Stoned Laeve*__ Local Soil Surwy Oata__ FAC-N*«tr** Te*T__ Other (Ejoilein in Remanca)
R n vc /?far sore #£ fa_ ^-r/fipe ,..-.,....*...... ,,;»•
RR000368
SOILS______ ___ __ ____________ ______________________________________________________________________________________ V i
Mao Unit NometSenee end Pheeoi* Wfj*** <s( Dnonege Caao:
Fieri Obiefveoen*Taxonomy tSuooreifOi: ______ . _____ Confirm Moooed Type? Y*e Ne
Mount Calor MatOe Colon Merge ' Tenure. Concrevono.
<-'//'7- r r?
'> isfczrt
Hydrie Soil IndieotonE
Concreoon* - ...—.> . . ™———— •„,.'Epioedon _ High Orgenm Content in Surfoo* Lover in Senov
On-onio Str*aeJng in Jangy Soilo ' ' ~", Aoioo Moiature Re me U««od on Ueol Hydno Soito U*tReduang Condioono Uotod on NOMM! Hydho Soilo List' Sloy d of UoerChromo Colon __ Other l&<p**n in RemerMl - -•
Remoncs:
WETUXNO OET-aMINATION
Hydnaphyoe Vegetooon Pweent/ \Y*} "* fdndelWedond Hydrology Preeentr* (V NoHyone So*le Pr«*ant/ C_ ^ "• 1* tn* Someiiiig Point Within o Wedand?
Do Normal Grcumstances exist on the site? Yea to*Is tne site significantly disturbed (Atypical Situation)? (X?* NoIs tne area a potential Problem Area? Yes <&D
Do Normal Circumstances exist on the site? Yes (tfg)Is the site significantly disturbed (Atypical Situation)? Yes <SS>Is the area a potential Problem Area? Yes (
(If needed, explain on reverse.)
Date: £fe/f(County: C- ' CState: y*>z>
Communitv ID:Transect ID:Plot ID:
VEGETATION
Sjr*~um Indicator
T3.
-5*5.
10.
12.
13.
14._
15.
Percent of Dominant Soeaee met are OBL. FAOV or FAC(ezeiuoina FAC*}. ... ,- '
Remanu: -
V
HYDROLOGY
i_ r Racoraed 0«t* (OeeenOe m Remantai:__^SweorTt. La-,e, or Tide Gauge
AeneJ Photegreoney^ __ _ Omer/\-_ No Recorded Data AwleOte
ne«d Cto
Oeotn
Qecnn
Oaotn
aarveaan*:
of Surface Wat*r ^ , (inJ
to Pre« Water m Pic finj
ta S«mnrt*d Soil: - /< - (inJ
Wettend HyonKegy Indicetor*:Primary Indicator*:
__ inunoated^ Seturated in Uoper li Inene*
__ Water Menu^ OnfT Line*_ SeaimenT OeooeitsV^" Orvnage Penems in Wetland*
Secondary Indicator* (2 or more reouireol:Oadixed Root Channel* in Uooer '.I Incne*
Xj^ Conentoonf _ ___ __ _ . , _. .: ._. ;/ ^_ High Orgofeo Cantanc in Surfaoe Lover in Sanr v
Oroonio Streaming in Sondy Soilo —— -.--•- -__ Uocod on Local Hydria Soilo U«T, Uotod on Nnonoi Hydrie Soilo List_ Other (Crpian in Remark*! _____ _ ____ L— -
•-.- —-v - -• .- ' -'-.-... . • .— »t :••» • -
. - . - *:v -•
No (Gftfol " ICre*No - ~ .No lo true Svnoiing Peint Within o Wedond? (Y No
TTe V f 4
flR000373
DATA FORMROUTINE WETLAND DETERMINATION(1987 CCS We can as Delineation Manual)
Hydroohyoe Vogwnon Prwam/,'. fci> No ICrrtolWedand Hydrology Preeant/ ."/„" "Yeo NoHyone Sod* «Teea«/ ._. . . Yeo No —
(Crdel
I* tni* S«no»ng Point Within o Weflond? (YooJ N
AR000377
Appendix E
Ground Water Monitoring Analytical Data Tables
flR000378
tO HW g aoj >- ra• 3 «O |
3 0)< (E
O
O
c/)W « —-J en 3<? ? £2 < KO
O
OW en —
o 3o d d d " d d d d " d d d d d d d d o " d d d d N " d d o d d d d c }s 5 o:
oa
otoLOV -> K•-93• >. (fl5 ro a)O 5 cr
O
« s:T- en
Q D D r 3 D D Z 3 Q 3 Q D D D Q D Q
GO CO CD CO o to CO CO CO QO <O 4 CO „„. CO CO (0 (O fsj CO A CO (O lO'"o ooo^ ^ o o o ^ o ^ o 0 0 0 0 ^ * 0 0 ^ * 0 0 0
D
*f^ ^*^__. "^'TT-^, (Q^^^co1*^^ —. co t o ^ f*i fo ^ M f > _ _ ^ ^ r ^ c o c o_• ^ -j _• CN _• ^• _- *\ CN :=; • _• • I* ^: ^ CD ^L CN _• _j - —; CO lO - _- • _- _- -O O 3 O O O " O O O ~ O O O O O O O O O O O O
DI3^Z)Z3Z>DDDZ)ZJ^D3ZI^3DD^33^ODZJDDD^^=)I3
UJtrQ oi —
"-f ^ ^ ^ . ^ " ^ c o ^ t O ' i c o T r ^ - f t o f o ^ r p f o - v c o c o v c o t o ^ r r - c o c p c od d d d d d d d d d d o d c i d d d d d c i d d d d d d d d d'? < o:
oODZ)=J=)DZ3=)=)DZ)ZiD=)r33D
QV3 m —
10 r - ^ ^ co r co TT co ~F *& co co co co co co ^ co <o r - co co coo d d d d d d d d o d c s d d d d d d d d d d d d d d d d dS < ceo3 D 13 D D
~ g^COTT^ C O C O ^ ^ ~ T ^ C D ~ f C O f O ^ C O C O f O C O ^ h ^ C O C O O O " " " "
o d ^ d d d d ^ d d d d d d d d d o d d d d d d d d d
ZJZ)DI3 D D D3D3 3 D D D D D D D I3DDDDI3I3
^- •"-•«•_. r) -f -f ». eocoto o d o o d d o o o o o o o o o o o o o o o o o o o o o
*
-5m o zt uj Q co
AR000379
•1Olo>O)
X
CQLL1
OCCLL.WLU_JQ.S<COOLUJ
Q
uo>OLOu.to
toUJo:
o
UJUJ
CQ<
in
O
"?
g
C/lCO
f
i
— jQW•^S
CO
-j4jO
CO
o
_,QCO
O
<os
aen s
ra 0)5 C£
O00(71en =:
o:
o
>. f>n 01s o:
a
9 3? £< oi
o
S 35 S< K.
O__
T ro a>5 a:o
ta s
? £< K
o00 =
1 I< a:
-Ja>3
W
ro
3
3
o
3
.d
3
cod
3
^d
D<jd
3
coo
3
d
omethane
In
3
3
CM
3
T~
3
ind
^
G
r-
i-
Chloride
•?.cS
3
3
O
3
r-d
3
r~
3
^d
D,d
3
-
3
d
omethane
gm
3
3
CM
3
COd
C\J
in
3
CDd
CD
0n
fSn
3
3
3
CN
3
~
3
CM
3CM
3
*
3
CM
1
3
3
3
.d
3
COO
3
^O
Dj-d
3
CO
3
d
ichlofoethene
2
3
3
3
COd
3
CDO
3
cod
mood
a
en
O
d
ftene Ch
loride
«
3
3
-ro
3
00o
3
^d
Dj-d
3
oo
3
d
m Oisulfide
£
3 33 33333333333333333333
3333333333333333333333333
d d d d d d d o d d d d d d d d d d d d d d
3 333 333333333 33333
cot-r <o co co^coco ^co ^^.cotocoo d d o d d d d d d d d d d d d
O3Q3333O3O333333333Q33333
<0»a>eO CD ID < D « l D < D t N » < 0 «> CD(D(D*° '* *** d d c> d d d " d d d d ' - d d < 0 d odd
3 3333333333333333 33333
o,rrj.-<rcofO— -co co-rcoco TTCO Tt-r^cococot D ( N " o o d d d d d d < N d d d d l D d d < * > d d d d d
3 DDZ) 3333I33D O DZIDODTfc\if^-fOTTTtO^-^»-'Vtr)cNJCOTr«roc£ier>roo3^j-h.coc»3cr:"~ '~dddw d d d d d d d d d d d
Q3Q333D3OQ3333333Q3O33333
n_«-t> o o e o o o ' D _ | l i _ < D ^ ( O o o t o c O c M . n t o . o c o ^ ' D e o ( pOJ CO Q Q [3^ W o ^3 O CD O O *"" O O O O C
3 333 3333333 3 33333
c N r " c M d d d S M t D ' ° d t N d d d d < o i n d u : i d d d d d
^T c cS (D 9J » o no _. c ® ]R ^ A* ^ ^
s ¥ if s |1| | ii si 1!.! In i i II LI in JiHIiHiimMii!! lit «i£2m2z-;|§|_|Sili-§|^;z|ll£l|.i-
i
i
*h
. i
'• 'I
i
c21 «-> P(A .>»
fi CO
2 g Q11 «?2 .
"O S1 T3 2 fsj
o * ° 2« J E o 13 'is o i £
-j rs n co -J£ o T32 ^ . P n * B<a t. * | -| t3 • :5 £ * i •" p •fl) i_ "P B 'O — n_ OO l D W - l S S - r i ^ O .
UJ^^-JB g^OliH = c S « 0 - s 3T3a<iDce:^-gD t.-4"O " " » " " a IIm o 3 at o CD . .
j
- ^
flR000380
o>
O
LUCCO)3o
5O
op
O
CD2O
,O
UJo:
o
r-
O
up
O
to2O
O
2 reo
0) "3
< cc
o
at 33 *< CC
o
01 "3CO Q)
a
en 3
< £ao
O) ±:01 3
(U 012 CC
oco ±:01 3
3 1)< CC
O
to sOl 3
< a
oOl —CT) =
n u3 CC
O
00 =CT) 3
< K
3"&3
n>
3
3
-ro
3
O
3
-fo
3
O
3
3
O
3
O
3
O
3
O
3
O
[Chloromethane
3
o
3
m
°3
mo
3
o
O
3
3
mo
3
ino
3
mo
3
ino
]Vinyl
Chloride
3
3
r-O
3
O
3
O
3
o
3
3
O
3
N.O
3
O
3
O
3
N.O
[Brotnomethane
3
3
o
3
-ro
o
3
3
•cfO
3
O
3
O
3
o
[Chloroethane
3
3
3
3
3
3
3
3
3
3
3
[Acetone
3
3
-ro
3
-fo
3
o
3
O
3
3
o
3
O
3
— fo
3
o
3
—ro
|l.1-Dichloroethene
3
3
COO
3
coO
3
O
3
coo
3
3
coO
3
(OO
3
COo
CQ
coO
3
coo
[Methylene Ch
loride
3
3
Tf
O
3
O
3
-ro
3
TTO
3
3
rro
3
O
3
O
3
O
3
O
[Carbon
Disulfide
3333333333333333333333333
d d d d d d d d d d d d d d d d d d d d d d
33333333333333333313333333
c o v t o ^ t ^ t c o c o ^ e o c o T f c o c o - r c o c o - " r - ( O c O c od d d d d d d d d d d d d d d d d d d d d d
3333333333333333333333333
d ^ d d d d d d d d d d d d d ^ d d d d d d d d
33 3333333333333333333333
d r g c s ' d d d d d d d d f s l d d d d ' D d d d d d d d d
3 333 3 3333333333 33333
d t N " d d d ' ° d d d d ( S ' d d d d < D d d d d d d d d
33 333 333333333333333333
3333333333333333333333333
o o o o o o o o o o oooo o o o o o o o o
3333333333333333333333333
d ^ d d d d d d d d d ^ d d d d d d d d d d d d
3333333333333333333333333
d ^ d d d d d d d d d ^ d o d d ^ d d d d d d d d
3 333 333333333 33333
co-tf-r coco co— r c o c o ^ - v c o _ — r h - c o c o c of o c > ' ^ o o o 0 ^ ™ o o ™ o o o o u ' o o 'ooooo
I3U 333 333333333333333333
co f o i » - * c o ( o ^ c o c o ^ ' C O c o i v c o < o ^ ' f ^ ( O ( o t od d d d d d d d d d d d d d d o o d o o
. f Il» sill Ii J 1£ S £ ° 1 S l i S - g S S S S1 I 813 S||l| I| i 1 8 .=• 11 s !j_| ^ o S f v i a J g g | i = f 2y S .a "s i" S-- 8 6.yS£co c *f 17 s S ^ p S s e "5 *x039 g , •§ 9 =^9 E w ^ g g w, » 2o5">.S £ E
"cE3 .2i tnc co
si „*. o CD
•0 g1 B S CN
£ S -5 E ow .2 c g_j "5 £ "o 8
S ° e £ a> «« "S 2 § 5 1
*""" ^ TI "SO Q) W TI ® f^ — *» O^sg.1^^2"
•§ " ii M « ii :? iiCD o 3 LU o CD . ;
AR00038
>-
Oz<ooO)O)
u.O
ICODmUJx
o
Occozooo:ou.
DWUJ
zCD
CCf-
0.3
CO
S5
CM
<
^__
<UJ
^
UJ
Q.3nSo
sre2
2
Ol
i
Ol
ra2
2
en^<
_jo>_0)
"toc
O
-
0>a:
o
cc
o
so
tr
o
o:
o
tr
0
3ff,(£.
3
O
3
O
3
O
3
o
3
0
3
CJ
~>
Sra
O
3
O
3
O
o
3
0
3
O
-1
.o
(Vinyl Chloride
3
O
3
O
3
O
3
O
3
0
3
O
->
8CO4>
m
3
o
3
O
3
O
3
O
3
O
-)
o
tChtoroethane
3
3
3
3
3
3
~)
(Acetone
3
o
3
0
3
O
3
O
3
O
3
o
~)
ra
o
|1.1-Dichloroe(he
33333333333333333333333
d d d t N o o d d d d o d d t ' g d d o o < D d d d d
333333333 3333333333333
d d d ^ d d d d d d d d d ^ d d d d ^ d d d d
O)3 3333333333333333 333
d d d d d d d d d d d d d d d d d d d d
CD3 3 333 333333333 3
d d d d d d o d d d d d d d
33333333333333333333333
o d d d d d d d d d d d d d d d d d d d
33333333333333333333333
33333333333333333333333
co-rco -r<o-~-r-rcoco-*ro c o v c o c o vcoco-,d d d ^ d d d d d d d d d ^ d d d d d d d d
3 a) * $ a>o c ® ^~ ^ ^0 03 ID fO ~c 0> C £ Q O 9" ™ 0)
iilJPII| lllll I l g l l l i8*s8|i.ti^i.i|Si*.2j§lIIIt g f i i i i l s f i g i j B f A i T ^ S t l S aJ|9i5 s-. |9 g!9 i 1 7 5 g^-lsls^-^a^tp-E'-se'ii-g^.e? «€ S -. T » 2 sSo^'cM^-O'-O'-aSt-'-eD-voi-is^cNh-ooiiJ
3333
o o o o
3333
oooo
3333
o o o o
3333
O O O O
3333
o o o o
3333
3333
f. CO CO COO O O O
1
Ixylenes
(tota
l)Istyrene
jBromoform
|l.1.2.2-Tetrachl(
_;
i*5 «E T)
1 sf g Qll "?3
« C 2 CN(i ffi " Cv •"•- c ™ E o!|| ||
-e ^ g ™ "c O "O-P jl F m ^ ffi
"5 5 * £ -° 8 *;"g ~ £L gI 3 Q aoT O 5 ^<y L^ i£ (1
5^eM5™^i.,.-->l't'§8g1-CMW,t|T_(0£3, f ^oOin J J ^ c o c M d M* * co
333CD33 ^3^ L1J CD3CD33 D33
S — 5 S S | » 5 - 1 S 1 o g» s . , | , . .,
333C033 333 3 (D3CD33 3Z)D
§ ( - j
- d - r - i n m ^ g B ^ i f t S t M ^ S - t o ^.rt^^rM _ , S c M 0 i n £
C D C D 3 C D D 3 3 3 (DllJ CD CD ?33
S^cMS^^S^S-nl-liS^g.-i^co-co- «°°o o, o^cg^o ^ -
3CD3e033 3 3 CD CD3 33 333
•OtM.flg CJ> 8(0°g'- ° S
»ooo -- «^SSo S -
E E S e^ c E ^ D 'IAC?*. 3 £ c §J" | * 1 1 E s. s a i" « s l | =
S'C c*13Ji(CJj &c S m S'cSsiT!'0*'^5<5mfflcjUOOO^*223:zo.^cocSK>N
?i/iiIO«oinEgcoo"5ow
15c
CO
5u"«
g 2
IIIel* o Oc el) in•=0.^3•5 « ro
C OJ
S & S"V !/> -n .0 p «
Q — O E
5 a> E c _| n 5 £ -
•o ™ g « « 8S "^ rtf QJ C
1^ 1 1 « £"fjj aj n> *_ o S
y I A i * i f5 £ i ! » .a s gq> w Tj * ' u> " Sy s 51 • * .E* S sLU TO "5 t5 3 S
TE It II ^'1 "O
m 0 3 c , ii!i 5 ."^
i", ;
• i
" ii
't
"• f
. -»
. - i
.-:
' T
'i !•. *
r
, )
flR00038i*
to3O3^_f
[EQZ
rjUJ-J-J>XCO3COUJXh-sotcu.COUJ
CL
«tCOCCUJt—
1Oz3
CCozCO-JKLUSCCou.CO
o._ en =*£ >- «< ID ff
^
O
> *• *"UJ 2
O
£J 01 3•i TO SLJ 5 a:
oOl —a °?
3 >• ">° 5 cr£
O
0 =
^ =- "w ifr
_j"a.
Anafyle (m
333CDD3 ^b13 muj C03CD33 33
<— CM) ^ t - ^ ^ O 1 ^ ^j ONJ
ED^^Q^O^ ^^^D fDLU O CO CD ZH ^^^>
» n C M « > g 0 CO^gcT."^.,, g ^
^ ^00^ •- rvCM--,.;^^ ^ "~
m £ D 3 t O 3 3 3-3 CDUJ C D 3 C D £ n c O § 33
— ° S S ° « M e D °
-— 10 •— ^ *~ co
33DCD33 3D3 UJ 33CD33 333
t o - f M S t M l o S ^ 0 - . P o S g 2 L O S c N ^ S _ ( 0 C Nc*>OC>0i ^ 2 in^O "O to
CDCD 33 333 UJ DD COCO <333
° ° ° O rt O °j5{J!»SeMcogfl.f^ir,g--5o2ing":'-g^rtcNkn m IN r->
E *
llllllilllillllllillili
un, EV oC O o
co o 3t: = •££ o o^ v </>
°^Ss.i|ill0.-° S •*— o £-J o o m =
giill"2 q, o |g o
o J ? c "I Zcu Q a; -2 —•5 CD — g i2 o> - 6 c oO > « "J S c
O 3 m -2 "5. S .w^ i_ H 3 C CD >»« 5 co •= o a> co^ ' • *i "^ "3 CV ^ T3 * I/) Q. CD4) CL> el) I QJ ty i*- y oj cw co -5?UJ "S 16 p S -^ S" O rf Q) O C Q^"O ' jv Q. ™ 3
m03q uj5 ?£*
AR000385
Q
ooOJOJ
J-coO
LLQ
LU
XCODCD
COLU_JQ.
coa:UJ(_IQ SZ 01
w2UJXo
o:UJzUJooroI-COUJ
zcoLJJUJ
a
CM OJ ®1 C/J | "iS Q
^ CO >>-5 co-'i2 g• co
ai OO -~<^ co 9 3S CO 0) g0-* K.
O
o> <-<? C) <? 3
o-1!^O
00 *;^0935^3 g1®
a, -J Ol —
O
OJ *-•7 CO 9 3
o^fir
o' _J CO »-T Q 9 3^ ^ i/J O) >i\r f/} TI ~j<-> _i < 0-
O
T- S =+ W™ 32 CO O) g
<a:
(U
"coc<
^
0835": °">T- o" d d ~v
=>
0 0•f CM •*- ,. o ••" oinCsjtnpr^oo P TTCD O O *"" *" O O O
V V
=>
0 °^~ ^~ — O CO^ T o P *- in5 ° o ™ d d
=> Q
o- CO1 —
O UJ
o o(« r*~ ^ — ff, CM *~ o*** D C3 ^ CO C3 C3
V V
D Q
o .LO ^
• CO0
^ UJ
o^ T- T- _* O• ~ ° ^~ s10 d d dv
G" pCO §
8? il „O z 3" E .c =d 1* E g ry f1S^CD-~^"o)— J) Z .
"S§COytx"o)2tjc t ^% CJ rtj Cv C "^^ "^< < o K u- x £z co
ocoO>-^? o>
i •>. wLU -5 o;
oi CO ±;
s_3 °>g
o0> -
•t CO ? 32 w >• go -1 2 a:
O
• _J CO *-t Q 9 35 co 6) g
O
"T co 9 35^ rago-'^aO
i Ol *^CO 9 3
O 2
O
Ol *;*/ 9 35"i^ COjjT* £«f 1 fv*-* 2 °-
O
CO —
§1*2< K
1"ror~<
0 0 -,COCD»-OOI ^- =;,«^CMO^J^ 0 O1*?C M O O V C M O I;COV V 0
»"* T* h * C\l « " h. ~ LA ** *~ f* - ^ /*\ — f f ftl
Z>33Z»^23333Z)=)DD3Dr>30D
• ^ • u i r » ^ f _ . ^ ' C o ^ r o ^ 1 ^ ( O ^ 9 i ^ i ^ t i c o c o ^ p j _ ld d d d d d d d d o d d d d d d d
DZ)ODDZ»IDZ)DDOOD3I33=)=>DO
•^•u»h*-^(..-»4'in'J^tu>e..-J fl-^-4-^PltO-^-t'i..d d d d d d d d o d d o d d o d d
=)DODD3DDDDZ)DDDDD3DDD
^•uji>>^_.^'C'J*9'e'j_,^i'CO^^i^fOP>^co_.d d d d d d d d d d o d d d d d d
Z)Z)Z)Z)DZ) 3DDDDDD2D33ZI3
d d d d d d d d d 0 1 o'o'ddc_c>c>ddN
^J• < " (D
«• S • * * 1a* « a « 1 _ « E^icS.c c £Q C " a m<_ •= CD to a « - F « * S- P -® » j: £ S -c J= S-S-c ? 2 o c111! Illlilijll iliiE #; E 3 *-F« c"Sc-S£,^ c*S c £'S:5 ?*S-isSiSf|S|Ql£|Silolf2 > » S £ B D ' — - E ' 3 - £ - - f i « Ho" 5 2.E2S S'-« *"*?*-^». *w. *•£« 2^o>aiO<^-5O*-cM*-o^O^-(5f-'r-cDt
P ^ h - « J ^ . O h - C D O ) t n < D C B (Tl^ij r*- UJ tu ^ WJ P* wj
h-h.(DK0r^eocneoir)h.h-0
h- o in o
O J O J c o r * - ° c o a j » a > l ' ) h - r - . O J
D3DI.3D3DI30D3D
to v co co ^ to t'> ^ r^ w w ad d d d d d d d d d d d
DOD3ZI=)=)DDZ)=)r)^
CO ~t vO W ,_ T CO CO ^ - C"l CO (*Jd d d d d d d o' d d d d
DZ)Z)Z)DDDDDZ)Z)Z>D
to " co co „, co (o f o) co cod d d d d d d d d d d d
o'o*oo**Dooodddcio
» »A E cJ£ a> o Q2 8" ; « £8- B-S fflf sc- 1* * P 5O O • ® S m ~Cg Z£ £ g g s=- o•^ - U o a < D ^ ( D c ^ Sf 9-=*gJcIl. §"3
'T~ 3 ^ » ™ ^ O O ^^ A k. %* ,A TC — ^v i^ ** ^S ^S F «^ ^^ O ^_
a>m.0a.3O
^ sen Q.x «•5 .ss 5II „
§s> s
•o0
oT§
*•*o •?
Q =
Qualifier
U = Analyzed
for but n
VBLK
= Method
Blai
AR000390
00OJOJ
CO
u.o
XCOoCD
OccLLCOLU
CO
dXI-oo
DO
ccUJ
Io•z.oXoccou.CO
COLUCC
gtLUUJ-Jm
OCO _O *;« M\J tO
a
§ 1
oo ^5U <D
O
Q _2? 3UJ (Dcc cc
oCO «r
UJ §
i<DS.ffi
^ °>
CN OJ O CM
2 :: <o £
i- *- O •-1 J I .
»- »- O OJ
Chloromethane
Vinyl Chloride
Bromomethane
Chloroethane
(D >•. Ow en ,_
*— <- . oCM °>
^ (T. OOJ °> T-
N m OCM m -^
1 Acetone
1,1-Dtchloroethene
Methylene Chloride
o *-
» °
*•* OOJ ^
o *-* ^
O r-
I Carbon Disulfide
1,1 -D
ichloroethane
CDCM
mCM
CM
(OCM
COCM
|2-Butanone
CM ° ° °*
N 2 2 »
o o o oCM T- T-
OJ »- O OCM •- T-
i- *- O OCM »- i- »-
_,
1,1-Dichloroethene (t
olaChloroform
1 ,1 ,
1 -Trichloroethane
Carbon
Tetrachlorkle
«•* O « O «••OJ ^ OJ ~ O)
•Vh f ^ ^ ^O) Jl OJ Jl OJ
OJ ~ OJ OJ
S 2 o> 2 o>
o o w o 0
1 ,2-Dichloroethane
Benzene
Trichloroethene
1 ,2-Dichloropropane
Bromodichloromethane
»-
s
oCM
CM
CM
|4-Methyl-2-Pentanone
h- CO
OJ 0>
OJ OJ
OJ OJ
OJ h*
lcis-1 ,3-Dichloropropene
fToluene
(D N.
<O OJ JQ
CO tO (
* CM
<D r*» S
*
ltrans-1 ,3
-Dichloropropen
11.1 ,2-Trichloroethane
|2-Hexanone
h^<DOJO)rR0>^O)
r o c o o j c o ^ c o r ^ o j
h ^ c o o j o j ^ O J r ^ c o
a
Tetrachkxoethene
Chlorodibromomethane
Chlorobenzene
Ethybenzene
Xylenes (to
tal)
Styrene
Bromoform
1 ,1 ,
2,2-Tetrachloroethan
feo•o
Q = Quaff t
orU a A
nalyzed for b
ut not
VBLK
= Method Blank
I
flR00039l
TABLE E-5
Site: Bush Valley Analyst: Mark RostafinProject #: 61131.01 2C07 Analysis Date: 5/5/99-5/6/99Calculated By: Mark Rostafn Checked By: Sandy Staigerwald
GM-9 and GM1 -LSS nyarogen resets not avanaoie oecause aepth 10 ground wateruse of peristaltic pump
AR00039I*
EA LaboratoriesANALYTICAL NARRATIVE
Client: EA Eng., Sci. & Tech. Inc. Laboratory Project Manager: Natasha K. SullivanSite: Bush Valley Landfill EA Laboratories Report: 981407Project number: 60957.46__________Date: 8 October 1998________________
This report contains the results of the analysis of twelve water samples collected on 25 and 26 August1998 in support of the referenced project.
SAMPLE RECEIPT
The samples were received by Federal Express at EA Laboratories on 26 and 27 August 1998. Uponreceipt, the samples were inspected and compared with the chain-of-custody records. The sampleswere then logged into the laboratory computer system with assigned laboratory accession numbersand released for analysis.
Client Sample Pesienation EA Lab NumberGM-8 9810467GM-9 9810468GM-6 9810469
GM-l-LSS 9810470GM-7 9810516
GM-2-LSD 9810517GM-5 9810518
GM-4-LSS 9810519GM-2-LSS 9810520GM-3 9810521
GW-DUP1 9810522TRIP BLANK 9810523
Following this narrative section is glossary of data qualifiers (Table 1) and the original chain-of-custody records. Analytical results and quality control information are summarized in the appendeddata package which has been formatted to be consistent with the deliverable requirements of thisproject.
QUALITY CONTROL
The following sections are ordered as the data appears in this report. They contain observationsmade during sample analysis, summarize the results of quality control measurements, and address theimpact on data usability based upon project Data Quality Objectives. For each fractional analysis thenarrative includes:
• Sample chronology: This section summarizes the sample history by fraction including the samplepreparation method and date, analytical method, and analysis date. Anything unusual about the
AR0003950 \0b0v
EA Laboratories jANALYTICAL NARRATIVE
Client: EA Eng., Sci. & Tech. Inc. Laboratory Project Manager: Natasba K. Sullivan ISite: Bush Valley Landfill EA Laboratories Report: 981407Project number: 60957.46_____ ____Date: 8 October 1998______ \
samples, digestates, or extracts is identified. Holding time compliance is evaluated in this section.
• Laboratory method performance: All quality control criteria for method performance must be met Jfor all target analytes for data to be reported. These criteria generally apply to instrument tune,calibration, method blanks, and Laboratory Control Samples (LCS). In some instances where jmethod criteria fail, useable data can be obtained and are reported with client approval. The *narrative will then include a thorough discussion of the impact on data quality.
• Sample performance: Quality control field samples are analyzed to determine any measurementbias due to the sample matrix based on evaluation of matrix spikes (MS), matrix spike duplicates(MSD), and laboratory duplicates (D). If acceptance criteria are not met, matrix interferences are Iconfirmed either by reanarysis or by inspection of the LCS results to verify that laboratory methodperformance is in control. Data are reported with appropriate qualifiers or discussion. ,
VOLATBLES by GC/MS - WATER (EA9810467 - EA9810470, EA9810516 - EA9810523)
Sample Chronology: Twelve aqueous samples and associated quality control were analyzed on 27,28, and 31 August 1998 for the client-specified list of anaiytes by USEPA SW-846, Methods5030A/8260B, using a 25mL purge volume. All holding times were met. - ?
• Samples GM-9, GM-7, and GM-2-LSD were reanalyzed to confirm matrix effects on surrogaterecoveries. "
• Samples GM-4-LSS, GM-2-LSS, and GM-3 were reanalyzed at two times dilutions in order tobring the concentrations of volatile compounds within calibration range.
• Daily matrix spike/matrix spike duplicates (MS/MSD) were analyzed with each analyticalsequence. :-
, i
Laboratory Method Performance: All laboratory method performance criteria were met for thereported sample with the following exception: *
• The continuing calibration verification (CCV) standard for the 27 August 1998 analyticalsequence had the relative response factor (RRF) for the System Performance Check Compound(SPCC) 1,1,2,2-tetrachloroethane below the method acceptance criteria of 0.300. This is acommon problem associated with analyses using a 25 ml purge volume (the method does notdifferentiate acceptance criterias between a 5 ml purge and a 25 ml purge volume). The . ,laboratory's standard procedure is to reference the CLP low concentration volatile methodOLC02 (which is a 25 ml purge volume method) which has an acceptance criteria for this SPCCat 0.100, The response in the CCV is well above that criteria. Data usability should not be : ,impacted.
Sample Performance: All quality control criteria were met for the reported samples with the following *Jexceptions:
AR000396
EA LaboratoriesANALYTICAL NARRATIVE
Client: EA Eng., Sci. & Tech. Inc. Laboratory Project Manager: Natasha K. SullivanSite: Bush Valley Landfill EA Laboratories Report: 981407Project number: 60957.46__________Date: 8 October 1998_________________
• Recoveries were below the lower QC limit of 88% for the surrogate toluene-d8 in samples GM-9(79%), GM-l-LSS (79%), GM-7 (77%), GM-2-LSD (78%), GM-5 (81%), and GM-3 (83%).Recoveries of toluene-d8 in the reanalyses or dilution analyses of the samples (or the MS/MSDperformed on sample GM-5) were similar, confirming the matrix effects. These low surrogaterecoveries may indicate a low bias for some compounds in the samples.
• The MS/MSD performed on sample GM-5 had the recoveries of toluene (71%, 71%) below thelower QC limit of 77%. The MS performed on GM-7RE also had a low (72%) toluene recovery(the MSD recovery was within limits); and the RPD between the recovered concentrations oftoluene in the MD and MSD was above the QC limit of 13% at 25%.
ANIONS - WATER (EA9810467- EA9810470, EA9810516- EA9810522)
Sample Chronology: Eleven aqueous samples and associated quality control were analyzed on 26 and27 August 1998 by USEPA Method 300.0 for nitrate and sulfete anions. All holding times were met.
• Samples GM-l-LSS, GM-5, and GW-DUP1 were re-analyzed at 5X dilutions and sample GM-4-LSS was re-analyzed at a 2X dilution in order to bring the concentrations of target anions withincalibration range.
Laboratory Method Performance: All laboratory method performance criteria were met for thereported samples.
Sample Performance: AD quality control criteria were met for the reported samples with the followingexceptions:
• The MS/MSD performed on sample GM-l-LSS had recoveries for the sulfate anion (38%/41%)below the lower QC limit of 90%. These recoveries are due to a high native concentration in thesample.
• The relative percent difference between sample GM-7 and GM-7 DUP was 18% which is outsidethe QC limit of 15%. Q-,
COMETALS - WATER (EA98010467-EA9810470,EA9810516-EA9810522) CD
CDSample Chronology: Eleven samples were prepared (SW846 methods 3010/3020/7470M*) on 18-24 orSeptember 1998 and analyzed for TAL metals by SW846 methods 6010/7841/7470 on 19-30 «xSeptember 1998.
* modification includes the use of an autoclave in place of a waterbath.
Laboratory Method Performance: All laboratory method performance criteria were met for thereported samples.
Sample Performance: All quality control criteria were met for the reported samples with the following
EA Laboratories iANALYTICAL NARRATIVE
• i>Client: EA Eng., Sci. & Tech. Inc. Laboratory Project Manager: Natasha K. Sullivan > 1Site: Bush Valley Landfill EA Laboratories Report: 981407Project number: 60957.46__________Date: 8 October 1998________________ ']
. 2exception:
'1• The RPD of the aluminum duplicates (25.1%) is above the upper control limit (20%). i
GENERAL CHEMISTRY - WATER (EA9810467-EA9810470, EA9810516-EA9810522) T
Sample Chronology: Eleven samples were analyzed for the following SW846/USEPA methods. Allholding times were met. j
• c
Parameter_______Methodfl_______Prep Date_______Analysis Date ~—————————,-- T.iT.——————————————— f. ———————_—————____——————.___. _-——————- • -f
Alkalinity 310.1 N/A 3 September 1998 "*Ammonia 350.1 4 September 1998 4 September 1998 *Cyanide 9012 3 September 1998 3 September 1998Ferrous Iron SM3500DFe N/A 26,27 August 1998Hexachrome ASTM 7196 N/A 26,27 August 1998TOC 415.1 N/A 15 September 1998
Laboratory Method Performance: All laboratory method performance criteria were met.
Sample Performance: All quality control criteria were met with the following exceptions: -
• The ammonia MS/MSD recoveries (66%, 66%) were below the 75-125% control limits. Thismay bais the sample results low.
• The 27 August hexachrome MS/MSD recoveries (57%, 56%) were below the 75-125%control limits. This may bias the results low for samples analyzed on 27 August 1998.
CERTIFICATION OF RESULTS
The Laboratory certifies that this report meets the project requirements for analytical data as statedin the Analytical Task Order (ATO) and the chain-of-custody. In addition, the Laboratory certifiesthat the data as reported meet the Data Quality Objectives for precision, accuracy, and completenessspecified for this project or as stated in EA Laboratories Quality Assurance program for other thanthe conditions detailed above. It is recommended by the Laboratory that this analytical report shouldonly be reproduced in its entirety. EA Laboratories is not responsible for any assumptions of dataquality if partial packages are used to interpret data. Release of the data contained in this report hasbeen authorised by the appropriate Laboratory Manager as verified by the following signature.
8 October 1998Natasha K. Sullivan/Laboratory Project Manager
HR000398Ol
Severn Trent LaboratoriesANALYTICAL NARRATIVE
Client: EA Eng., Set & Tech. Inc. Laboratory Project Manager: Natasha K. SullivanSite: Bush Valley Landfill ST Laboratories Report: 990521Project number: 61131.01__________Date: 1 June 1999__________________
This report contains the results of the analysis of 15 water samples collected on 6 and 7 May 1999in support of the referenced project.
SAMPLE RECEIPT
The samples and one trip blank were received by hand at Severn Trent Laboratories on 6 and 7 May1999. Upon receipt, the samples and blank were inspected and compared with the chain-of-custodyrecords. The samples and blank were then logged into the laboratory computer system with assignedlaboratory accession numbers and released for analysis.
Client Sample Designation ST Lab NumberEA10 9904267GM9 9904268
Following this narrative section is a table of analytical methods (Table 1), glossaries of data qualifiers(Tables 2 and 3) and the original chain-of-custody records. Analytical results and quality controlinformation are summarized in the appended data package which has been formatted to be consistentwith the deliverable requirements of this project.
QUALITY CONTROL
The following sections are ordered as the data appears in this report. They contain observationsmade during sample analysis, summarize the results of quality control measurements, and address theimpact on data usability based upon project Data Quality Objectives. For each fractional analysis the
AR000399
Severn Trent LaboratoriesANALYTICAL NARRATIVE
Client: EA Eng., Set & Tech. Inc. Laboratory Project Manager: Natasha K. Sullivan • <Site: Bush Valley Landfill ST Laboratories Report: 990521 >Project number: 61131.01__________Date: 1 June 1999_________________
Mnarrative includes: \
• Sample chronology: This section summarizes the sample history by fraction including the sample ' 'preparation method and date, analytical method, and analysis date. Anything unusual about the isamples, digestates, or extracts is identified. Holding time compliance is evaluated in this section.
• Laboratory method performance: All quality control criteria for method performance must be met •Jfor all target analytes for data to be reported. These criteria generally apply to instrument tune,calibration, method blanks, and Laboratory Control Samples (LCS). In some instances where 1method criteria fail, useable data can be obtained and are reported with client approval. The ;»narrative will then include a thorough discussion of the impact on data quality.
• Sample performance: Quality control field samples are analyzed to determine any measurementbias due to the sample matrix based on evaluation of matrix spikes (MS), matrix spike duplicates(MSD), and laboratory duplicates (D). If acceptance criteria are not met, matrix interferences areconfirmed either by reanalysis or by inspection of the LCS results to verify that laboratory methodperformance is in control. Data are reported with appropriate qualifiers or discussion.
VOLATILES by GC/MS - WATER (EA9904267 - EA9904277, EA9904341 - EA9904345)
Sample Chronology: Sixteen samples and associated quality control were analyzed on 10 -13 May1999 for the project specified list of analytes by USEPA SW-846, Methods 5030/8260B, using a 25mL purging volume. All holding times were met.
Laboratory Method Performance: All laboratory method performance criteria were met for thereported samples.
Sample Performance: All quality control criteria were met for the reported samples.
ANIONS by 1C- WATER (STL9904267-STL994271) (STL9904273-STL9904275)(STL9904277) (STL9904341-STL9904345)
Sample Chronology: The samples and associated quality control were analyzed on 07,12 and 17May 1999 by USEPA Method 300.0 for the nitrate and sulfate anions. All holding times weremet.
The batch Matrix Spikes and Matrix Spike Duplicates (MS/MSD1 s) were performed on sampleEA-12, GM-7, and on another client's sample. All data associated with these QC samples isincluded in this report.
Sample EA10, GM6, GM4-LSS, GMS, EA-12, GM-3-LSS, and GM-7, were reanalyzed at a five
O\
Severn Trent LaboratoriesANALYTICAL NARRATIVE
Client: EA Eng., Sci. & Tech. Inc. Laboratory Project Manager: Natasha K. SullivanSite: Bush Valley Landfill ST Laboratories Report: 990521Project number: 61131.01__________Date: 1 June 1999__________________
times (5X) dilution, sample GM9 at a two times (2X) dilution, sample GM1LSS at a ten times(10X) dilution, in order to bring the concentration of analytes within calibration range.
Sample GMS was reanalyzed at five times dilution (5X), at a ten times (10X) dilution, and at atwenty times (20X) dilution in order to bring the concentration of analytes within calibrationrange. Sample GMS was reanalyzed straight, in addition to its dilutions, because of inconsistentsulfate results due to precipitate in the sample.
Laboratory Method Performance: All laboratory method performance criteria were met for thereported sample.
Sample Performance: All sample performance criteria were met for the reported sample.
Sample Chronology: Sixteen samples were prepared (SW846 methods 3010/302CW470M*) on 19-21May 1999 and analyzed for TAL metals by SW846 methods 6010/7841/7470 on 22-28 May 1999.
'modification includes the use of an autoclave for digestion in place of a waterbath.
Laboratory Method Performance: All laboratory method performance criteria were met for the reportedsamples with the following exceptions:
The original run produced high water LCS recoveries and high matrix spike and matrix spike duplicaterecoveries. The standard (M05756) was checked and confirmed the high concentrations of metals found.The confirmed concentrations are the true values used in calculating the recoveries reported on Forms 5and 7. The summary data for the confirmation will be provided in the data package.
Sample Performance: All quality control criteria were met for the reported samples with the followingexception:
The RPD recovery of the cobalt duplicate (25%) is above the upper control limit (20%).
GENERAL CHEMISTRY - WATER (EA9904267-EA9904271, EA9904273-EA9904275,EA9904277, EA9904341-EA9904345)
Sample Chronology: Fourteen water samples were analyzed according to the following USEPA methods.
Parameter_______________Method#_______Prep Date Analysis Date/Time
RROOOUOICMoro?
Severn Trent LaboratoriesANALYTICAL NARRATIVE
Client: EA Eng., Set & Tech. Inc. Laboratory Project Manager: Natasha K. SullivanSite: Bush Valley Landfill ST Laboratories Report: 990521Project number: 61131.01__________Date: 1 June 1999__________________
Alkalinity 310.1 NA 19 May 99Ammonia 350.1 27 May 99 27 May 99Cyanide 9012A NA 14 May 99Hexavalent Chromium 7196 NA 07 May 99Ferrous Iron SM NA 07 May 99Total Organic Carton 9060 NA 26 May 99
All holding times were met for the reported samples.
Laboratory Method Performance: All laboratory method performance criteria were met for the reportedsamples.
Sample Performance: AH Quality Control criteria were met for the reported samples with the followingexceptions:
• The matrix spike and matrix spike duplicate analyzed on sample EA-12, reported the followingrecoveries; for Alkalinity (50%/50%), for Ammonia (16%/16%), and Hexavalent Chromium(87%/85%) below the respective lower control limits of (98%), (73%), and (92%). SampIinterference was a factor to the low recoveries.
CERTIFICATION OF RESULTS
The Laboratory certifies that this report meets the project requirements for analytical data as stated in theAnalytical Task Order (ATO) and the chain-of-custody. In addition, the Laboratory certifies that the dataas reported meet the Data Quality Objectives for precision, accuracy, and completeness specified for thisproject or as stated in Sevan Trent Laboratories Quality Assurance program for other than the conditionsdetailed above. It is recommended by the Laboratory that thb analytical report should only be reproducedin its entirety. Severn Trent Laboratories is not responsible for any assumptions of data quality if partialpackages are used to interpret data. Release of the data contained in this report has been authorized bythe appropriate Laboratory Manager as verified by the following signature.
1 June 1999
AR000402
Otoo
Sampling Event One(August 1998)
AROOOU03
15 Loveton CircleSparks, Maryland 21152
PURGING LOGBOOK FORMGROUNDWATER SAMPLES
WELL ID &M-- i-SS SAMPLE NO.WELL/SITE DESCRIPTION
DATE & t 2* 1 73 TIME '!S55Z> AIR TEMP. -7 *
WELL DEPTH &amf XObfeff ftWATER DEPTH ' !• <i */7« ftWATER COL HEIGHT ftEQUIVALENT VOLUME OF STANDING WATERPUMP RATEPUMP TIMEWELL WENT DRY? ( )Yes p^NoVOL REMOVED (dall IL1PURGE AGAIN? ( ) Yes fyJNo
WELL ID £f 7> L5S___________________ SAMPLE NO. G-M -LSSWELUSITE DESCRIPTION g U UrL\Va.M
DATE P / l€ / *?** TIME 'SwtfteAgj- \ A*? AIR TEMP. Hj^— —— —————————. i-
WELL DEPTH <-'-t>____________ ft CASING HEIGHT _________________ ftWATER DEPTH T>*m__________ ft WELL DIAMETER H*_____________ inWATER COL HEIGHT ______________ ft SANDPACK DlAM. _________________ inEQUIVALENT VOLUME OF STANDING WATER _________...______________________ (gall (PUMP RATE .c.frs-W; **PUMP TIME _____________________________________________________ miiHWELL WENT DRY? ( ) Yes ( ) No PUMP TIME.____________________minVOL REMOVED _____________ (gal) (L) RECOVERY TIME _________________ mir ?PURGE AGAIN? ( ) Yes ( ) No TOTAL VOL REMOVED _________ (gal) (L)
Date TimeVolumeRemoved PH Cond Temp ORP Turb • Depth to
Water fromTOC Pump .<;
rv.oj, 0,01
5.C 5.7S
16.71 .65-7
K S.66 O.o .*>M ;.s n
II .S/as-? .i .7-32L (.4 K.it
IsC.O
' S
COMMENTS KA-rt-coqj_______^&|AU- tf. a i. h ^
&f ^ ^
SIGNATURE (7
SOP: 016, Revision 2 AROOQl+OS
15 Loveton CircleSparks, Maryland 21 152
PURGING LOGBOOK FORMGROUNDWATER SAMPLES
WELL ID <arftV£-l$b SAMPLE NO. Z-LStWELL/SITE DESCRIPTION &*KOotti2u LftiAK.'K
DATE *5 / "Z£ / 1 TIME >**A&»A (f) W&)*
WELL DEPTH "£*? 5 ft CASING HEIGHTWATER DEPTH
AIR TEMP. S5°
ftZH -S'5 ft WELL DIAMETER A" in
WATER COL HEIGHT ft SANDPACK DIAM. inEQUIVALENT VOLUME OF STANDING WATEPPUMP RATE ,A£-(KvK
t (aall IUtaDm» Horn
PUMP TIME <n^- iBHo minWELL WENT DRVOL REMOVEDPURGE AGAIN?
WELL DEPTH *& 9o r7*3*> ft CASING HEIGHTWATER DEPTH
AIR TEMP. 9 * .
^5» ft WELL DIAMETER * in ;WATER COL HEIGHT /A .7 * ft SANDPACK DIAM. In *EQUIVALENT VOLUME OF STANDING WATERPUMP RATE *• S
laal\ 11.1/anrrt
PUMP TIME min >WELL WENT DRY? ( )Yes WNoVOL REMOVED (aah fLPURGE AGAIN?
Date
efa
COMME
Time
/***1000
/0/1
/Oft*
( )Yes £X)No
VolumeRemoved
2-0 L
<Ao . ,-y. t
PH
. 5-.00
.,>7<;.o7
Cond
.03*f tJ ' *• V J
^V7•fe
PUMP TIME min.) RECOVE
TOTAL V
Temp
/1.22it.art-1rt.7
ORP
-SJ.7-S7-4
-**£>-£2.3
RYTIME min „OL REMOVED (c
Turb
7.6tf £/
fj. £
w
DO
SJI*v.ve,3.75.<*>
Depth toWater fromTOC
1.TS
?.*0
7.F/?.?/
»al)(L)
Pump ft *
.f / H.
*
" ,
•1
: .;
NTS JThJUW . pM. /*'*R^^i^* 'HA*n'CX*93
C 1
SIGNATURE &£&&&+ &*&&c/'4
SOP: 016, Rtvision 2 flROOO^OS
15 Loveton CircleSparks, Maryland 21152
PURGING LOGBOOK FORMGROUNDWATER SAMPLES
WELL ID <S*M 5" SAMPLE NO.WELL/SITE DESCRIPTION
DATE ? / 26 , % TIME 60 if
WELL DEPTH Z0r*- /?,/</ ft CASING HEIGHTWATER DEPTH
AIR TEMP. 0S*?
*~* ft9.913 ft WELL DIAMETER < « in
WATER COL HEIGHT ,£-*-*- S.tfo ft SANDPACK DIAM. inEQUIVALENT VOLUME OF STANDING WATERPUMP RATE
• foal, IL1(cmmi (Inm
PUMP TIME minWELL WENT DRVOL REMOVEDPURGE AGAIN?
Date
COMME
Time
07V?07.S'<G
P7jp/
07580£->ZSfi-
p«fe
Y? ( )Yes KfNo(aalHL
( )Yes (xfNo
VolumeRemoved
l.o L
2 •& LQ.0L,
&.**,
X.OL.jt>.£> U
I*ML.
NTS iCwkfc* <J«
PH
5.4 /S.ISS.L&5.703.-n.7«/C76
Cond
.3SS.3fe3.37J.3.37;-37S-.lfD2-
)PUMP TIME min
.) RECOVETOTAL V
Temp
n-7/d.V/J.7
//.?/.?/?.-?
/*7
ORP
;te/?5-
/97y nt o
2 ^ /
2 2.
**3
RY TIME minOL REMOVED k
Turb
S37.0
Wr** '
>J. U9
.-s*3.71£
DO
//./I
//.J7
//A¥^ f://..?/ ./*#/
Depth toWater from
TOClo.it*
ie.ilS0.ZZ
/*.z*<*.zs10. ZS'
fo.ZS
al)(L)
Pump Rate
fl.-T /pm
«"*"'1
s
euo h - /•_*.-»'rWiutf V // -*72.- OO/JS~ _ _ ._ _ _ —————————————————Dtw»?i£*>e -ftfJtcn &&* t>uP /
/*\ fSIGNATURE ( Uf/Z ^ jQM zt"
SOP: 016. Revision 2 n o n n n • , J"'V19
15 Loveton CircleSparks, Maryland 21152
PURGING LOGBOOK FORM : !GROUNDWATER SAMPLES
' i
WELL ID £/M Iff SAMPLE NO.WELL/SFTE DESCRIPTION J
•J
DATE & 1 2* I 18 TIME HO^
WELL DEPTH J*'& ft CASING HEIGHTWATER DEPTH
AIR TEMP. ?6C :']-;j
10 ft ,<2 -«5 ft WELL DIAMETER S^o in . 1
WATER COL HEIGHT Y-f-9 ft SANDPACK DIAM. in "EQUIVALENT VOLUME OF STANDING WATERPUMP RATE
(oah IL(onnf?
PUMP TIME mini!WELL WENT DRY? ( JYes M NoVOL REMOVED (aal) (IPURGE AGAIN?
Date
xfe
COMME
Time
l&l
K>£*
)<*$<<>
ib5&no&noz
( )Yes (MNo
VolumeRemoved/.Oi.
^->L
3.O
V.ot5-. ^te.O L*
PH
,572
*7?-— » O ~
y f Q- }
£$1f O^™>. Uo
Cond
.tfl• 3&1
•&?• 3tf&<=>.3fo
PUMP TIME min.) RECOVE
TOTAL V
Temp
/?3-2al20.12o. 32*3203
ORP
-7-7-ni-23.0-33.1-*6.6-503
RYTIME min.*OL REMOVED (c
Turb
A?
y.o0.2.
0. 1
O.O
o.o
DO
**•
557
?•??
?.7Z-V^2.5V
Depth toWater from
TOC
/,?.%
/2- J^ ^?
/ J 5
/ 3 ^
/Z.-93
I»I)(U ;_]
Pump K«
,7. /pf?
-1 v.
Jl
''/\ ' *
•. ;
- ' ^
:•!
*•n / * *
NTS Tr\ V«x fas, d&p+l\ 1 / ' Jf%rtn\4- t '*A *?2. ocffta • r
; -;"• *
SIGNATURE Qj/p# &KJ&f ] •
SOP: 016, Revision 2 A R 0 0 0 | |
15 Loveton CircleSparks, Maryland 21152
PURGING LOGBOOK FORMGROUNDWATER SAMPLES
WELL ID <S-fW"J SAMPLE NO. 6 ,1WELL/SITE DESCRIPTION K UoXW.u Cxx/ VXr
DATE ^ / Z£ 1 *& TIME 5«K D\eA6) O "
WELL DEPTH t**WATER DEPTH ?.»eWATER COL HEIGHT
^
ft CASING HEIGHT
AIR TEMP. °
ftft WELL DIAMETER <V' inft SANDPACK DIAM. in
EQUIVALENT VOLUME OF STANDING WATEFPUMP RATE . £ Ul»w*.PUMP TIMEWELL WENT DVOL REMOVEPURGE AGAIN
Date
S-76w
K
U
.,K
k
tl
COMME
0B«« - ta»»RY? ( )Yes t-ONoD (a7
Time
Wi
*>%5o0s s0 00
0<b<i
o<UoC^lS
oVto
NTS__
«* df>A
( JYes ( )No
VolumeRemoved
-—
4,09.ft*Vt.o
IS.*
l*.oT\-o
t«\.o
PH
s-wi6.6w *\ *»
• OCh
5 ^C-oa
«.o|
(WCo
(aal. in(aomi Hnmmin
)PUMP TIME -7S min
•1) (L) RECOVETOTAL V
id
Mjp,W^Z\3,\Zl%v-7
ZT7.9
TZ%,-)
Z%,5
T«(?
A _..«*_* -7 r/rti .-
/?/J K Jt* y« ft ? ~
Temp
fi.T.
\5.S-7iG. H
•S.O
tS.6t
»S. 7
rAUORP
-fr,l
-Tt^-ttx-to.t
-1-).0
9.
-t*z.e
RY TIME ^minOL REMOVED U ft laah IO)
(JTuTurb
).to.sjj £l
Z .l
CtA.-1O.o
*|LDO
<uzOMO
o ->A •! |
J . y ~J
OM1
a. 5
Depth toWater fromTOC
£ la
8.47
?.TSS^O
?.S1
9.o*.•i,*t
Pump Rate
.?
.<<
.&J
*
^ t^
.*
,6
.C
4 r w jawU* r Ok ,/, IS a.' 1
/O«o
-~~~T77s- rt\SIGNATURE t/"-— s/Tl
SOP: 016. Revision 2 fl R 0 0 0 4 I 2
1 5 Loveton CircleSparks, Maryland 21 1 52
PURGING LOGBOOK FORMGROUNDWATER SAMPLES
WELL ID CJ»A,*\___________________L^_ SAMPLE NO.WELL/SITE DESCRIPTION
DATE ^ /^» n^ TIME WttPteAbA WO AIR TEMP.
WELL DEPTH 1V.S____________ ft CASING HEIGHT _________________ ftWATER DEPTH U.Tt-___________ft WELL DIAMETER 4"______________ jnWATER COL HEIGHT int_________ft SANDPACK DIAM. ________________ inEQUIVALENT VOLUME OF STANDING WATER g-*_____________________________PUMP RATE -TtlPUMP TIME JUS_________________________________________________ min IWELL WENT DRY? ( )Yes ( ) No PUMP TIME ____________________ minVOL REMOVED _____________ (gal) (L) RECOVERY TIME _________________ minPURGE AGAIN? ( ) Yes ( ) No TOTAL VOL REMOVED ________ (gal)(L) *
Date TimeVolumeRemoved PH Cond Temp ORP Turb DO
Depth toWater from
TOC Pump
O.Z7
0.55 (I
(1
iiqo n .5 -ran 7J,M 0-H1
-J.Zl
e.\\ VU.T
5,7x3 ll-
ait tv
COMMENTS ;v * i (Vp oy iuT tF
SIGNATUREE /
SOP:016,R.vision2 fl ROOD I* I 3
15 Loveton CircleSparks, Maryland 21152
PURGING LOGBOOK FORMGROUNDWATER SAMPLES
WELL ID AM-* SAMPLE NO. &*\-'%WELL/SITE DESCRIPTION ZLfiUO veM Uxr\*V;v\
DATE S / "^ / V TIME £ =»\s <£V V5V<»\
WELL DEPTH V - > ft CASING HEIGHTWATER DEPTH
AIRTEMFV-S^^l0
ft4.TZ- ft WELL DIAMETER ^ " in
WATER COL HEIGHT -7.7*4 ft SANDPACK DIAM. inEQUIVALENT VOLUME OF STANDING WATER £.<*>PUMP RATE ,-)L—— '^'
laah IHlaom^ llDtn
PUMP TIME IM^> minWELL WENT DRY? ( )Yes ( )NoVQL REMOVED (aal) (IPURGE AGAIN?
Date
fo.-'HIt
A
i *
U
l(t.< >vl
OMME
Time
|Tto
IT&
rt*-
»Wt|Z*>aw<_IZ-So
t-Lt ^
( )Yes ( )No
VolumeRemoved
qs.A .o5Z,SS6.os-ss^«
TO o
-)ls
PH
C.066.
6.**fi.ce
feiV
fi.ufeu6.\o.r.u
Cond
4o>.416.7.
qa.1
H,\
MW-.n-1TMW.6
u .->
)PUMP TIME min
.) RECOVETOTAL V
Temp
(<{&.
ss. sI9.--V!9.»?I9.TSi9.-z.Srw.-n(9.ZT19-T?
ORP
-151A-I«A-Ifio.S-\ «-166,1
-16T<?
H .O
"ITo.i
RY TIME minOL REMOVED (o
Turb
•ZSA
t*-Htf.€n.-jI5.M
m,»12. -S
11.0
9.*
DO
<M7ft.\-.
o.izo,l\
oa\oav,ilOAl
o,a
Depth toWater fromTOC
S.T.O
S.zo5 <»S o5!Zo5.7,0
S.-Zo
S.Z*S.To
al) (L)
Pump Rate
, 1 Ll'XM A
LX
'\
«
')
"
^
IV
^
MTS -.[\ I \U£~A < .I5 K l*t.?6i
SIGNATURE OPU-CU
Julyv
15 Loveton CircleSparks, Maryland 21152
PURGING LOGBOOK FORMGROUNDWATER SAMPLES
WELL ID &M 1 SAMPLE NO.WELL/SITE DESCRIPTION \
i
DATE & I** !**& TIME F-12 " AIR TEMP. 7 /r .'
WELL DEPTH **&* ftWATER DEPTH Z &>*l ftWATER COL HEIGHT «M*' )V37 ftEQUIVALENT VOLUME OF STANDING WATERPUMP RATE 4.-TPUMP TIMEWELL WENT DRY? ( )Yes fes)NoVOL REMOVED <aal> (L)PURGE AGAIN? ( ) Yes fcsfNo
CASING HEIGHT 2.e>WELL DIAMETER +.0SANDPACK DIAM.
PUMP TIMERECOVERY TIMETOTAL VOL REMOVED
ftinin
. (gai)(imin sminmin t
(galHL)
Date
01**'
Time
i3)t>
13 iZ
/3/*/
'3J{,
lift
&20
VolumeRemoved/* i-2.o
3o1.0
S.o
b,Q
PH
U33S3o_>.77
A*V
.«?
$S(,
Cond
. loo
JO'2.
.en
.of?
.&n
.0%
Temp
/6-7n.*17. 6./
>tlft I
ORP
73
73757J
•737/
Turb
y3.££.t3-11,3c.s-O.I
DO
?5X
S-7i
f^O
z-ir?.5o5-V7
Depth toWater from
TOC
20. &&H
It
*•!
11
n
Pump .MI£>.£• if ,
> i
*»
,1
)l
COMMENTS
SIGNATURE ^SOP: 016, Revision 2 AROOOM5
'OCQt?
- £
RECORC
Gauged
Location:
e>zoDOf-oDOOccQ.0=3UJ $
I! »Q 5 viZ e ADl *O B
of 1\J CL. O
o> o>Eo>-3R5
DC
•S v*= £"S-Ss.«^
e^ ow=«2c
2sS
w.o•a raS>
Q9
£"0
**£
0)0
'55 5
UJ
«
s|
(S
^5!
C
^ \ft
^
c ^f ^
A
-oCO
0
>3
^
prs.
Ort
xS
If)
2^
CV
CO
s
s*
0.
0-
CO
m*i
§XCT
N
15N
- c\ er ^— *
t.111 III III 9ROOOM6
Sampling Event Two(May 1999)
AROOOM7
15 Loveton CircleSparks. Maryland 21152
PURGING LOGBOOK FORMGROUNDWATER SAMPLES
WELLID 6M 1 ~ U$5 SAMPLE NO.WELL/SITE DESCRIPTION
DATE £ 1 £ / ?^ TIME f * 5& AIR TEMP. C?5"
WELL DEPTH ft CASING HEIGHTWATER DEPTH ?/. 75 ft WELL DIAMETFPWATER COL HEIGHT ft SANDPACK DIAM.EQUIVALENT VOLUME OF STANDING WATERPUMP RATEPUMP TIMEWELL WENT DRY? { )Yes ( ) NoVOL REMOVED (nail tlPURGE AGAIN?
Date
/??
COMME
Time
l°50\*F)//ooUO^
1(1°(i'5III*
11^5
( )Ye« ( )NO
VolumeRemoved
D
/C
ZLILVL5LbL7L.
PH
5./0
*M&•VpM2?L//.O4'?i«f.VJ
Cond
&C>Xt8ZG2,Z8iIfcon*v.Z18
PUMP TIME.) RECOVE
TOTAL V
Temp(7,&/£fc/5 d(t-3/(r.S
|G.5
/fr'fc
ORP
f(t&
fi°lz*nZ20&iHI- ^
IYTIMEOL REMOVED
Turfa
y<i-iY^4^
DO
•"h.70•K
• 11
.2x>^"2-
«ininfaah (Ll(aoml (lomlminminmin
«
Depth toWater from
TOCJ2,yyjz.yyll. *.cW-*.1/?l.VVli.^V22- y
MTS
HD(L)
Pump Rat*
Zoo«l/--c
1
i
|
i
X
_
siG.MTURE_JrQtLL J *9 "
SOP: 016, Revision 2 A R 0001* I 8 Jul»1
15 Loveton CircleSparks. Maryland 21152
PURGING LOGBOOK FORMGROUNDWATER SAMPLES
WELL 10/512-" L£ J SAMPLE NO.WELL/SITE DESCRIPTION ? 1
DA-re T ,*<> ,W TIME /630
WELL DEPTHWATERWATEREQUIVAPUMPRPUMPTWELLVVOL REPURGE
Date
f, Ift,vffi
COMME&h
DEPTH 7.4 .71COL HELENTVCATE
1GHTLUME OF STANDING WATER
,iAW TEMP. &2_ -j
ft CASING HEIGHT ftft WELL DIAMETER inft SANDPACK DIAM. in '
IME/ENTDR:MOVEDAGAIN?
Time
!(,#?\^Q*>iCic|(P|<(t?;<.Ifc-rf*i 7o
Y? ( JYes ( )No(aalHL
( JYes ( )No
VolumeRemoved
OL.IL7u1uq^^Gu
pH
r?jf-7•"7|^ •
Cond
770TSo?12— - — •
faalt (L(9Pn T|min ?
PUMP TIME min) RECOVE1
TOTAL W
Temp
tf-L/t «T|t,1
ORP
-
— 1"*"|0
v>7 />"T1
C'a~e yl_kMU/4U,.r£e/ ArAycgrt?9*«A«P<
5 Y TIME min ,3L REMOVED (o
Turb
vt?5y$*/~G~t*' l
DO
-17.It>
-16^ JT ———
Depth toWater fromTOC
Z<.£>*f~ 0*4
f^L do^^e-o
»D(L) !
Pump 1 *l2c ./(
'-T
Aj1 —— i.'".i
^?^• •: ,
wJ? ct<rc<Jt rttefaf 4> Sf'9tAAoff' s a« /* && -As- -MC/Va^p -i-A <'iHfaAMMt f fednof fCflA /t " V * 1
_ ——— 1 ——————— -«.irMATtlRP Vffij l/l&£T~~
SOP: 016, Revision 2 A R 0 0 0 If I 9
15 Loveton CircleSparks, Maryland 21152
PURGING LOGBOOK FORMGROUNDWATER SAMPLES
WELL.D 6-M1-LSP SAMPLE NO.WELL/SITE DESCRIPTION
DATE C / k / ?? TIME /B09
WELL DEPTH ft CASING HEIGHT
AIR TEMP. /05
ftTX.feS ft WELL DIAMETER in
WATER CQL HEIGHT ft SANDPACK DIAM. inEQUIVALENT VOLUME OF STANDING WATERPUMP RATE
faalULi(anmi (lornl
PUMP TIME minWELL WENT DRY? ( ) Yes ( ) NoVOL REMOVED laalHLPURGE AGAIN?
WELL DEPTH _______ _________ n CASING HEIGHT _________________ ftWATER DEPTH MJ f <•* ft WELL DIAMETER _________________ inWATER COL HEIGHT ______________ ft SANDPACK DIAM. ________________ inEQUIVALENT VOLUME OF STANDING WATER ________________________________ (gal) (LPUMP RATE ________________________________________________PUMP TIME ___________________________________________________ mm wWELL WENT DRY? ( ) Yes ( )No PUMP TIME ____________________ minVOL REMOVED _____________ (gal) (L) RECOVERY TIME _________________ min .,,PURGE AGAIN? ( ) Yes ( ) No TOTAL VOL REMOVED ________ (gal)(L) ?
WELL DEPTH ft CASING HEIGHTWATER DEPTH •).*TT ft WELLDIAMETER ^WATER COL HEIGHT ft SANDPACK DIAM.EQUIVALENT VOLUME OF STANDING WATERPUMP RATEPUMP TIMEWELL WENT DRY? { JYes < ) NoVOL REMOVED (call (LPURGE AGAIN?
Date
5/ffr»
COMME
Time
f ttz1 o 3 '2l T.
tcii- 1* V i \
f*fli
'If 41r»<r?I*S>
uo»It or
IA |7_
n/fr
( )Yes ( )No
VolumeRemoved
c
y.2,t3 6f.s6.0T-l-
*1 w
)0<git oI3.T.i .'t
PH
5"CWT«r.wf.1(r
6,0!
6 of^ oc
6 »oCr.M
-6.I3
Cond
6*3t-ir671?o<"?!-?>i-uTt*H^Tl>>»>^>»^>n
PUMP TIME.) RECOVE1
TOTAL V
Temp
m\T>.t*13.1if.?.I4-.1n.»*t.IjL -
t|» |L
»tM-
1 tl- tt
'.SIt-1*
ORP
-3 t-tlT-K>•M.I-m~*Vf-Co.o-(,, -63r-t4..J-6tJ
-fc%o- (A*
RYT1MEOL REMOVED
Turb'
1 rt- d1 ^T T
I .S1f.oK-3
&.*Ht.l3^z3 -o1o.1zr^t>*-.3i*.-i«.s-
DO"
T
(
l.ld
i.-irlu1.00
o«ii(3.V5?0
£>. K
»-?«^W0.1
ftinin(Q(qm
al) (L)pm) (Ipm)in
minmin
it
Depth toWater fromj
TOC ^
-|
I.
ff
S?-
?. ri
T63i / *1 . V a
*t 6<VT-o1 ^
MTS t f /v *- / /€ at*" 4» ' i->~**-r- *— »-*l *£- o* W/-5 t'
SIGNATURE W** 2
al)(L)
Pump Rate
..3 L/«;
————
-1-T:
*-*L s*
SOP: 016,Revision2 RROOOU23- Jul»19
1S Loveton CircleSparks. Maryland 21152
PURGING LOGBOOK FORMGROUNDWATER SAMPLES
WELL ID GlM~*t~l^5 f v»*\ *»*j& SAMPLE NO.WELL/SITE DESCRIPTION ^
t i
DATE <C/ C- / TIME
WELL DEPTH ft CASING HEIGHTWATER DEPTH
AIR TEMP. T
ft .ft WELL DIAMETER in i
WATER COL HEIGHT ft SANDPACK DIAM. in •••?EQUIVALENT VOLUME OF STANDING WATERPUMP RATE
foall II(aon"'
PUMP TIME min :WELL WENT DRY? ( JYes ( )NoVQL REMOVED (nail (LPURGE AGAIN?
Date
L /i Utf^ F ** ^1
COM1ME
Time
M**Mzfn«I13Z
( )Yes ( JNo
VolumeRemoved
K.&I6.T|Y,o
M.Z.
PH
Oif6-/C
£.lfr
t,n
Cond
710>ZO?Zc>
>W
PUMP TIME mm.) RECOVE
TOTAL V
Temp
K*'4.4/*.</
f*f.t
ORP
-*M-H7-%fr-?tjO
RYTIME min .OL REMOVED fc
Turb
"'1/•K7.
lt.4'*
DO
*lfcC
aw.C3Ofyo
Depth toWater fromTOC
*?.?/•7.7;«| 71.7t
r.i)(D -
Pum k i
a* i'-.»
| .,\ •'
v
;
j j, .:
MTS ^«JWJ C-y -k*--U<i; K « *p 4-* \O &*** t - t U— ,-± laAf*~ yt-V j uJ« (i v. <-. .s *ak-. . _ULo~ -C J«c.* *C< * *~~/5f ' ..___! ——— 1_- -* '
<J*MAUdJ 0 H4^
SIGNATURE fa'tffaJr
SOP: 016, Revision 2
1S Loveton CircleSparks. Maryland 21152
PURGING LOGBOOK FORMGROUNDWATER SAMPLES
WELL1D -r ' SAMPLE NO.WELL/SITE DESCRIPTION
DATE 5" / C, / "I-V TIME 1^14 AIR TEMP. feO-P
WELL DEPTH ft CASING HEIGHT ftWATER DEPTH 1. S Z- ft WELL DIAMETER -4 inWATER COL HEIGHT ft SANDPACK DIAM. inEQUIVALENT VOLUME OF STANDING WATERPUMP RATE
(aall (Ll(apml (lomt
PUMP TIME minWELL WENT DRY? ( ) Yes ( ) NoVOL REMOVED (aall (LPURGE AGAIN?
WELL ID »• &*i f SAMPLE NO.WELL/SITE DESCRIPTION I
DATE > / 7 / 77 TIME ltt!0 AIR TEMP.
WELL DEPTH ft CASING HEIGHTWATER DEPTH t*~21 ft WELL DIAMETER */WATER COL HEIGHT ft SANDPACK DIAM.EQUIVALENT VOLUME OF STANDING WATERPUMP RATEPUMP TIMEWELL WENT DRY? ( ) Yes ( ) NoVOL REMOVED f aall (LPURGE AGAIN?
Date
fin
COMME
Time
\\tQ'0
fioflilt
It>I?((,&
IM$jtfoIMSMoll,tf
( )Yes ( )No
VolumeRemovedCL.ILl-L.JLVLJM_
(fL7<-IL,IL"
PH
5T7jT62ft i/S -V r
J^^
X^?57V^ft?
K 14
J Id
Cond
./ 0
./3c
./J2.-W•t}9Jio.Ho•WL.in•im
PUMP TIME.) RECOVE
TOTAL V
Temp
/R1ll,z.f/.Z1(1i/-ZI/.LILLli.oM».«
ORP
J20
3/6J<?6>E812 5*7zyz.^ Blo211$1*1
*YTIMEOL REMOVED
Turto
7&6/fi
y?io17?%3|1?lo
DO
/2jU<f•tf.26.77Az•n.to<5>3\
^70 r,*
« ^in '*
/gprf min Ii.min
M min - *(f
Depth toWater from
TOC
£.85~7./2-7./J7.*F7<l$7*/r7/iT-utl'l£1'lf
NTS
pal)(L)
Pump RdftiZoo*L/H '
\
'
• •
SIGNATURE >Wf L^\ —
SOP: 016, Revision 2 AROQ0426
15 Loveton CircleSparks, Maryland 21152
PURGING LOGBOOK FORMGROUNDWATER SAMPLES
WELL ID <•/*!•?___________;________ SAMPLE NO.WELL/SITE DESCRIPTION ____________________
DATE 5 I C» / T^ TIME '4 :°-T_______ AIR TEMP.
WELL DEPTH ___________________ ft CASING HEIGHT _________________ ftWATER DEPTH __________________ ft WELL DIAMETER ________________ inWATER COL HEIGHT ______________ ft SANDPACK DIAM. ________________ inEQUIVALENT VOLUME OF STANDING WATER _____________________________PUMP RATE ___________________________________________________ (gpm) (Ipm)PUMP TIME ___________________________________________________ minWELL WENT DRY? ( JYes ( )No PUMP TIME____________________minVOL REMOVED _____________ (gal) (L) RECOVERY TIME _________________ minPURGE AGAIN? ( ) Yes ( ) No TOTAL VOL REMOVED ________ (gal)(L)
Date Time
LVolumeRemoved PH Cond Temp ORP Turb DO
Depth toWater from
TOC
II. 4.U1s/z-t
If "5 ft.1*- -szi . '5 It,Z.41
II.It.f -zn.414.4 11.3
36 (, ll.l
•stc- 11.1 -ft.* 10.1
Ko? 74.4
!£!£.
U* -.~l;
SIGNATURE
SOP: 016, Revision 2 A R 0 0 0 U 2 7
• 15 Loveton CircleSparks. Maryland 21152
PURGING LOGBOOK FORMGROUNDWATER SAMPLES i
WELL ID &ri-1____________;________ SAMPLE NO.WELL/SITE DESCRIPTION _____________________________
DATE $ I <f t " TIME 1* >_______ AIR TEMP.
WELL DEPTH ___________________ n CASING HEIGHTWATER DEPTH M, *•___________ ft WELL DIAMETER »____________ in JWATER COL HEIGHT ______________ ft SANDPACK DIAM. ________________ in ^EQUIVALENT VOLUME OF STANDING WATER ________________________________ (gal) (L)PUMP RATE ____________________________________________________PUMP TIME ___________________________________________________ min jjWELL WENT DRY? ( )Yes ( ) No PUMP TIME ____________________ minVOL REMOVED _____________ (gal) (L) RECOVERY TIME _________________ min ,,PURGE AGAIN? ( ) Yes ( ) No TOTAL VOL REMOVED________(gal)<L) f
Date TimeVolumeRemoved PH Cond Temp ORP Turb DO
DepthtoWater from
TOC Pump
.W
LZcrt- •WT.I
3.C- 13.4% , 1 fcn.z
-i-.s-i 6.0141 ilc*
13?rn I3.fr ??
JLLl: VI o.z
n.* 33.1-COMMENTS -k.rUiX-K. nr.fcx *vi * b»* _ _ T J _f M«r e. |0" T
to :3
SIGNATURE
SOP: 016, Revision 2 AROOOU28
15 Loveton CircleSparks, Maryland 21152
PURGING LOGBOOK FORMGROUNDWATER SAMPLES
WCII ID Car - *\ f t*v% *vw a-J ) SAMPLE NO.WELL/SITE DESCRIPTION f
DATE < 1 (, / n*\ TIME
WELL DEPTHWATER DEPTHWATER COL HEIGHT
ft CASING HBGHT
AIR TEMP.
ftft WELL DIAMETER inft SANDPACK DIAM. in
EQUIVALENT VOLUME OF STANDING WATERPUMP RATE
(aall (Llfanml Ho ml
PUMP TIME mmWELL WENT DRY? ( ) Yes ( ) NoVOL REMOVED (nail (LPURGE AGAIN?
Date
COMMEHt
Time
IO-.MT-w-.oIO-..Tr^II -.03II -mt,;M
M--K-
MTS ,« _______
( )Yes ( )No
VolumeRemoved
ICC.1C.?ITo11.*ZO *>
zi c.ZI«27,4-0-r^ L
pH
C<r<TC*"UV-%f.O
<T,«for*|rtfc^
Cond
1?\7*|Z(,-L
111
111-IIT-111
PUMP TIME min) RECOVE1
TOTAL V
Temp
171n*\17.1?f3<j
119HTirt^»351^^
ORP
3Z.L
7o. |
Z1.Z
Z15
12.C
34.134.fr*5z,?^ ^
RY TIME minOL REMOVED (c
Turb
Kt*.(C C
I u T"j
I / t f
w\{/ iLiLlu T "^
»G4<|t<K* I/ % S
DO
tn*f 7-
7. Ifr
4.13
mzw1.T.O
1.x
Depth toWater from
TOC
2-<*.}fzs.>r ^ ^ " ' L ^^ff K ^fi
Z<?.K2<S.
M.Xl .K
al)(L)
Pump Rat*
.1 1/ ^
1 . ... A L s l »\
L.U. JJ- LUUT /»lt*w*t Uv-,V. *d*o*» 2*> «:*. >» »«I f J 'L f M « ir*so
SIGNATURE \ A+~t«v ~~ ———————— _
SOP: 016, Revision 2 ARQQtil*29 ^^
'115 Loveton Circle ISparks, Maryland 21152
PURGING LOGBOOK FORM jGROUNDWATER SAMPLES
WELL 1CWELUS
, &#/0ITEDESC:RIPTION
SAMPLE NO.'< ^
j
DATE _^ f 6 / *?y TIME /0<?«
WELLDWATERWATEREQUIVAPUMPRPUMPTWELLWVOL REPURGE
Date
k
COMME
EPTH__DEPTHCOL HELENTVCATE
~7- 6"7IGHTLUME OF STANDING WATER
ft CASING HEIGHTft WELL DIAMETER
AIR TEMP. ^ 5
in •ft SANDPACK DIAM. in
faalHL(amr ^
IME min *rENTDRMOVEDAGAIN?
Time
Izs)30*J?5To
at/r
9T/01ST
Y? ( )Y«s ( )No(aalML
( )Ye« ( )No
VolumeRemovedO
IL-tuIL
H^
(*L
gadk
pH
w«.&L/D• *\Q
(p.tO\ff v j
t.ttt-70
Cond
830&&£"b«G>#0(,ftto&7t/
PUMP TIME min) RECOVEI
TOTAL VI
TempiL $i\<bif-**fl-C^[1-5I'-S
ORP
-83-«B-YoU~io$
-/'I'III
?Y TIME minDL REMOVED
Turfa
W7?
Jo1*
"2-1zg>
DO
-V7-27.Z4-Zc?.ItJ7
(a
Depth toWater fromTOC
7.757-75"7.77-7S-7.7.7. -7 5"
Pump K .1I0o*cjf
If
H
* X x !
SIGNATURE //#T f ff J/J
SOP:016,R.vision2
15 Loveton CircleSparks. Maryland 21152
PURGING LOGBOOK FORMGROUNDWATER SAMPLES
WELL1D t'*'l SAMPLE NO.WELL/SITE DESCRIPTION
....
DATE 5/1 f 1 • TIME 12*60 AIR TEMP
WELL DEPTH ftWATER DEPTH <? ftWATER COL HEIGHT ftEQUIVALENT VOLUME OF STANDING WATERPUMP RATEPUMP TIMEWELLWENTDRY? ( )Yes ( ) NoVOL REMOVED (oall (LlPURGE AGAIN? ( ) Yes ( ) No
CASING HEIGHTWELL DIAMETERSANDPACK DIAM.
PUMP TIMERECOVERY TIMETOTAL VOL REMOVED
ftininfgalUL)(apmUlorminmmmm
(gal)(L)
Date
$kTime
mfMl'HJf//VollffliftI'X
VolumeRemoved
OL.;LZLIL
IfcfL<oL-
PH
fft
W&1f76mf.nw
Cond
99t*ofz*.o?o.ofoDSo.off•oft
Temp
/z.ili.iILLILLH-LIt.Lli.i
ORP
,772,Wo1/8?*</W11 0Z&&
Turfa
ftoM£7friZ-z\1\
DO
.98,1L.31.33.12,.$0Jo
Depth toWater fromTOC
0Pump Rat*Zao+d,/** .
COMMENTS
SIGNATURE
SOP: 016, Revision 2 ft R 0 0 0 U 3 I
15 Loveton CircleSparks. Maryland 21152
PURGING LOGBOOK FORM \GROUNDWATER SAMPLES
WELL1D Cfr' SAMPLE NO.WPLtVSrrE DESCRIPTION
DATE C" / T- 1 W TIME *!•/«
WELL DEPTHWATER DEPTH 1. 04WATER COL HEIGHT
.ft CASING HEIGHT
AIR TEMP.
ft WELL DIAMETER *''ft SANDPACK DIAM.
POUWALEMT VOLUME OF STANDING WATERPUMP RATEPUMP TIMEWELL WENT DRY? ( ) Yes ( )NoVOL REMOVED (aall (LPURGE AGAIN?
WATER COL HEIGHT n ft SANDPACK DIAM. inEQUIVALENT VOLUME OF STANDING WATERPUMP RATE
(aall (Ll(opinl Iloml
PUMP TIME mmWELL WENT DRY? ( ) Yes ( ) NoVOL REMOVED (nail (LPURGE AGAIN?
Date
4
\|
r
/
COMME
Time
?$*<>775"to>YS'9f«i(00.
( )Yes ( )No
VolumeRemoved
OLILIL7L
<-H-fL6L
PH
f-Wf-zvZlVten?•£$.11f.il
Cond
.#-.off.0%
.0*
.o$t
.0%,
.09.
PUMP TIME min.) RECOVE
TOTAL V
Temp
U**II&11.1*t/.l*//•6y/.frii-ii
ORP
W5ZO-Linno/zoIII*in
RY TIME minDL REMOVED faah (Ll
Turb
y* vQQ
36zz~zonn
DO
/•0/
At/luUJM/54/<57
Depth toWater fromTOC
0Pump Rate
Zoo*Ll~«
^
c/../*.;t9 jx4/?>« ———————————— ——— — • _/ / */ iX
M* r-j/Q^ — -^SIGNATURE Al& ^ TOX \N
SOP: 016, Revision 2 JulyAROOOU33
15 Loveton CircleSparks. Maryland 21152
PURGING LOGBOOK FORMGROUNDWATER SAMPLES
WELL ID t-ft* It- ( C*v»H »_***-/ J SAMPLE NO.WELL/SITE DESCRIPTION '
DATE r / * / T*> TIME
WELL DEPTH ft CASINO HEIGHTWATER DEPTH
AIR TEMP.
»ft WELL DIAMETER in
WATER COL HEIGHT ft SANDPACK DIAM. inEQUIVALENT VOLUME OF STANDING WATERPUMP RATE
foamfan \
PUMP TIME mirWELL WENT DRY? ( ) Yes { ) NoVOL REMOVED (aah (IPURGE AGAIN?
Date
sfrlf
COMME
Time
,OZ~
(OTf
/0Z*
(0VZ-
/0M,
104°rOlr*
lot*
(051
NTS C . _________________ . ______ , ___________ ,__
( )Yes ( )No
VolumeRemoved
2*Z6
7 >lo
32-3416,1-B
<+o
PH
6 t6.H
fir.Zf-
^ >6-730.2Z
L.v**(r.2f6.?t
Cond
6fT
60 1
6«><,605-
(,&<?
(,0+
i*«<
LM(.0*
PUMP TIME minJ RECOVERY TIME min .
TOTAL VOL REMOVED d
Temp
«.<*
1*5.7il^f?.1'7-1»t.OK.o
;«>oIH.O
ORP /
-K.1-7»ho-76.-UA-?t.i-76.1-?-7 .7-?cc
^1 ,4.<?1 .116.1."7,I7-T?. i6,uT-.
>00
o.*<O.S+
o.<&m0.&
OAT,
OX\
«l„,
Depth toWater from
TOC
1-I/
1.0-1
f.01
IJOft
*..!/
1.M
1.171.1"?.-T.I-?
la'MU
Pump a
\ ^
j/ W *./W* v/4^c -.*U. l.U < *U ._./ r\- -u* 4V-r:i--*. c p J
•to-w UWt *p. ///?OT .. -
SIGNATURE S// JLf ^
SOP:016,R.vi,ion2 RROOOU3U
15 Loveton CircleSparks, Maryland 21152
PURGING LOGBOOK FORMGROUNDWATER SAMPLES
WELL ID C^Mly SAMPLE NO.WELL/SITE DESCRIPTION
DATE ^ / (0 111 TIME 1 SOO
WELL DEPTH ft CASING HEIGHTWATER DEPTH
AIR TEMP. -5"
fti Z-to5 ft WELL DIAMETER in
WATER COL HEIGHT ft SANDPACK DIAM. inEQUIVALENT VOLUME OF STANDING WATERPUMP RATE
(oall (Ll(anml MDml
PUMP TIME mmWELL WENT DRY? ( )Yes ( )NoVOL REMOVED (aall (LPURGE AGAIN?
Date
$i\n
COMME
Time
HISWol*»1?[W>tftfMoit/ff
MTS
( )Yes ( )No
VolumeRemoved
0fLILILL5ufal~
PH<-!</
6JoG-W0-Zt&.13C.1315
Cond,7ey, 2-,77o.bl1/.m,t_t°.(p L
PUMP TIME min.) RECOVE
TOTAL V
Temp
U )/2-aII -o(Z.&tf.1II.*
\l*o
ORP
7-?7-47-55-5"8-tL-6
RY TIME minOL REMOVED (c
Turb
3V7
at.zyzvZl/s
DO
.7/
./I./6>./8*/5.17./6
Depth toWater from
TOC
/Z-7T/z.7//Z-7/
tl-ll11.11/Z-7/ll.K
|al)(L)
Pump Rat*Zoo~eJ»
it
it
t<
t(
If
''
SIGNATURE
SOP: 016, Revision 2 July 1S
AR000435
Appendix F
Closure Cap Calculations
AROQQ**36
DRAINAGE LAYER CALCULATIONS
Hmax = L* [SQRT(e/K + (tanBA2)) - tanB]
e = Intensity x {% drainage collected through drainage layer)
tanB = Slope (%)
L (ft, in, m) =tanB =% collected * =Intensity {in/hr) =K (cm/sec) ** =e (cm/sec) =
Hmax =Hmax (from HELP) =
L {ft, in, m) =tanB =% collected * =Intensity (in/hr) =K (cm/sec) ** =e (cm/sec) =
Hmax =Hmax (from HELP) =
TOP-NET100 1200 30.480.04
0.4114.0428.23
0.00117
ft in cm0.05 0.62 1.570.00 | 0.053 | 0.13
SIDE SLOPE-NET150 1800 45.72
0.3330.4534.0410.58
0.00129
ft in cm0.03 0.33 0.840.00 | 0.046 | 0.12
L {ft, In, m) =tanB =% collected * =Intensity (in/hr) =K (cm/sec) =e (cm/sec) =
Hmax =Hmax (from HELP) =
L (ft, in, m) =tanB =% collected * =Intensity {in/hr) =K (cm/sec) =e (cm/sec) =
Hmax =Hmax (from HELP) =
TOP-SAND100 1200 30.480.040.2454.040.01
0.0007
ft in cm22.73 272.73 692.731.08 | 13.00 | 33.02
SIDE SLOPE-SAND150 1800 45.72
0.3330.2474.040.01
0.0007
ft in cm13.92 167.02 424.220.47 | 5.58 | 14.17
* % collected is determined based on the HELP model.•* Permeability calculations are for Tenax Tendrain 70-2 and include factors of safety for field loading and
reduction factors for creep, biological clogging, and chemical clogging.
AROOOU37
BUSH VALLEY LANDFILLLANDFILL CAP DRAINAGE LAYER DESIGN - (Geocomposite Layer)
CONSIDERING ONLY TOP SLOPE OF LANDFILL
Rainfall Intensity, I = 4.04 in/hr k h= 2.9E-03 cm/sec (cm/sec) (in)
Infiltration to Drainage Layer = 41.1% 1.0E-03 1251.7Supply Rate, e = 1.2E-03 cm/sec 2.0E-03 871.7Slope Length = 100ft 3.0E-03 703.4
M;ro> ~"K -TO ID^ .c'Q.-O8*2 wnifO> (DS o>3 ora roX Q.CM CO
V0 X Xc ro CD« c c*K 0) OJW L_ 1—"*• c.O "*
o a o o-O *i "O T3c w c c(U O 03 0)> 0 > >
ooin1*-"•<rtft
inOld
jy-htry
oooo"O5If)
CO
P-
'EoinCMc"
Geotextile Layer (non-wove
•<r
oootoo(D4*
"n*-O
aS|O •* is.H«sr r* *&ftTT
'M in ooo m oOdd^
^ _ -. * JK^ w> f*
2»o oS o oc o oeo o" o"3 OJ O>O m in
*j'? •*— *-^ w tn
IOinCO,.3?
>* 'xf Q)"> 0s §,Ift
o S S.__ I4_ 'W (/> CDSo -5OU o *E o -oo o »0 OJ 5o m »5 " £ «U T3 -Q O•; Q> 30£M .C o * 3 S £<b D- - o>> S ® E-S C<D18 S Pooc o> g oj ro^ 5 £00.§
ooo041CO4A
"n*c
»xoL-caa.oO
cO)"«a>5pCO
CD
S3 o o 9 ..p o S o -?-?O C TT C CO COg, P «T 9> C C
J>'SJS£0)*-_ra3_Oraoo+*•o0)w3_>»CO£0)
! *<D 0)*•* SKra .>E * -«>< E
I *S <ra v. —g Si *S « -a" - I EI I i« S 5S ? i f••• / \ * o*- O ^ -=** tii .coC S K I-w rn 8 *"-^ 2 I aJ e t "§ § 1 sr- » 5 ».c w "S 01o a .° 11.<£ E £ •§£ 0 * ^ . £S « r &E -a * 2o E 1 g2 i i I» S i sO O 3 >o LU 3
O 0015 OW CMKl- 1_ *•' L_o o 01 o*; -o -o (M -a« c c o cO 0) 0) _ 0)O > > 5 >
00 |s- in O— 01 ID g O« in to g inO "fr (O Kj N-"•-s^a?to to *** w
U in o oi inO oo o r- 01O ID CO -r^ O*J
.•£* co oo oi S** r^ h_ m oC h- f*. CO °-g oT 01 T-- gg CO CO 01 g
^oo 0s w
1« S4- in!= 01_g . -
'« -7- a>5 *° S*-E 1O.-D i
§111a*!*£ c ™ «B E o>-iCO P -o Q)E c s. O) CO X
^ -D -i <» SP ? 3 o p§ ra J JS $±- w x a. o
T- CM cr> rr
Ooo•Ktooto
4*
"ra**o
m W V5 K Hfl) x""' " ^ft* - "—it o o"S "° "°2 c cO Q) 0)0 > >
«§§5 "-S£S£« s(/> *«
t5 m coo m oOdd•**3 (A &9w ** *
**2 2300c o on o" d3 o> a>Q m m
**•p 1*- -4—^ (O tf)
IoinCO
i'aT
^ '"5w S10 0« S« 0)lO
S r °W (0 COi s ' *E o -o00 ®O 0) ^O Ift M
S " -2 «U p J3 0S I 8S* 3 T3 C• o- ~ £.g £ "55 E13 ro PooE 2 | OB roo ^ s O o.**3
a> o oo -5- -c 3- co0) rt ift0) CO CD*£ C- CMW (M Oliv i_ i_ va 0 0 CN CMtS CM CM8 S §°°o > > s s
^ ° i- r-« £ 2 £JS T. ~. co coo r*- CM • ,.-:1- " 5 coCN i — . j* . o/f% / yv v \r fvr vr
^« o o a) CMO o r o ooO ^r oi oi d**^ fjA tf\ tf\ if\3>«*_ -t •««• r *«•*- in in o oC CO CO N. t -.2 Oi O> CO CO*g m m -s- TT
j_.•= c c >, >,.50000
"o" oV O* ^— sE « ? g-,° K § 1° S^ ^^ SB 5V « g -28ii. **— tn> S ->, -2 — «^ § o «caS S'S S Tr: m -"= c „O H co •>, 4=^ " •* „ 5 ro =.° » " g 2 o £oit ' "° CJ o ® •"*CM E « _ S -o co
CT .1= CO -° CO v15 ^ "^ F ™ r-"*- CT 03 S O1 5
. 1 2 l^ll> > <D b 01 co co= _ E _. ' S a) an COD E^3°E£ oo o - 5 r o ™ o» h- > s:OXQ.O3 i- CM CO «T
^ ^
Ooor-~otn«>
"ra*-OH
-C ,Co o0 031- Kk_ i_03 03
0) C CO _J _JS UJ UJE w co£ O OQ) ~ — ' ~ — 'r* *- •—o: o o*- -o -Dw c cO Q) 0>0 > >
'C (0UJ 0> •=Q. -- 75 -2D ^ P ro_l w fc cj ift • cin a) '— ift CO)
E S IsS " E -g^ tf> 0) C— o Eg28 g |J3 S £SE m ® -cS " SoE "° "5 0o 2? o5 E0-5 i- co° 2" uj uj« £ Q. Q.% ro q q• a? dd_> < ^ 73 16 g E EE 3 o o <i0 h- S "**j<
ooo(D
CMtf>
"ra*•*O1-
LINER COMPARISON (PVC -vs.- LLDPE)
Interface Fricti
Liner Material**
PVC (30 mil)LLDPE (40 mil)
* Wet interface cor** Information for F
Relative Cost <
Liner Material**
PVC (30 mil)LLDPE (40 mil)
** Information for F
on Angle Between Liner and Geotextile*
FinishSmooth24 deg.
15-23deg.
Textured26 deg.
25-35 deg.
idition at the critical slope (3:1, H:V).(VC and LLDPE obtained from Watersaver and GSE Lining, respectively.
Material and Installation) for Liners
FinishSmoothS0.28/SFS0.30/SF
TexturedS0.28/SFS0.40/SF
»VC and LLDPE obtained from Watersaver and GSE Lining, respectively.
t-t
1•;iHJ
'- 1' i
n• i
1'• >."T
LINERS.xls
BUSH VALLEY LANDFILL - HARFORD CTY, MDLANDFILL CAP SLOPE STABILITY ANALYSIS
length of slope, L = 150.00 ft NOTE: USE SMOOTH LLDPE ON SLOPESunit weight of soil, y = 120 pcf 5:1 AND FLATTER
depth of soil, d = 2 ftpore pressure ', n = 0.33 in. water
1.716 psftoe soil cohesion, cs = 0.00 psf
toe soil friction angle, <j>s = 26.00 ° (assuming silty-sand soils from representative borrow pit)weight of toe. WT = 1200.00 Ib/ft
INFINITE SLOPE FACTOR OF SAFETY:
(yZcos p -(i)tanyZsin p
F.S.= 1.(O.K)
Reference: Stability of Lined Slopes at Landfills and Surface Impoundments, August 1990 (Equation 5):
FINITE SLOPE FACTOR OF SAFETY:
\ r ^_J^WOAX >~4
Fc.0.— ———————————
\v)L tan^ + cL H ——
CO
/ZLsin/?
rT tan (f> +c Ls/?-sin>5tan^ F.S.-1.6
<0-K)
Reference: Stability of Lined Slopes at Landfills and Surface Impoundments, August 1990 (Equation 9):
-j d2 (slope)y
FINAL GRADE
————————————— LINERNOTES:Friction angle and range provided are based on manufacturer supplied data.
1 Pore pressure based on HELP model (calculations are attached.)1A Factor of Safety (FS) greater than or equal to 1.5 is considered adequate for landfill closure (EPA.
RROOOUU7
BUSH VALLEY LANDFILL - HARFORD CTY, MDLANDFILL CAP SLOPE STABILITY ANALYSIS
length of slope, L = 150.00 ft NOTE: USE TEXTURED LLDPE ON SLOPESunit weight of soil, y = 120 pcf STEEPER THAN 5:1.
depth of soil, d = 2 ft MAXIMUM SLOPE ENCOUNTERED WITHINpore pressure J, M = 0.33 in. water AREA OF LANDFILL CAP IS 3:1
1.716 psftoe soil cohesion, cs = 0.00 psf
toe soil friction angle, <J>S = 26.00 ° (assuming silty-sand soils from representative borrow pit)weight of toe, WT = 720.00 Ib/ft
INFINITE SLOPE FACTOR OF SAFETY:
(yZcos p -yZsin p
F.S.= 1.5(O.K)
Reference: Stability of Lined Slopes at Landfills and Surface Impoundments, August 1990 (Equation 5):
FINITE SLOPE FACTOR OF SAFETY:
\S t^^v^fj f iFo.0.— ————————————
CO
/ZL sin^
^T tan^5 +cs Ls^-sin>9tan^ F.S, = 1.5
(O.K)
Reference: Stability of Lined Slopes at Landfills and Surface Impoundments, August 1990 (Equation 9):
- \d2 (slope)y
FINAL GRADE
NOTES: ———————————— UNERFriction angle and range provided are based on manufacturer supplied data.
1 Pore pressure based on HELP model (calculations are attached.)3 A Factor of Safety (FS) greater than or equal to 1.5 is considered adequate for landfill closure (EPA.)
AROOOi»i*8
BUSH VALLEY LANDFILL - HARFORD CTY, MDLANDFILL CAP SLOPE STABILITY ANALYSIS
TRIAL FAILURE PLANE: (WET GEOTEXTILE WITH SOIL) OR (SOIL WITH WET GEOTEXTILE)____________ (Wet Geotextile Condition)
interface cohesion, c = 0 psfinterface friction angle V d> = 26 ° (Range = 25° - 30°)
slope(max) = 3 H:1Vslope, p= 18.4 °
length of slope, L = 150.00 ft NOTE: MAXIMUM SLOPE ENCOUNTERED WITHINunit weight of soil, y = 120 pcf AREA OF LANDFILL CAP IS 3:1
depth of soil, d = 2 ftpore pressure2, n = 0.33 in. water
1.716 psftoe soil cohesion, cs = 0.00 psf
toe soil friction angle, 4>s = 26.00 ° (assuming silty-sand soils from representative borrow pit)weight of toe, WT = 720.00 Ib/ft
INFINITE SLOPE FACTOR OF SAFETY:
(y Z cos p - n) tan $ + cyZsin p
F.S. = 1.5(O.K)
Reference: Stability of Lined Slopes at Landfills and Surface Impoundments, August 1990 (Equation 5):
FINITE SLOPE FACTOR OF SAFETY:
F.SV/ t-- 'Uz>p p.
WTtan^ -t-c Lcos^-sin/?tan^
^ZL sin/?
F.S.= 1.5(O.K)
Reference: Stability of Lined Slopes at Landfills and Surface Impoundments, August 1990 (Equation 9):
- \d2 (slope)y
FINAL GRADE
————————————— LINERNOTES:Friction angle and range provided are based on manufacturer supplied data.' Pore pressure based on HELP model (calculations are attached.)1A Factor of Safety (FS) greater than or equal to 1.5 is considered adequate for landfill closure (EPA.)
flROOOUl»9
so
o
<o
geQ.2U
il -»g -£ §£ y .C^ c.c
oUJo
oo
RROOOU50
Appendix G
Surface Water Drainage Calculations
flROQOl*52
SUMMARY OF TR-55 RESULTS (EXISTING & PROPOSED CONDITIONS) ""(Input Values for TR-20)
••k *-'- Project:•k P , Project #:• F J V Task:. Engineering, Science, and Technology Calculated:
Checked:
Bush Valley Landfill - Harford Cty, MD61131.013001JDM3*T-
Date:Date:
5/19/99£?/?/n
TR-55 Worksheet #2: Runoff Curve Number and Runoff
j of Development: Original / Existing Conditions in 1986 - DRAINAGE AREA NO. 1aqe Area Description: DRAINAGE AREA NO. 1 - TO DRAINAGE BOUNDARY (Area = 4.6 Ac.)
Project: Bush Valley Landfill - Harford Cty^MD ' \Project». 61131.01 , I
Task: 3001_____EA Engineering, Science, and Technology Calculated: JDM Date:
__ Checked: &&T~ Date:Stage of Development: Original / Existing Conditions in 1986 - DRAINAGE AREA Md.
Drainage Area Description: DRAINAGE AREA NO. 1 - TO DRAINAGE BOUNDARY (Ar
TR-55 Worksheet #3: Time of Concentration (Tc) or Travel Time (Tt)
Sheet Flow1 Surface Description (Table 3-1)2 Manning's Roughness Coeff., n (Table 3-1 )3 Flow Length, L (total L <= 300 ft)4 Two year 24 hour Rainfall, P25 Land Slope, s6Tt
Segment
ftinft/fthr
A1B1bare soil
0.0111003.2
0.0200.020 0.000 o.ooo
^
-' *«
0.0:?•?
Shallow Concentrated Flow7 Surface Description (1=paved. 2=unpaved)8 Flow Length, L9 Watercourse Slope, s10 Average Velocity, V (Fig. 3-1)11 Tt
Segment
ftft/ftft/shr
B1C1260
0,0924.890,003
C1D1270
0.1436.100.003
D1E1280
0.2387.870.003
•\
0.0
Channel FlowBottom width of trapezoidal channelDepth of trapezoidal channelSide slopes of trapezoidal channel (?H:1 V)
1 Drainage Area, AmRunoff Curve Number, CN (worksheet #2)Time of Concentration, Tc (worksheet #3)Rainfall Distribution Type (I, IA, II. Ill)Pond and Swamp Areas SpreadThroughout Watershed
sq mi
hr
%Am
2 Frequency3 Rainfall, P (24 hour)4 Initial Abstraction, la (Table 4-1)5 la/P6 Unit Peak Discharge, qu (Exhibit 4-II)7 Runoff, Q (worksheet 2)8 Pond & Swamp Adjustment Factor, Fp
Engineering, Science, and Technology Calculated:Checked:
Bush Valley Landfill - Harford Cty, MD61131.013001JDMfi#r Date:
Date:5/19/99
5// /< c
TR-55 Worksheet #2: Runoff Curve Number and Runoff
= of Development: Original / Existing Conditions in 1986 - DRAINAGE AREA NO. 2aqe Area Description: DRAINAGE AREA NO. 2 - TO DRAINAGE BOUNDARY (Area = 2.7 Ac.)
Checked: ClAT ___________ Date: ?jrf/£t<f ~~[Stage of Development: Original / Existing Conditions in 1986 - DRAINAGE AREA NO.
Drainage Area Description: ____ DRAINAGE AREA NO. 2 • TO DRAINAGE BOUNDARY (Area =
TR-55 Worksheet #3: Time of Concentration (Tc) or Travel Time (Tt)
Sheet Flow1 Surface Description (Table 3-1)2 Manning's Roughness Coeff.. n (Table 3-1)3 Flow Length, L {total L <- 300 ft)4 Two year 24 hour Rainfall, P25 Land Slope, s6Tt
Segment
ftinft/fthr
A2B2bare soil
0.0111003.2
0.0440.015 0.000 0.000
rJ
nuO.Q1E
Shallow Concentrated Flow7 Surface Description (1=paved, 2=unpaved)8 Flow Length, L9 Watercourse Slope, s10 Average Velocity, V (Fig. 3-1)11 Tt
Segment
ftft/ftft/shr
B2C22
2900.0583.89
0.021
C2D22
1250.1606.450.005
D2E2235
0.0714.300.002
• i
- i
•-10.02J• *
Channel FlowBottom width of trapezoidal channelDepth of trapezoidal channelSide slopes of trapezoidal channel (?H:1V)
1 Drainage Area, AmRunoff Curve Number, CN (worksheet #2)Time of Concentration, Tc (worksheet #3)Rainfall Distribution Type (I, IA, II, III)Pond and Swamp Areas SpreadThroughout Watershed
sq mi
hr
%Am
2 Frequency3 Rainfall, P (24 hour)4 Initial Abstraction, la (Table 4-1)5 la/P6 Unit Peak Discharge, qu (Exhibit 4*ll)7 Runoff, Q (worksheet 2)8 Pond & Swamp Adjustment Factor, Fp
^ J v- Project:^ V ^ Project #:••vl V Task:L Engineering, Science, and Technology Calculated:
Checked:
Bush Valley Landfill - Harford Cty. MD61131.013001JDMMT
Date:Date:
5/19/995//<;Aw
TR-55 Worksheet #2: Runoff Curve Number and Runoff
j of Development: Original / Existing Conditions in 1986 - DRAINAGE AREA NO. 3iaqe Area Description: DRAINAGE AREA NO. 3 - TO DRAINAGE BOUNDARY (Area = 3.4 Ac.)
._____________________________Checked: (fftf___________Date: £T// *jkfi iStage of Development: Original / Existing Conditions in 1986 - DRAINAGE AREA NO. 3
Drainage Area Description: DRAINAGE AREA NO. 3 -TO DRAINAGE BOUNDARY (Area = 3. ;?—————
TR-55 Worksheet #3: Time of Concentration (Tc) or Travel Time (Tt)
Sheet Flow1 Surface Description (Table 3-1 )2 Manning's Roughness Coeff., n (Table 3-1)3 Flow Length, L (total L <= 300 ft)4 Two year 24 hour Rainfall, P25 Land Slope, s6Tt
Segment
ftinft/fthr
A3B3bare soil
0.0111053.2
0.0440.015 0.000 0.000
————— - ———————— i
*r '
0.015w
Shallow Concentrated Flow7 Surface Description (1=paved, 2=unpaved)8 Flow Length. L9 Watercourse Slope, s10 Average Velocity, V (Fig. 3-1)11 Tt
Segment
ftft/ftft/shr
B3C3275
0.0674.180.005
C3D3280
0.1756.750.003
D3E3235
0.3439.45
0.001
i
0.009
Channel FlowBottom width of trapezoidal channelDepth of trapezoidal channelSide slopes of trapezoidal channel (?H:1V)
1 Drainage Area, AmRunoff Curve Number, CN (worksheet #2)Time of Concentration, Tc (worksheet #3)Rainfall Distribution Type (1, IA. II, III)Pond and Swamp Areas SpreadThroughout Watershed
sqmi
hr
%Am
2 Frequency3 Rainfall. P (24 hour)4 Initial Abstraction, la (Table 4-1)5 la/P6 Unit Peak Discharge, qu (Exhibit 4-II)7 Runoff, Q (worksheet 2)8 Pond & Swamp Adjustment Factor, Fp
iH& A ' Project:_____^7^^ Project #:••rl P Task:Engineering, Science, and Technology Calculated:
Checked:
Bush Valley Landfill - Harford Cty, MD61131.013001JDM&&T
Date:Date:
5/19/99fT//«W<
TR-55 Worksheet #2: Runoff Curve Number and Runoff
of Development: Original / Existing Conditions in 1986 - DRAINAGE AREA NO. 4iqe Area Description: DRAINAGE AREA NO. 4 - TO DRAINAGE BOUNDARY (Area - 3.1 Ac.)
impervious; unconnected/connectedimpervious area ratio)
Disturbed stripped earth(represents approx. 75% of site area)Brush - brush, weed, grass combo, (good condtn.)
CN
Table2-287
65
Fig-2-3
Fig.2-4
Totals
Use CN =
Area(acres)
2.33
0.78
3.10
CN'Area202
50
0
0
0
0
0
0
0
0
253
82
Frequency (years)24 Hour Rainfall, P (in)Runoff, Q (in)(use P and CN with Table 2-1 ,Fig. 2-1, or Eqn. 2-3 and 2-4)
Storm #123.21.50
Storm #254.22.33
Storm #3105.13.12
Storm #4255.53.48
Storm #51007.25.05
RROOOU6UDA4-1986existing.XLS
EA
•BL_fl ^ Project:•L P ^ Project #.• rV P Task:Engineering, Science, and Technology calculated:
Checked:
Bush Valley Landfill - Harford Cty. MD61131.013001JDMfatr
Date:Date:
—————— . ———— - j
5/1 9/<*flrtffi < \
Stage of Development: Original / Existing Conditions in 1986 - DRAINAGE AREA NO* IDrainage Area Description: DRAINAGE AREA NO. 4 - TO DRAINAGE BOUNDARY (Area = ; 1
J —————— JTR-55 Worksheet #3: Time of Concentration (Tc) or Travel Time (Tt)
• »Sheet Flow
123456
Surface Description (Table 3-1)Manning's Roughness Coeff., n (Table 3-1)Flow Length, L (total L <= 300 ft)Two year 24 hour Rainfall, P2Land Slope, sTt
1 Drainage Area, AmRunoff Curve Number, CN (worksheet #2)Time of Concentration, Tc (worksheet #3)Rainfall Distribution Type (1, IA, II, III)Pond and Swamp Areas SpreadThroughout Watershed
sqmi
hr
%Am
2 Frequency3 Rainfall, P (24 hour)4 Initial Abstraction, la (Table 4-1)5 la/P6 Unit Peak Discharge, qu (Exhibit 4-II)7 Runoff, Q (worksheet 2)8 Pond & Swamp Adjustment Factor, Fp
••k.^ Project:___ F , Project #:•Fvv Task:Engineering, Science, and Technology Calculated:
Checked:
Bush Valley Landfill - Harford Cty, MD61131.013001JDM6 r
Date:Date-
5/19/99J/fej/tft
TR-55 Worksheet #2: Runoff Curve Number and Runoff
: of Development: Original / Existing Conditions in 1986 - DRAINAGE AREA NO. 5age Area Description: DRAINAGE AREA NO. 5 - TO DRAINAGE BOUNDARY (Area = 1 .0 Ac.)
1 Drainage Area, AmRunoff Curve Number, CN (worksheet #2)Time of Concentration, Tc (worksheet #3)Rainfall Distribution Type (I, tA, II, HI)Pond and Swamp Areas SpreadThroughout Watershed
sqmi
hr
%Am
2 Frequency3 Rainfall, P (24 hour)4 Initial Abstraction, la (Table 4-1)5 la/P6 Unit Peak Discharge, qu (Exhibit 4-II)7 Runoff, Q (worksheet 2)8 Pond & Swamp Adjustment Factor, Fp
Subject l).A. FjffSr/AJt S -r'* f &&*-*) Sheet No. _____/ of k£ -7—___ Drawing No. _________
7) /4-
Project No.Sheet No.
Drawing No.Date ^/» Checked by <7 Dale
go„
n
t ' '
EA 02B9B HV95
;**ili/c6
^ •L_fl& ' Project:^ LjV ^ Project n:^ ^ _ BC__ Bmiv v Task;\ Engineering, Science, and Technology Calculated:
Checked:
Bush Valley Landfill - Harford Cry, MD61131.013001JDM£fl0nr
Date:Date:
5/18/99*> \<>\W\
TR-55 Worksheet #2: Runoff Curve Number and Runoff
Jtage of Development: Proposed / Developed Conditions - DRAINAGE AREA NO. 1lage Area Description: DRAINAGE AREA NO. 1 - TO DRAINAGE BOUNDARY (Area = 3.3 Ac.)
impervious; unconnected/connectedimpervious area ratio)
Meadow- continuous grasses
Gravel Access Road and Turn-around
CN
Table2-274
89
Fig.2-3
Fig.2-4
Totals
Use CN =
Area(acres)
3.24
0.06
3.30
CN'Area240
5
0
0
0
0
0
0
0
0
245
74
Frequency (years)24 Hour Rainfall, P (in)Runoff, Q (in)(use P and CN with Table 2-1 ,Fig. 2-1, or Eqn. 2-3 and 2-4)
Storm #123.21.05
Storm #254.21.76
Storm #3105.12.47
Storm #4255.52.79
Storm #51007.24.24
AROOOU70DA1-proposed.XLS "
Project: Bush Valley Landfill_-_Harford Cty, MDProject #: 61131.01
Task: 3001_____EA Engineering, Science, and Technology calculated: JDM____ Date:
Checked: \Stage of Development: Proposed / Developed Conditions - DRAINAGE AREA N*~Drainage Area Description: DRAINAGE AREA NO. 1 • TO DRAINAGE BOUNDARY (/ ••' 1;
TR-55 Worksheet #3: Time of Concentration (Tc) or Travel Time (Tt)
Sheet Flow1 Surface Description (Table 3-1)2 Manning's Roughness Coeff., n (Table 3-1)3 Flow Length, L (total L <~ 300 ft)4 Two year 24 hour Rainfall, P25 Land Slope, s6Tt
Segment
ftinft/fthr
A1B1dense grass
0.241003.2
0.0350.190 0.000 0.000
l
"1. j
Shallow Concentrated Flow7 Surface Description (1=paved, 2=unpaved)8 Flow Length, L9 Watercourse Slope, s10 Average Velocity, V (Fig. 3-1)11 Tt
Segment
ftft/ftft/shr .
B1C1235
0.1165.500.002
0.000.000
i
1>•
(Bench B-4) (Slope Drain 2) »• fChannel Flow
Bottom width of trapezoidal channelDepth of trapezoidal channelSide slopes of trapezoidal channel (?H:1V)
1 Drainage Area, AmRunoff Curve Number, CN (worksheet #2)Time of Concentration. Tc (worksheet #3)Rainfall Distribution Type (I. IA. II, III)Pond and Swamp Areas SpreadThroughout Watershed
sqmi
hr
%Am
2 Frequency3 Rainfall. P (24 hour)4 Initial Abstraction, la (Table 4-1)5 la/P6 Unit Peak Discharge, qu (Exhibit 4-ll)7 Runoff, Q (worksheet 2)8 Pond & Swamp Adjustment Factor, Fp
•k L ' pr°)ect:HL F , Project tt.^ •Fl V Task:A Engineering, Science, and Technology Calculated:
Checked:
Bush Valley Landfill - Harford Cty, MD61131.013001JDMfeflf
Date:Date:
5/18/995 \*\ *ft
TR-55 Worksheet #2: Runoff Curve Number and Runoff
Stage of Development: Proposed / Developed Conditions - DRAINAGE AREA NO. 2linage Area Description: DRAINAGE AREA NO. 2 - TO DRAINAGE BOUNDARY (Area = 3.9 Ac.)
Checked: fffi Date:Stage of Development: Proposed / Developed Conditions - DRAINAGE AREA NC
Drainage Area Description: DRAINAGE AREA NO. 2 - TO DRAINAGE BOUNDARY (Ai
TR-55 Worksheet #3: Time of Concentration (Tc) or Travel Time (Tt)
Sheet Flow1 Surface Description (Table 3-1)2 Manning's Roughness Coeff., n (Table 3-1)3 Flow Length. L (total L <= 300 ft)4 Two year 24 hour Rainfall, P25 Land Slope, s6Tt
Segment
ftmft/fthr
A2B2dense grass
0.241003.2
0.0350.190 0.000 0.000
;i
' \
Shallow Concentrated Flow7 Surface Description (1=paved, 2=unpaved)8 Flow Length, L9 Watercourse Slope, s10 Average Velocity, V (Fig. 3-1)11 Tt
Segment
ftft/ftft/shr
B2C2290
0.1225.640.004
0.000.000
• -
(Bench B-5) (Slope Drain 3)Channel Flow
Bottom width of trapezoidal channelDepth of trapezoidal channelSide slopes of trapezoidal channel (?H:1V)
1 Drainage Area, AmRunoff Curve Number, CN (worksheet #2)Time of Concentration, Tc (worksheet #3)Rainfall Distribution Type (I, IA. II, III)Pond and Swamp Areas SpreadThroughout Watershed
sq mi
hr
%Am
2 Frequency3 Rainfall, P (24 hour)4 Initial Abstraction, la (Table 4-1)5 la/P6 Unit Peak Discharge, qu (Exhibit 4-II)7 Runoff, Q (worksheet 2)8 Pond & Swamp Adjustment Factor, Fp
^ •k. ^ Project:l__HLj|r k Project #:^ •FV-V Task:EA Engineering, Science, and Technology Calculated:
Checked:
Bush Valley Landfill - Harford Cty, MD61131.013001JDMMX
Date:Date-
5/18/99i3rtl<ft
TR-55 Worksheet #2: Runoff Curve Number and Runoff
Stage of Development: Proposed / Developed Conditions - DRAINAGE AREA NO. 3Drainage Area Description: DRAINAGE AREA NO. 3 - TO DRAINAGE BOUNDARY (Area = 3.7 Ac.)
impervious; unconnected/connectedimpervious area ratio)
Meadow- continuous grasses
Gravel Access Road and Turn-around
CN
Table2-274
39
Fig.2-3
Fig.2-4
Totals
Use CN =
Area(acres)
3.64
0.06
3.70
CN'Area269
6
0
0
0
0
0
0
0
0
275
74
Frequency (years)24 Hour Rainfall, P (in)Runoff, Q (in)(use P and CN with Table 2-1 ,Fig. 2-1, or Eqn. 2-3 and 2-4)
Storm #123.21.05
Storm #254.21.76
Storm #3105.12.47
Storm #4255.52.79
Storm #51007.24.24
nA, «,« AROOOUUDA3-proposed.XLS
Project: Bush Valley Landfill - Harford Cty. MDProject ft 61131.01
Task: 3001'r
EA Engineering, Science, and Technology Calculated: JDM Date:Checked: (efltf "___________Date:
Stage of Development: Proposed / Developed'Conditions - DRAINAGE AREA NO. "Drainage Area Description: DRAINAGE AREA NO. 3 - TO DRAINAGE BOUNDARY (Art
TR-55 Worksheet #3: Time of Concentration (Tc) or Travel Time (Tt)
Sheet Flow1 Surface Description (Table 3-1)2 Manning's Roughness Coeff.. n (Table 3-1)3 Flow Length, L (total L <= 300 ft)4 Two year 24 hour Rainfall, P25 Land Slope, s6 Tt
Segment
ftinft/fthr
A3B3dense grass
0.241003.2
0.0550.159 o.ooo 0.000
• j
0."1
Shallow Concentrated Flow7 Surface Description (1=paved, 2-unpaved)8 Flow Length, L9 Watercourse Slope, s10 Average Velocity, V (Fig. 3-1)11 Tt
Segment
ftft/ftft/shr
B3C3265
0.0453.420.005
C3D3290
0.1786.810.004
D3E3255
0.2187.530.002
30.
Swale ,, „Channel Flow
Bottom width of trapezoidal channelDepth of trapezoidal channelSide slopes of trapezoidal channel (?H:1V)
1 Drainage Area, AmRunoff Curve Number, CN (worksheet #2)Time of Concentration, Tc (worksheet #3)Rainfall Distribution Type (1, IA. II, III)Pond and Swamp Areas SpreadThroughout Watershed
sq mi
hr
%Am
2 Frequency3 Rainfall. P (24 hour)4 Initial Abstraction, la (Table 4-1)5 la/P6 Unit Peak Discharge, qu (Exhibit 4-II)7 Runoff, Q (worksheet 2)8 Pond & Swamp Adjustment Factor, Fp
(Table 4-2, Fp = 1.0 for none)9 Peak Discharge, qp
Finin
csm/inin
cfs
0.00674
0.178II
0
1
Storm #12
3.20.6940.217775.41.05
1
4.71
Storm #25
4.20.6940.165801.51.76
1
8.17
Storm #3105.1
0.6940.13681 6.62.47
1
11.64
Storm #4255.5
0.6940.126821.82.79
1
13.27
Storm #5
„«. _, AROOOlt75DA3-proposed.
IHL ^ - Project:^ F k Project #:•FVV Task:
Engineering, Science, and Technology calculated:Checked:
Bush Valley Landfill - Harford Cty, MD61131.013001JDMfcftf
Date:Date:
5/18/99
Kl!«ll<tfStage of Development: Proposed / Developed Conditions - DRAINAGE AREA NO. 4" ' ' '
Drainage Area Description: DRAINAGE AREA NO. 4 - TO DRAINAGE BOUNDARY (Area = 2 8 Ac
TR-55 Worksheet #3: Time of Concentration (Tc) or Travel Time (Tt)
FlowSurface Description (Table 3-1)Manning's Roughness Coeff.. n (Table 3-1}Flow Length, L (total L <= 300 ft)Two year 24 hour Rainfall. P2Land Slope, sTt
Segment
ftinft/fthr
A4B4dense grass
0.241003.2
0.0350.190 0.000 0.000 0.190
N Concentrated FlowSurface Description (1=paved. 2=unpaved)Flow Length, LWatercourse Slope, sAverage Velocity, V (Fig. 3-1)Tt
Segment
ftft/ftft/shr
B4C4290
0.0894.810.005
C4D4270
0.2007.220.003
0.000.000 0.008
el FlowBottom width of trapezoidal channelDepth of trapezoidal channelSide slopes of trapezoidal channel (?H:1V)Cross Sectional Flow Area, aWetted Perimeter, pwHydraulic Radius, rChannel Slope, sManning's Roughness Coeff., nVFlow Length, LTt
1 Drainage Area, AmRunoff Curve Number, CN (worksheet #2)Time of Concentration. Tc (worksheet #3)Rainfall Distribution Type (I. IA, II, III)Pond and Swamp Areas SpreadThroughout Watershed
sq mi
hr
%Am
2 Frequency3 Rainfall. P (24 hour)4 Initial Abstraction, la (Table 4-1 )5 la/P6 Unit Peak Discharge, qu (Exhibit 4-II)7 Runoff, Q (worksheet 2)8 Pond & Swamp Adjustment Factor, Fp
(Table 4-2, Fp = 1.0 for none)9 Peak Discharge, qp
impervious; unconnected/connectedimpervious area ratio)
Meadow- continuous grasses
Gravel Access Road and Turn-around
CN
Table2-274
89
Fig-2-3
Fig.2-4
Totals
Use CN =
Area(acres)
2.75
0.05
2.80
Ti-. t' *
i
CN'Atoi2(* i
i
"1
'•• ^
t
74
Frequency (years)24 Hour Rainfall, P (in)Runoff, Q (in)(use P and CN with Table 2-1 ,Fig. 2-1, or Eqn. 2-3 and 2-4)
Storm #123.21.05
Storm #254.21.76
Storm #3105.12.47
Storm #4255.52.79
Storm *1 '/ '4.24
AR000477DA4-proposed.XLS
BBB ^ g Project:^ &jF ^ Project n.•• Fl V Task::A Engineering, Science, and Technology Calculated:
Checked:
Bush Valley Landfill - Harford Cty, MD61131.013001JDMfattf
Date:Date
5/18/99ffiftVft
TR-55 Worksheet #2: Runoff Curve Number and Runoff
Staqe of Development: Proposed / Developed Conditions - DRAINAGE AREA NO. 5Drainage Area Description: DRAINAGE AREA NO. 5 - TO DRAINAGE BOUNDARY (Area = 1.1 Ac.)
Stage of Development: Proposed / Developed Conditions - DRAINAGE AREA NO. 5Drainage Area Description: DRAINAGE AREA NO. 5 - TO DRAINAGE BOUNDARY (Are; / t
TR-55 Worksheet #3: Time of Concentration (Tc) or Travel Time (Tt)
Sheet Flow1 Surface Description (Table 3-1 )2 Manning's Roughness Coeff.. n (Table 3-1)3 Flow Length, L (total L « 300 ft)4 Two year 24 hour Rainfall, P25 Land Slope, s6Tt
Segment
ftinft/fthr
A5B5dense qrass
0.241003.2
0.0250.218 0.000 0.000
——————— - >
• \Ii
0.
Shallow Concentrated Flow7 Surface Description (1=paved, 2=unpaved)8 Flow Length, L9 Watercourse Slope, s10 Average Velocity, V (Fig. 3-1)11 Tt
Segment
ftft/ftft/shr
B5C5240
0.0383.150.004
C5D5260
0.1335.880.003
0.000.000
\
0(Bench B-2) (Slope Drain 1)
Channel FlowBottom width of trapezoidal channelDepth of trapezoidal channelSide slopes of trapezoidal channel (?H:1V)
1 Drainage Area. AmRunoff Curve Number, CN (worksheet #2)Time of Concentration, Tc (worksheet #3)Rainfall Distribution Type (1. IA, II, III)Pond and Swamp Areas SpreadThroughout Watershed
sq mi
hr
%Am
2 Frequency3 Rainfall, P (24 hour)4 Initial Abstraction, la (Table 4-1)5 la/P6 Unit Peak Discharge, qu (Exhibit 4-H)7 Runoff, Q (worksheet 2)8 Pond & Swamp Adjustment Factor, Fp
1 Drainage Area, AMRunoff Cine Number, CN (workahaat 92)Time of Concentration, Tc (workaheet *3)Rainfal Diatributen Type (1. IA. H. IH)Pond end Swamp Areaa Spread Throughout Watarahad
1 Drainage Area, AMRunoff Curve Number, CN (worksheet 92)T me of Concentration, Tc (workahaat *3)Rainfal Dietributen Type (I, IA, II, Ul)Pond and Swamp Area* Spreed Throughout Watarahed
TR-55 Worksheet #3: Time of Concentration (TJ or Travel Time (Tt)Drainage Area Description: Drainage Araa to Bench B-7
Sheet Flow1 Surface DaauipUuii (Table 3-1)2 Merming'e Roughnaaa Coeff., n (Table 3-1 )3 Flow Length. L (toW L <« 3X ft)4 Two year 24 hour Rainfal, P25 Land Slope, a6Tt
Segment
ftinftmhr
1-2DeneeGraM
0.241003.2
0.0400.180 O.OX 0.000 •
ShaBow Concentrated Flow7 Surface Doacripten (1 -paved, 2-unpaved)8 Flow Length. L9 Watercouree Stopa, a10 Average Velocity, V (Fig. 3-1)11 Tt
Segment
ftftmn/ehr
2-32
2650.0794.530.016
O.X0.000
O.XO.OX .1
BENCHChannal Flow
Bottom width of trapezoidal channelDepth of trapezoidal channel - (Depth of Flow)Side alopaa of trapezoidal channel (7H:1V)
TR-55 Worksheet *3: Time of Concentration (T«) or Travel Time (TODrainage Area Description: Drainage Aiea to Slope Drain SJ3.-2
ShsetFtow1 Surface Deecripten (Table 3-1)2 Mwwtfe Roughness Coaff., n (Table 3-1)3 Flow Length. L (totel L <« 300 ft)4 Two year 24 hour Rainfal, P25 Land Slope, s6Tt
Segment
fthnmhr
1-2Short QVM
0.15IX3.2
0.0400.124 O.OX 0.000
.
4 -
Shadow Concentrated Flow7 Surface Description (Icpaved, 2*unpeved)6 Flow Length. L9 Watercourse Slope, s10 Average Velocity. V (Fig. 3-1)11 Tt
Segment
nMlWerr
2-32X
0.1225.640.004
O.X0.000
O.X0.000
BENCH SLOPE DRAINChannel Flow
Bottom width of trapezoidel channalDepth of trapezoidal channel - (Depth of Flow)Side elopee of frapazoidal chemel (7H:1V)
1 Drainage Araa, AMRunoff Curve Number. CN (worksheet 92)Time of Concentration, Tc (workahaat *3)Rainfal Distribution Type (I, IA, II, III)Pond and Swamp Areas Spread Throughout Watershed
1 Drainage Area. AMRunoff Curve Number, CN (worksheet 92)line of uoncefwaoon, iciwonxaneeiKi)Rainfal Distribution Type (1, IA, II, III)Pond end Swamp Areas Spread Throughout Watershed
eqmi
hr
*Am
2 Frequency3 Rainfal. P (24 how)4 Initial Abstraction, t, (Table 4-1)5U/P6 Unit Peek Diectwge, q» (Exhfcit 4)7 Runoff. Q (worksheet 2)6 Pond ft Swwnp Adjustment Factor, F,(F,« 1.X for none)9 Peek Diacharge,
TR-55 Worksheet #3: Time of Concentration (Tc) or Travel TimeDrainage Area Description: Drainage Area to Diversion Channel - A
Sheet Flow1 Surface Description (Table 3-1)2 Manning's Roughness Coeff., n (Table 3-1)3 Row Length. L (total L <= 300 ft)4 Two year 24 hour Rainfall, P25 Land Slope, s6 Tt
Segment
ftinftmhr
A1B1Dense Grass
0.241003.2
0.0350.190 0.000 0.000
Shallow Concentrated Flow7 Surface Description (1=paved. 2=unpaved)8 Flow Length, L9 Watercourse Slope, s10 Average Velocity, V (Fig. 3-1)11 Tt
Segment
ftftrftft/shr
B1C1220
0.0503.610.002
o.oo0.000
0.000.000
Div. Channel - AChannel Flow
Bottom width of trapezoidal channelDepth of trapezoidal channel - (Depth of Flow)Side slopes of trapezoidal channel (?H:1 V)
1 Drainage Area, A,,,Runoff Curve Number, CN (worksheet #2)Time of Concentration, Tc (worksheet #3)Rainfall Distribution Type (1, IA. II, III)Pond and Swamp Areas Spread Throughout Watershed
^ Hfc 1 Project:B flE ^ Project ttHHUv l F Task:iA Engineering, Science, and Technology Calculated:
Checked:
Bush Valley Landfill - Harford Countv61131.013003JDM Date:
Date'9/28/1999
TR-55 Worksheet #3: Time of Concentration (Te) or Travel Time (T,)Drainage Area Description: Drainage Area to Diversion Channel - B
eet Flow1 Surface Description (Table 3-1)2 Manning's Roughness Coeff., n (Table 3-1)3 Flow Length, L (total L <= 300 tt)4 Two year 24 hour Rainfall, P25 Land Slope, s6 Tt
Segment
ftinft/fthr
A1B1Dense Grass
0.241003.2
0.0450.172 0.000 0.000 0.172
iallow Concentrated Flow7 Surface Description (1=paved, 2=unpaved)8 Flow Length. L9 Watercourse Slope, s10 Average Velocity, V (Fig. 3-1)11 Tt
Segment
ftft/ftft/shr
0.000.000
0.000.000
0.000.000 0.000
Div. Channel - Blannel Flow
Bottom width of trapezoidal channelDepth of trapezoidal channel - (Depth of Flow)Side slopes of trapezoidal channel (?H:1V)
1 Drainage Area, AmRunoff Curve Number, CN (worksheet #2)Time of Concentration, Tc (worksheet #3)Rainfall Distribution Type (1. IA, II, III)Pond and Swamp Areas Spread Throughout Watershed
BUSH VALLEY LANDFILL CLOSURE CAPCalculation of Radius of Influence for Vent Wells Based on Depth of Waste
For Q=1 CFMD(ft)ROI (ft)
1552
2045
2540
3037
3534
4032
4530
5028
For Q=5 CFMD(ft)ROI (ft)
ForQ=10D(ft)ROI (ft)
ForQ=12D(ft)ROI (ft)
ForQ=15D(ft)ROI (ft)
For Q=20D(ft)ROI (ft)
For Q=30D(ft)ROI (ft)
15116
CFM15163
CFM15179
CFM15200
CFM15231
CFM15283
20100
20141
20155
20173
20200
20245
2589
25127
25139
25155
25179
25219
3082
30116
30127
30141
30163
30200
3576
35107
35117
35131
35151
35185
4071
40100
40110
40123
40141
40173
4567
4594
45103
45116
45133
45163
5063
5089
5098
50110
50127
50155
flR000589
Appendix J
Well Abandonment Reports
flR000590
dim i ecnnoiogy J5 |_oveton Circ|eSparks, MO 21152
ie: 410-771-495011-4204
9 August 1999EA Project No. 61131.01
Mr. Hilary ThomtonU.S. EPA, Region 011650 Arch Street (3HS23)Philadelphia, Pennsylvania 19103-2029
Re: Remedial Design for Bush Valley LandfillHarford County, Maryland
Dear Mr. Thornton:
Enclosed for your review please find eight copies of the Well Abandonment Reports formonitoring wells MW-1, MW-2, MW-3, and MW-4 for the referenced project. Thesewells were abandoned in May 1999 in accordance with the Monitoring Well Installationand Well Abandonment Plan (EA, April 1999).
EA has also distributed copies of the enclosed materials to MDE and Harford County.
As always, please call me if you have any questions.
MARYLAND DEPARTMENT OP THE ENVIRONMENT, WATER MANAGEMENT ADMINISTRATION-,2500 BROENING HIGHWAY, BALTIMORE. MARYLAND 21224. (410) 631-3784 V
WATER WELL ABANDONMENT-SEALING REPORT FORM
fBMIT COMES OF COMPLETED FORM TO:COUNTY ENVIRONMENT AGENCY (contact MDE. WMA if address needed)WELL OWNERMDE, WATER MANAGEMENT ADMINISTRATION, WELL PROGRAM
WELL ABANDONED:____________________ (monih/day/year)
PERMIT NUMBER OF ABANDONED WELL (if any) HA 73 2 5 1 7
PERMIT NUMBER OF REPLACEMENT WELL ________11______H______
PERSON ABANDONING WELL: Jav Co iron WELL DRILLERS LICENSE NUMBER: JGD055_____CIRCLE: MWD/MSD/MGD
SIZE OF CASING:————5——— INCHES IN DIAMETER VOLUME OF MATERIAL USED
DEPTH OF WELL: 52' FEET DEEP
WAS ANTY CASING REMOVED? _£_ YES _________ NOif yes, length removed, in feet: _C£__!2S. cut to grade
WAS CASING RIPPED OR PERFORATED? JL YES ____ NO
FF.ET
FROM
52'
TO
CDCDCC
77 gallons water1034 Ibfi cement55 Ibs bentonite
_____________________ MWD/MSD/MCD S/9/99GNATURE- M ATER'TtoX' DHUMtfUKQB-SUPERVISINC SANITARIAN LICENSt * CIRCLE ONE DATEENV 828 JULY 1997 ' l M''H
MARYLAND DEPARTMENT OF THE ENVIRONMENT. WATER MANAGEMENT ADMINISTRATION2500 BROENING HIGHWAY. BALTIMORE MARYLAND 21224, (410) 631-3784
CDOCDcnVJDCO
WATER WELL ABANDONM&?WR^SNG REPORT FORM
SUBMIT COPIES OF COMPLETED FORM TO:COUNTY ENVIRONMENT AGENCY (contact MDE, WMA if address needed)WELL OWNERMDE, WATER MANAGEMENT ADMINISTRATION, WELL PROGRAM
DATE WELL ABANDONED:. 5/4799 _ M (-w.nthMsy>yMr)
PERMIT NUMBER OF ABANDONED WELL (if any) H A ~7 3 — 2
PERMIT NUMBER ™ REPLACEMENT WE1J. _ ——
PPPSON ABANDONING WELL: „ Jay Corron WFI i run
OWNER'S NAME* Harford County
WELL LOCATION: *"»Bh Valley Landfill \rotiNTY- Harford Co. \wRApp-TTnww- Abin^tdon -TAX MAP BLOT1C PARPH. ^ (/£<nmnn/Kinv- £j^FrnnN- i-OT- fc fE-*^FAPFfT »ri»n- RtT 7 >^
WAS ANfY CASING RFM^v-n? X Yps NOif ye*, length removed, in feet: __casing cut to grade
WAS CASING RIPReDMjPBRFORATED? X YES NO
//e±ad(V* f&d/< — — MGD046
LERS LICENSE NUMBER:cmci
SITE LOCATION MAP
& ^ *
LOG OF SEALING
5 2 6
JGD055£: MWD/M: .
MATERIAL
KEETMATERIAL —————— i —— —FROM D
entonite/cement 42 O1
VOLUME OF MATERIAL USEC
63 gallona water846 Iba. cement45 Ibs bentonite
MWD/MSD/MGDSIGNATURE -MASTER WELL CfclLLER OR SUPERVISING SANITARIAN LICENSE # CIRCLE ONE
8/9/99c r
MARYLAND DEPARTMENT OF THE ENVIRONMENT, WATER MANAGEMENT ADMINISTRATION2500 BROENING HIGHWAY. BALTIMORE, MARYLAND 2122*, (410) 631-3784
WATER WELL ABANDONMENT-S&*sayf>*2PORT FORM
JBMTT COPIES OF COMPLETED FORM TO:COUNTY ENVIRONMENT AGENCY (conUct MDE, WMA if address needed)WELL OWNERMDE. WATER MANAGEMENT ADMINISTRATION, WELL PROGRAM
4TP WEM. ABAVDOWPD. 5/7/99 (rn«nrh/H.y/year)
PFtfMTT NUMPFP OF APAWpONPri WPI i (if any) HA 7 3 252
PFRMTT VITUHPR OP RFPI J.PFMENT WET I
7
PERSON ABANDONING WELL: Jay Corron WEM. DRn.T.FRS TirFNSP. NUMBER: JGD055
owiMfR's NAMF- Harford County
WELL LOCATION: Bush valley Landtill IrniiNTV- Harford Co. \^JPABF*T TOWN- Ablnedon -v.TAX MAP mnnc pARrEi. V^ /}rs~ f j
VOLUME OF MATERIAL USED29 gallons water376 Ibs. cement20 Ibs. bentonite
MWD/MSD/MGD 8/9/99;NATURE-MASTER WELL DRJu.ER OR SUPERVISING SANITARIAN UCENSE # CIRCLE ONF. DATEW H5R JTJTY IQQl
MARYLAND DEPARTMENT OF THE ENVIRONMENT. WATER MANAGEMENT ADMINISTRATION2500 BROENTNG HIGHWAY, BALTIMORE. MARYLAND 21224, (410) 631 -3784
WATER WELL ABANDONMENT-SEALING REPORT FORM
SUBMIT COPIES OF COMPLETED FORM TO:COUNTY ENVIRONMENT AGENCY (contact MDE. WMA if address needed)WELL OWNERMDE, WATER MANAGEMENT ADMINISTRATION. WELL PROGRAM
DATE WET T ABANDONED- rfnnnrh/fl«w/w~.ri
* PERMIT NUMBER OF ABANDONED WELL (if any)
PERMFT NUMBER OP REPLACEMENT WELL
HA — 7 3— 2 5 2 8
— —
PERSON ABANDONING WELL: JayCorron WFM DPITTPPcrTrrwcCKrfrx.aicB. .TttlOSS
AR000595
OWNER'S NAMP- Harford County
* WELL LOCATION: Bush Valley LandfillCOUNTY- Harford Co.NEARP-T TDWN- AbinedonTAX MAP ... RLOCK _ PARrFISinmrVTSIOW-SECTION- I/YTrNEAREST ROAD- Rt . 7