PART I INTRODUCTION TO COST MANAGEMENT C H A P T E R F I V E Activity-Based Costing and Management After studying this chapter, you should be able to . . . Explain the strategic role of activity-based costing Describe activity-based costing (ABC), the steps in developing an ABC system, and the benefits and limitations of an ABC system Determine product costs under both the volume-based method and the activity-based method and contrast the two Explain activity-based management (ABM) Describe how ABC/M is used in manufacturing companies, service companies, and governmental organizations Use an activity-based approach to analyze customer profitability Identify key factors for successful ABC/M implementation Beware of little expenses. A small leak will sink a great ship. Benjamin Franklin This chapter has a lot to do with implementing the spirit of Benjamin Franklin’s observa- tion—in cost management terms—that it really does matter how accurately you calculate a cost. Why? Having accurate costs is important for a variety of reasons: a company might find that it has a difficult time determining which of its products is most profitable. Alterna- tively, it finds its sales increasing but profits declining and cannot understand why. Perhaps the company keeps losing competitive bids for products and services and does not understand why. In many cases, accurate cost information is the answer to these questions. Accurate cost information provides a competitive advantage. It helps a company or organization to develop and to execute its strategy by providing accurate information about the cost of its products and services, the cost of serving its customers, the cost of dealing with its suppliers, and the cost of supporting business processes within the company. 1. 2. 3. 4. 5. 6. 7. 120 Activity-based costing (ABC) is a method for determining accurate costs. While ABC is a relatively recent innovation in cost accounting, it is rapidly being adopted by companies across many industries and within government and not-for-profit organizations. Here is a quick ex- ample of how it works, and why it is important Suppose you and two friends (Joe and Al) have gone out for dinner to have pizza. You each order an individual size pizza, and Al suggests that you all order a plate of appetizers for the table. You and Joe figure you will have a bite or two of the appetizers, so you say OK. Dinner is great, but at the end Al is still hungry, so he orders another plate of appetizers and as before, eats all of it. When it is time for the check, Al sug- gests the three of you split the cost of the meal equally. Is this fair? Perhaps Al should offer to pay for the two appetizer plates. The individual pizzas are direct costs for each of you so that an equal share is fair, but while the appetizer plate was intended to be shared equally, it turns out that Al consumed most of it. LEARNING OBJECTIVE 1 Explain the strategic role of activity-based costing LEARNING OBJECTIVE 1 Explain the strategic role of activity-based costing The Strategic Role of Activity-Based Costing blo28155_ch05.indd 120 blo28155_ch05.indd 120 5/17/06 6:19:47 PM 5/17/06 6:19:47 PM
Transcript
PART
I IN
TRO
DU
CTIO
N T
O C
OST
MAN
AGEM
ENT
C H A P T E R F I V E
Activity-Based Costing and Management After studying this chapter, you should be able to . . .
Explain the strategic role of activity-based costing
Describe activity-based costing (ABC), the steps in developing an ABC system, and the benefi ts and limitations of an ABC system
Determine product costs under both the volume-based method and the activity-based method and contrast the two
Explain activity-based management (ABM)
Describe how ABC/M is used in manufacturing companies, service companies, and governmental organizations
Use an activity-based approach to analyze customer profi tability
Identify key factors for successful ABC/M implementation
Beware of little expenses. A small leak will sink a great ship.
Benjamin Franklin
This chapter has a lot to do with implementing the spirit of Benjamin Franklin’s observa-tion—in cost management terms—that it really does matter how accurately you calculate a cost. Why? Having accurate costs is important for a variety of reasons: a company might fi nd that it has a diffi cult time determining which of its products is most profi table. Alterna-tively, it fi nds its sales increasing but profi ts declining and cannot understand why. Perhaps the company keeps losing competitive bids for products and services and does not understand why. In many cases, accurate cost information is the answer to these questions. Accurate cost information provides a competitive advantage. It helps a company or organization to develop and to execute its strategy by providing accurate information about the cost of its products and services, the cost of serving its customers, the cost of dealing with its suppliers, and the cost of supporting business processes within the company.
1.
2.
3.
4.
5.
6.
7.
120
Activity-based costing (ABC) is a method for determining accurate costs. While ABC is a relatively recent innovation in cost accounting, it is rapidly being adopted by companies across many industries and within government and not-for-profi t organizations. Here is a quick ex-ample of how it works, and why it is important Suppose you and two friends (Joe and Al) have gone out for dinner to have pizza. You each order an individual size pizza, and Al suggests that you all order a plate of appetizers for the table. You and Joe fi gure you will have a bite or two of the appetizers, so you say OK. Dinner is great, but at the end Al is still hungry, so he orders another plate of appetizers and as before, eats all of it. When it is time for the check, Al sug-gests the three of you split the cost of the meal equally. Is this fair? Perhaps Al should offer to pay for the two appetizer plates. The individual pizzas are direct costs for each of you so that an equal share is fair, but while the appetizer plate was intended to be shared equally, it turns out that Al consumed most of it.
LEARNING OBJECTIVE 1 Explain the strategic role of activity-based costing
LEARNING OBJECTIVE 1 Explain the strategic role of activity-based costing
Chapter 5 Activity-Based Costing and Management 121
There are similar examples in manufacturing. Suppose you and Joe and Al are also product managers at a plant that manufactures furniture. Al is in charge of sofa manufacturing, Joe of dining room tables and chairs, and you are in charge of bedroom furniture. Each of your product lines has direct materials and labor costs that are traced directly to each of you. It is your responsibility to manage these direct costs. Also, there are indirect manufacturing costs (overhead) that cannot be traced to each product, including, the following activities: materials acquisition, materials storage and handling, product inspection, manufacturing supervision, job scheduling, equipment maintenance, and fabric cutting. What if the company decides to charge each of the three product managers a “fair share” of the total indirect cost using the ratio of units produced in a manager’s area to the total units produced for all managers? This approach is described in Chapter 4 and is commonly referred to as volume-based costing . Note that whether the proportions used are based on units of product, direct labor hours, or machine hours, each of these is volume-based.
But if, as is usually the case, the usage of these activities is not proportional to the number of units produced, then some managers will be overcharged and others undercharged under the volume-based approach. For example, suppose Al insists on more frequent inspections of his production; then he should be fairly charged a higher proportion of overhead (inspection) than that based on units alone. Moreover, why should you pay any portion of fabric cutting if your bedroom furniture does not require fabric?
Another consideration is that the volume-based method provides little incentive for the manager to control indirect costs. Unfortunately, the only way you could reduce your share of the indirect costs is to reduce your units produced (or hope that Joe and/or Al increase production)—not much of an incentive. On refl ection, the approach that charges indirect costs to product based on units produced does not provide very accurate product cost for you or Joe or Al and certainly does not provide the appropriate incentives for managing the indirect costs. The solution is to use activity-based costing to charge these indirect costs to the products, using detailed information on the activities that make up the indirect costs—the materials handling, inspection, fabric cutting, and materials handling. This chapter shows how to do it.
A good example of one of many success stories for ABC is the application of ABC at the U.S. Postal Service (USPS). The ABC application at USPS originated from the Postmaster General’s directive to develop a costing system that would help the USPS to become more competitive and to serve as a basis for comparing performance among the various mail-processing facilities. The initial ABC system used 58 work activities and nine cost objects. The cost objects included handling of letters, fl ats, small parcels, large parcels, priority mail, express mail, registered mail, large mail containers, and small mail containers. In the initial application at a single mail-processing facility, there was a reduction of 13% in total cost as a result of the improved understanding of cost behavior in the facility. The USPS also used ABC to determine the cost differences in processing payments from customers who used cash, checks, or credit cards and from this analysis determined that the low-cost approach was to use credit cards. The ABC-based analyses have helped the USPS to implement an effective, cost-competitive strategy.
Volume-based costing can be a strategic good choice for some fi rms. It is appropriate gener-ally when direct costs are the major cost of the product or service and activities supporting the production of the product or service are relatively simple, low-cost, and homogenous across different product lines. This may be the case, for example, for a commodity manufacturer that has one or a few very homogeneous product lines—for example, a fi rm that manufactures paper products or a fi rm that produces certain agricultural products. Similarly, a professional service fi rm (law fi rm, accounting fi rm) may not need ABC because labor costs for the pro-fessional staff are the largest cost of the fi rm, and labor is also easily traced to clients (the cost object). For fi rms other than these, the ABC approach is often preferred: the volume-based approach will cause signifi cant inaccuracies in the product costs—some products will be overcosted and others undercosted because the usage of activities is not in proportion to the volume of output.
To develop a costing system we need to understand relationships among resources, activities, and products or services. Resources are spent on activities and products or services are a result of activities. Many of the resources used in an operation can be traced to individual products or services and identifi ed as direct materials or direct labor costs. Most overhead costs relate only indirectly to fi nal products or services. Nevertheless, overhead costs are resources spent on a fi rm’s activities to manufacture products, provide services, or facilitate manufacturing. A good costing system identifi es costs with activities that consume resources and assign re-source costs to cost objects such as products, services, or intermediate cost pools based on activities performed for the cost objects.
Resources, Activities, Resource Consumption Cost Drivers, and Activity Consumption Cost Drivers Before discussing activity-based costing, we need to defi ne several important terms: activity, resource, cost driver, resource consumption cost driver, and activity consumption cost driver.
An activity is a specifi c task or action of work done. An activity can be a single action or an aggregation of several actions. For example, moving inventory from workstation A to worksta-tion B is an activity that may require only one action. Production set-up is an activity that may include several actions.
A resource is an economic element needed or consumed in performing activities. Sala-ries and supplies, for example, are resources needed or used in performing manufacturing activities.
A cost driver is a factor that causes or relates to a change in the cost of an activity. Because cost drivers cause or relate to cost changes, measured or quantifi ed amounts of cost drivers are excellent bases for assigning resource costs to activities and for assigning the cost of activities to cost objects.
A cost driver is either a resource consumption cost driver or an activity consumption cost driver . A resource consumption cost driver is a measure of the amount of resources consumed by an activity. It is the cost driver for assigning a resource cost consumed by or related to an activity to a particular activity or cost pool. Examples of resource consumption cost drivers are the number of items in a purchase or sales order, changes in product design, size of factory buildings, and machine hours.
An activity consumption cost driver measures the amount of an activity performed for a cost object. It is used to assign activity cost pool costs to cost objects. Examples of activity consumption cost drivers are the number of machine hours in the manufacturing of product X, or the number of batches used to manufacture Product Y.
What Is Activity-Based Costing? Activity-based costing (ABC) is a costing approach that assigns resource costs to cost objects such as products, services, or customers based on activities performed for the cost objects. The premise of this costing approach is that a fi rm’s products or services are the results of activities and activities use resources which incur costs. Costs of resources are assigned to activities based on the activities that use or consume resources (resource consumption driv-ers), and costs of activities are assigned to cost objects based on activities performed for the cost objects (activity consumption drivers). ABC recognizes the causal or direct relationships between resource costs, cost drivers, activities, and cost objects in assigning costs to activities and then to cost objects.
ABC assigns factory overhead costs to cost objects such as products or services by identifying the resources and activities as well as their costs and amounts needed to produce output. Using resource consumption cost drivers, a fi rm determines the resource costs consumed by activities or activity centers (activity cost pools) and calculates the cost of a unit of activity. The fi rm then assigns the cost of an activity to products or services by multiplying the cost of each activity by the amount of the activity consumed by each of the cost objects.
LEARNING OBJECTIVE 2 Describe activity-based costing (ABC), the steps in developing an ABC system, and the benefi ts and limitations of an ABC system
LEARNING OBJECTIVE 2 Describe activity-based costing (ABC), the steps in developing an ABC system, and the benefi ts and limitations of an ABC system
An activity is a specifi c task or action of work done.
An activity is a specifi c task or action of work done.
A resource is an economic element needed or consumed in performing activities.
A resource is an economic element needed or consumed in performing activities.
A resource consumption cost driver is an activity or characteristic that consumes resources.
A resource consumption cost driver is an activity or characteristic that consumes resources.
An activity consumption cost driver measures how much of an activity a cost object uses.
An activity consumption cost driver measures how much of an activity a cost object uses.
Activity-based costing (ABC) is a costing approach that assigns resource costs to a cost object based on activities performed for the cost object.
Activity-based costing (ABC) is a costing approach that assigns resource costs to a cost object based on activities performed for the cost object.
Chapter 5 Activity-Based Costing and Management 123
The Two-Stage Cost Assignment Procedure A two-stage cost assignment procedure assigns resource costs such as factory overhead costs to activity cost pools and then to cost objects to determine the amount of resource costs for each of the cost objects. Volume-based costing systems assign factory overhead costs fi rst to plant or departmental cost pools and second to products or services (see Exhibit 5.1 ). Volume-based systems, in the fi rst stage, charge factory overhead costs to a single plant cost pool or to departmental cost pools. This approach is convenient and simple, because many accounting systems in use today accumulate cost information by department, which is easily aggregated to the plant level. In the second stage, a volume-based rate (based on units produced or hours used in production) is then used to apply overhead to each of the cost objects. The volume-based approach is used in Chapter 4 in job costing. A volume-based two-stage cost assignment procedure, however, is likely to distort product or service costs. This is true especially in the second stage where the volume-based costing system uses a cost driver such as direct labor-hours or output units to assign factory overhead costs. Because all products or services do not always consume factory overhead resources in a cost pool in proportion to the volume-based measure or measures the fi rm uses to assign factory overhead costs, a volume-based system often leads to inaccurate measures for the costs of support activities in its operations. This distortion becomes more serious especially when a substantial portion of factory overhead costs is not output-volume related and the fi rm manufactures a diverse mix of products with differences in volumes, sizes, or complexities.
Activity-based costing systems differ from volume-based costing systems by tracing uses of resources to activities and linking activity costs to products, services, or customers (see Exhibit 5.2 ). The fi rststage assigns factory overhead costs to activities or activity cost centers (activity cost pools) by using appropriate resource consumption cost drivers. The secondstage assigns the costs of activities or activity cost pools to cost objects using appropriate activity consumption cost drivers that measure the demands cost objects place on the activities. By using cost drivers in both the fi rst and second stage cost assignments, activity-based costing systems provide more accurate measures of product or service costs for the cost of activities that are not proportional to the volume of outputs produced.
In summary, activity-based costing systems differ from volume-based costing systems in two ways. First, the ABC system defi nes cost pools as activities rather than production plant or department cost centers. Second, the cost drivers that the ABC system uses to assign acti-vity costs to cost objects are drivers based on an activity or activities performed for the cost object. The volume-based approach uses a volume-based cost driver that often bears little or no relationship to the consumption of resource cost by the cost objects.
A two-stage cost assignment assigns factory overhead costs to activity cost pools and then to cost objects.
A two-stage cost assignment assigns factory overhead costs to activity cost pools and then to cost objects.
Resources
Direct Materialsand Direct Labor
Indirect Costs(Overhead)
Cost Objects
Second Stage: Activitycost pools assigned tocost objects usingactivity consumptioncost drivers
First Stage: Direct materialsand labor assigned to costobjects; overhead costsassigned to activities usingresource consumptioncost drivers Cost Pools: The
activities in theplant
EXHIBIT 5.2 The Activity-Based Two-Stage Procedure
Resources
Direct Materialsand Direct Labor
Indirect Costs(Overhead)
Cost Pools: Theplant or thedepartments in theplant
Cost Objects
Second Stage: Plantlevel or departmentalcosts assigned to costobjects using volume-based cost drivers
First Stage: Directmaterials and laborassigned to cost objects;overhead costs assignedto department directly oraggregated to plant level
Developing an activity-based costing system entails three steps: (1) identifying resource costs and activities, (2) assigning resource costs to activities, and (3) assigning activity costs to cost objects. Steps one and two constitute stage 1 from Exhibits 5.1 and 5.2 , and Step 3 is equiva-lent to stage 2 from these exhibits.
Step 1: Identify Resource Costs and Activities The fi rst step in designing an ABC system is to conduct an activity analysis to identify the resource costs and activities of the fi rm. Most fi rms record resource costs in specifi c ac-counts in the accounting system. Examples of these accounts include supplies, purchasing, materials handling, warehousing, offi ce expenses, furniture and fi xtures, buildings, equip-ment, utilities, and salaries and benefi ts. However, special effort most likely will be needed to determine appropriate resource costs for activity-based costing because generally several different resource costs may be recorded in a single account or the costs for an activity may be recorded in several accounts. For example, a fi rm may use a single factory supplies ac-count for all supplies in its operations that include several manufacturing operations. Costs to complete a purchasing order may be spread over several accounts including accounts for warehousing, purchasing, and receiving.
Through activity analyses a fi rm identifi es the work it performs to carry out its operations. Activity analyses include gathering data from existing documents and records, as well as collecting additional data using questionnaires, observations, or interviews of key personnel. Questions that ABC project team members typically ask employees or managers in gathering activity data include:
• What work or activities do you do?
• How much time do you spend performing these activities?
• What resources are required to perform these activities?
• What value does the activity have for the product, service, customer, or organization?
With the help of industrial engineers and management accountants, the team also collects activity data by observing the work performed and making a list of all the activities involved.
Levels of Activities
To identify resource costs for various activities, a fi rm classifi es all activities according to the way in which the activities consume resources.
A unit-level activity is performed on each individual unit of product or service of the fi rm. Examples of unit-level activities include direct materials, direct labor-hours, inserting a
1. A unit-level activity is performed for each unit of the cost object.
A unit-level activity is performed for each unit of the cost object.
REAL-WORLD FOCUS Traditional Costing System Distorted Product Costs at Xi’an Electronics in China
Xi’an Electronics produces special electronics with more than 250 products that have in excess of 600 specifi cations. Researchers col-lected data for 25 of the company’s products during the last half of 1997 and grouped them into two product categories, high volume and low volume. They found that the unit conversion cost (direct labor and overhead) was 29.58 percent higher under traditional costing (using direct labor hours as the cost driver) than ABC (using 30 cost drivers)
for high-volume products and was 45.95 percent lower under tradi-tional costing than ABC for low-volume products. Their fi ndings show that traditional costing overestimates the costs of high-volume prod-ucts and underestimates the costs of low-volume products.
Source: Pingxin Wang, Qinglu Jin, and Dagang Ke, “Activity-Based Costing and Its Application in Chinese Enterprises,” China Accounting and Finance Review, March 2000, pp. 138–55.
The two-stage allocation procedure in an activity-based costing system identifi es clearly the costs of activities of a fi rm. The assignment of activity costs to cost objects uses a measure or measures that represent the demands the cost objects make on activities of the fi rm. As a result, activity-based costing systems report more accurate product or service costs than tradi-tional volume-based costing systems do.
Steps in Developing an Activity-Based Costing System
Chapter 5 Activity-Based Costing and Management 125
component, and inspecting every unit. A unit-level activity is volume-based. The required activity varies in proportion with the quantity of the cost object. The resource consump-tion driver and the activity consumption driver are most likely to be the same for unit level activities.
A batch-level activity is performed for each batch or group of units of products or services. A fi rm incurs a batch-level activity for each batch or group of units of products or services scheduled to be processed together, rather than for each individual unit of the cost object. A batch has more than one unit of a product or service. Examples of batch-level activities are setting up machines, placing purchase orders, scheduling production, conducting inspec-tions by batch, handling materials, and expediting production.
A product-level activity supports the production of a specifi c product or service. Examples of product-sustaining activities include designing products, administering parts required for products, and engaging in engineering changes to modify products.
A facility-level activity supports operations in general. These activities are not caused by products or customer service needs and cannot be traced to individual units, batches, or products. Examples of facility sustaining activities include providing security and safety, performing maintenance of general purpose machines, managing the plant, incurring fac-tory property taxes and insurance and closing of the books each month. Some fi rms refer to these activities as business or infrastructure sustaining activities.
Note that a unit-level activity can always be traced to a batch (one of the units in the batch), and a batch-level activity can always be traced to a product (one batch of this particular prod-uct), and a product-level activity can always be traced to a manufacturing facility; but, the reverse is not possible. Exhibit 5.3 illustrates activity level classifi cations at Siemens Electric Motor Works.
Step 2: Assign Resource Costs to Activities Activity-based costing uses resource consumption cost drivers to assign resource costs to activities. Because activities drive the cost of resources used in operations, a fi rm should choose resource consumption cost drivers based on cause-and-effect relationships. Typical resource consumption cost drivers include the number of (1) labor hours for labor intensive activities; (2) employees for payroll-related activities; (3) setups for batch-related activities; (4) moves for materials-handling activities; (5) machine-hours for machine repair and mainte-nance; and (6) square feet for general maintenance and cleaning activities.
Although a fi rm’s accounting system is a good starting point to fi nd information about the cost of resources, most accounting systems report the costs of different resources, such as indirect labor, electricity, equipment, and supplies, but do not report the cost of activi-ties performed. New accounting systems are needed to obtain and track resource costs for activities.
The cost of the resources can be assigned to activities by direct tracing or estimation. Direct tracing requires measuring the actual usage of resources by activities. For example, power used to operate a machine can be traced directly to that machine‘s operation by reading the meter attached to the machine.
When direct tracing is not available, department managers and supervisors need to estimate the amount or percentage of time (or effort) employees spend on each identifi ed activity.
Multiple resource consumption cost drivers often are needed to assign different resource costs to activity or activity center cost pools. Exhibit 5.4 illustrates resources and resources consumption drivers for factory overhead costs at AT&T’s New River Valley plant.
2.
3.
4.
A batch-level activity is performed for each batch or group of products or services.
A batch-level activity is performed for each batch or group of products or services.
A product-level activity supports the production of a specifi c product or service.
A product-level activity supports the production of a specifi c product or service.
A facility-level activity supports the operation in general.
A facility-level activity supports the operation in general.
Activity Activity Level
Direct materials UnitDirect labor-hours UnitMachine-hours UnitNumber of production orders BatchNumber of special components Batch
EXHIBIT 5.3Activities and Activity Levels at Siemens Electric Motor Works
Step 3: Assign Activity Costs to Cost Objects The fi nal step is to assign costs of activities or activity cost pools to cost objects based on the appropriate activity consumption cost drivers. Outputs are the cost objects for which fi rms or organizations perform activities. Typical outputs for a cost system are products and services; however, outputs also can include customers, projects, or business units. For example, the outputs of an insurance company may be individual insurance policies sold to customers, claims processed, types of policies offered, insurance agents, or divisions or subunits of the company.
Firms use activity consumption cost drivers to assign activity costs to cost objects. Acti-vity cost drivers should explain why the cost of a cost object goes up or down. Typical activity consumption cost drivers are purchase orders, receiving reports, inspection reports or hours, parts stored, payments, direct labor-hours, machine-hours, and setups and manufacturing cycle time. Careful analyses should be conducted in determining proper activity consumption cost drivers. For example, at the Hewlett-Packard (HP)’s Surface Mount Center in Boise, the ABC system has been fully operational since the early 1990s. This facility manufactures about 50 electronic circuit boards for internal HP customers. The center’s accounting, production, and engineering staffs jointly conducted an intense analysis of the production process and cost behavior patterns to select cost drivers. This combination of accounting and engineering analysis helped management choose cost drivers.
Since the 1980s an increasing number of fi rms have adopted the activity-based costing system. These fi rms adopt ABC because of the benefi ts it offers.
Benefi ts Initially, many fi rms adopt activity-based costing to reduce distortions in product costs often found in their volume-based costing systems. Volume-based costing systems, generate pro-duct or service costs bearing little or no relationship to activities and resources consumed in operations. ABC clearly shows the effect of differences in activities and changes in products or services on costs. Among the major benefi ts of activity-based costing that many fi rms have experienced are:
Better profi tability measures. ABC provides more accurate and informative product costs, leading to more accurate product and customer profi tability measurements and to better-informed strategic decisions about pricing, product lines, and market segments.
Better decision making. ABC provides more accurate measurements of activity-driving costs, helping managers to improve product and process value by making better product design decisions, better customer support decisions, and fostering value enhancement projects.
Process improvement. The ABC system provides the information to identify areas where process improvement is needed.
1.
2.
3.
Benefi ts and Limitations of Activity-Based Costing
Resource Resource Consumption Cost Driver
Personnel Number of workersStoreroom Number of items picked for an orderEngineers Time workedMaterials management Time workedAccounting Time workedResearch and development Number of new codes developedQuality Time workedUtilities Square-footage
EXHIBIT 5.4Resource and Resource Consumption Cost Drivers at AT&T’s New River Valley Plant
Cost estimation. Improved product costs lead to better estimates of job costs for pricing decisions, budgeting, and planning.
Cost of unused capacity. Since many fi rms have seasonal and cyclical fl uctuations in sales and production, there are times when plant capacity is unused. This can mean that costs are incurred at the batch-, product-, and facility-level activities but are not used . Capacity is supplied but not used in production ABC systems provide better information to identify the cost of unused capacity and maintain a separate accounting for this cost. For example, if a particular customer’s order requires the addition of a certain type of capacity in the plant, then the customer can be charged for that additional capacity. Alternatively, if a plant manager decides to add capacity in expectation of future increases in sales and production, then the cost of that additional capacity should not be charged to current production but charged as a lump sum in the plant’s costs. Overall, the goal is to manage capacity levels to reduce the cost of underutilization of capacity and to price products and services properly.
Limitations Although activity-based costing provides better product or service costs than volume based systems, managers should be aware of its limitations:
Allocations. Not all costs have appropriate or unambiguous activity or resource consump-tion cost drivers. Some costs require allocations to departments and products based on arbitrary volume measures because fi nding the activity that causes the cost is impractical. Examples are facility-sustaining costs such as the costs of the information system, factory manager’s salary, factory insurance, and property taxes for the factory.
Omission of costs. Product or service costs identifi ed by an ABC system are likely to not include all costs associated with the product or service. Product or service costs typically do not include costs for such activities as marketing, advertising, research and develop-ment, and product engineering even though some of these costs can be traced to individual products or services. Product costs do not include these costs because generally accepted accounting principles (GAAP) for fi nancial reporting require them to be treated as period costs.
Expense and time. An ABC system is not cost free and is time-consuming to develop and implement. For fi rms or organizations that have been using a traditional volume-based costing system, installing a new ABC system is likely to be very expensive. Furthermore, like most innovative management or accounting systems, ABC usually requires a year or longer for successful development and implementation.
4.
5.
1.
2.
3.
REAL-WORLD FOCUS Who Uses ABC and Why?
A 2001 survey of 166 users of ABC costing reported that most adopters used ABC to improve product costing, to assist in cost reduction, and to better assess the profi tability of its products and customers. Other common uses were for process improvement, cost estimation, pric-ing, and performance measurement. Many of the surveyed fi rms are in the manufacturing industry, and ABC was critical in fi nding compe-tition responses to industry price competition, identifying unprofi table products, and identifying unprofi table customers.
The survey also reported a signifi cant diversity among these fi rms in the number of activities, cost objects, and cost drivers. While some fi rms had several thousand activities in their ABC system, the majority had between 25 and 250. Also, while some fi rms had several thousand cost objects, most had fewer than 100. The most common number of resource and activity cost drivers was occasionally over 100 but for most fi rms was between 6 and 10.
A 2005 survey of the members of BetterManagement.com vali-dated these results. Drawn from 528 responses from the fi nancial services industry, manufacturing, and communications and public service sectors, the survey found that improved product costing, bet-ter analysis of both product and customer profi tability, and process improvement were the key goals of the ABC system. The usage of ABC was comparable across industries, though the manufacturing and fi nancial services industries placed more emphasis on product and customer profi tability, while in the public sector the key emphasis was on product costing and process improvement.
Source: Dan Swenson and Douglas Barney, “ABC/M: Which Companies Have Success?” The Journal of Corporate Accounting and Finance, March/April 2001, pp. 35–44.BetterManagement.com provides online resources for performance manage-ment (http://www.bettermanagement.com/). It is a wholly owned subsidiary of SAS Institute, Inc.
The following example contrasts Steps 2 and 3 of the volume-based costing system using direct labor-hours as the cost driver with an activity-based costing system that uses both volume-based and activity-based cost drivers.
Haymarket BioTech, Inc. (HBT) produces and sells two secure communication systems, AW (Anywhere) and SZ (SecureZone). AW uses satellite technology and allows parties whose DNA is implanted in the device to communicate anywhere on the earth. SZ uses similar tech-nology except it allows communication between two parties who are within 10 miles of each other. HBT has the following operating data for the two products:
AW SZ
Production volume 5,000 20,000 Selling price $400.00 $200.00 Unit direct materials and labor $200.00 $ 80.00 Direct labor-hours 25,000 75,000 Direct labor-hours per unit 5 3.75
Volume-Based Costing The volume-based costing system that the fi rm uses assigns factory overhead (OH) based on direct labor-hours (DLH). The fi rm has a total budgeted overhead of $2,000,000. Since the fi rm budgeted 100,000 direct labor hours for the year, the overhead rate per direct labor hour is $20 per direct labor hour.
Total overhead $2,000,000 Total DLH 25,000 + 75,000 = 100,000 Overhead rate per DLH $ 20.00
Since the fi rm uses 25,000 direct labor hours to manufacture 5,000 units of AW, the factory overhead assigned to AW is $500,000 in total and $100 per unit:
Total OH assigned to AW $20 × 25,000 = $500,000 Number of units of AW 5,000 Factory overhead per unit of AW $ 100.00
The factory overhead for SZ is $1,500,000 in total and $75 per unit since the fi rm spent 75,000 direct labor hours to manufacture 20,000 units of SZ:
Total OH assigned to SZ $20 × 75,000 = $1,500,000 Number of units of SZ 20,000 Factory overhead per unit of SZ $ 75.00
In Exhibit 5.5 we show a product profi tability analysis using the fi rm’s volume based costing system.
LEARNING OBJECTIVE 3 Determine product costs under both the volume-based and the activity-based methods, and contrast the two
LEARNING OBJECTIVE 3 Determine product costs under both the volume-based and the activity-based methods, and contrast the two
A Comparison of Volume-Based and Activity-Based Costing
AW SZ
Unit selling price $400 $200Unit product cost:Direct materials and labor $200 $80Factory overhead 100 75Cost per unit 300 155 Unit margin $100 $ 45
EXHIBIT 5.5Product Profi tability Analysis under Volume-Based Costing
Chapter 5 Activity-Based Costing and Management 129
Activity-Based Costing In using an activity-based costing, HBT has identifi ed the following activities, budgeted costs, and activity consumption cost drivers:
Engineering $ 125,000 Engineering hours Setups 300,000 Number of setups Machine running 1,500,000 Machine-hours Packing 75,000 Number of packing orders Total $2,000,000
HBT also has gathered the following operating data pertaining to each of its products:
AW SZ Total
Engineering hours 5,000 7,500 12,500 Number of setups 200 100 300 Machine-hours 50,000 100,000 150,000 Number of packing orders 5,000 10,000 15,000
Using the gathered data, the cost driver rate for each activity consumption cost driver is calculated as follows:
Benefi ts of activity-based costing systems are not limited to improving product costings. After having an activity-based costing system in place, management often discovers that informa-tion from a well-designed ABC system helps to increase both the value customers received and the profi ts to the fi rm, especially for fi rms that embrace activity-based management.
What Is Activity-Based Management? Activity-Based Management (ABM) manages activities to improve the value of products or services to customers and increase the fi rm’s competitiveness and profi tability. ABM draws on ABC as its major source of information and focuses on the effi ciency and effectiveness of key business processes and activities. Using ABM, management can pinpoint avenues for impro-ving operations, reducing costs, or increasing values to customers. By identifying resources spent on customers, products, and activities, ABM improves management’s focus on the fi rm’s critical success factors and enhances its competitive advantage.
ABM applications can be classifi ed into two categories: operational ABM and strategic ABM. Operational ABM enhances operation effi ciency and asset utilization and lowers costs; its focuses are on doing things right and performing activities more effi ciently. Operational
Exhibit 5.6 presents a product profi tability analysis under the activity-based costing system and Exhibit 5.7 compares product costs and profi t margins under the two costing systems.
Remember that one major limitation of a volume-based costing system is that it tends to undercost complex low-volume products and overcost high-volume products. The activity-based costing system presents a more accurate measurement of product costs by tracing over-head consumption. The preceding comparison shows that the volume-based product costing system signifi cantly undercosts AW (a low-volume product) and overcosts SZ (a high-volume product) when considering the actual overhead consumptions of the two products. This is sometimes called cross-subsidization , that is, the cost accounting subsidizes some products at the expense of others. Distorted or inaccurate product costing can lead to inappropriate inven-tory valuations, unrealistic pricing, ineffective resource allocations, misplaced strategic focus, misidentifi ed critical success factors, and lost competitive advantage.
Activity-Based Management
AW SZ
Unit selling price $400 $200.00Unit product cost Direct materials and labor $200 $80.00 Factory overhead: Engineering $ 10 $ 3.75 Setups 40 5.00 Machine running 100 50.00 Packing 5 155 2.50 61.25Cost per unit 355 141.25 Unit margin $ 45 $ 58.75
EXHIBIT 5.6Product Profi tability Analysis under the ABC Costing System
Chapter 5 Activity-Based Costing and Management 131
Critical Questions ABC/M Tools
What do we do? Activity analysisHow much does it cost? Activity-based costingHow well do we do it? Performance measurementHow can we do it better? Benchmarking, total quality management, business process
improvement, reengineering, and value-added analysis
EXHIBIT 5.8The Role of ABC/M Tools
ABM applications use management techniques such as activity management, business pro-cess reengineering, total quality management, and performance measurement.
Strategic ABM attempts to alter the demand for activities and increase profi tability through improved activity effi ciency. Strategic ABM focuses on choosing appropriate activities for the operation, eliminating nonessential activities and selecting the most profi table customers. Strategic ABM applications use management techniques such as process design, customer profi tability analysis, and value chain analysis.
Exhibit 5.8 illustrates questions that strategic and operational ABC/ABM (ABC/M) can help to answer and the tools that are used. Some of the key tools of ABC/M are activity analy-sis, activity-based costing, performance measurement (covered in Chapters 17 and 18), and several contemporary management techniques explained in Chapter 1: benchmarking, total quality management, business process improvement, and reengineering. Another technique, value-added analysis, is explained here. We take a look now at activity analysis and value-added analysis.
Activity Analysis To be competitive a fi rm must assess each of its activities based on its need by the product or customer, its effi ciency, and its value content. A fi rm performs an activity for one of the following reasons:
It is required to meet the specifi cation of the product or service or satisfy customer demand.
It is required to sustain the organization.
It is deemed benefi cial to the fi rm.
Examples of activities required to sustain the organization are providing plant security and compliance with government regulations. Although these activities have no direct effect on the product or service or customer satisfaction, they cannot be eliminated. Examples of discretionary activities deemed benefi cial to the fi rm include a holiday party and free coffee. Exhibit 5.9 depicts an activity analysis.
Value-Added Analyses Eliminating activities that add little or no value to customers reduces resource consumption and allows the fi rm to focus on activities that increase customer satisfaction. Knowing the val-ues of activities allows employees to see how work really serves customers and which activi-ties may have little value to the ultimate customers and should be eliminated or reduced.
A high-value-added activity increases signifi cantly the value of the product or service to the customers. Removal of a high-value-added activity decreases perceptively the value of the product or service to the customer. Inserting a fl ange into a part, pouring molten metal into a mold, and preparing a fi eld for planting are examples of high-value-added activities. Installing software to protect a computer from spam is a high-value-added activity to customers annoyed by bombardments of unwanted e-mail. Designing, processing, and delivering products and services are high-value-added activities.
Exhibit 5.10 illustrates high-value-added and low-value-added activities of a television news broadcasting fi rm. For a television news broadcasting company a high-value-added activity is one that, if eliminated, would affect the accuracy and effectiveness of the newscast and decrease viewer satisfaction and ratings for that time slot. An activity that shortens deli-very from three to two days is a high-value-added activity. Activities that verify story sources
•
•
•
A high-value-added activity increases the value of the product or service to the customers.
A high-value-added activity increases the value of the product or service to the customers.
to ensure the story’s accuracy are high-value-added activities. Activities to plan newscasts so that viewers can follow transitions from one story to the next are high-value-added activities. High-value-added activities are those:
That are necessary or required to meet customer requirements or expectations.
That enhance purchased materials or components of a product.
That contribute to customer satisfaction.
That are critical steps in a business process.
That are performed to resolve or eliminate quality problems.
That are performed upon request of a satisfi ed customer.
That you would do more of, if time permitted.
•
•
•
•
•
•
•
Eliminatethe activity toreduce cost
Reduce theactivity
frequency toreduce cost
Done
Eliminatelow-value
addedactivity to
reduce cost
SelectedActivity
No
No
No
No No
NoYes
Yes
Yes
Yes YesYes
Can theactivity be
eliminated?
Areall cost
reductionopportunities
identified?
Is theactivity required
to meet the specificationof the product or service
or satisfy customerdemand?
Can thedriver
frequency bereduced?
Doesthe
activitycontain
low-valueaddedtasks?
Is theactivity required
to sustain theorganization?
EXHIBIT 5.9Example of an Activity Analysis
EXHIBIT 5.10Television News Broadcasting Firm’s High-Value-Added and Low-Value-Added Activities
A high-value-added activity is one that, if eliminated, would affect the accuracy and effectiveness of the newscast and decrease total viewers as well as ratings for that time slot.
Activities that augment accuracy • Verifi cation of story sources and acquired information.
Activities that augment effectiveness • Effi cient electronic journalism to ensure effective taped segments. • Newscast story order planned so that viewers can follow from one story to the next. • Field crew time used to access the best footage possible. • Meaningful news story writing. • Contents of the newscast planned so that viewers get the best possible package of stories.
A low-value-added activity is one that, if eliminated, would not affect the accuracy and effectiveness of the newscast. The activity contributes nothing to the quest for viewer retention and improved ratings.
Activities that generate excess • Developing stories not used in a newscast. • Assigning more than one person to develop each facet of the same news story.
Activities that augment delay (downtime) • Newscast not completed on time because of one or more ineffi cient processes. • Too many employees on a particular shift or project.
Chapter 5 Activity-Based Costing and Management 133
ABC/M applications are now common in most industries. This section illustrates some exam-ple applications in the manufacturing and service industries and within government.
ABC/M Application in Manufacturing: Industrial Air Conditioner Units AIRCO is a manufacturer of industrial air conditioning units. The units range in size and power from 5 to 20 tons. 1 Each unit has more than 200 parts, including holding tanks, elec-tronic controllers, metal sheets, cooling coils, wires, and insulation material. Almost 90% of manufacturing workers are hourly workers, and the company operates two shifts. The organization of the manufacturing process is conventional, with separate departments for purchasing, engineering, job scheduling, materials handling, shipping, accounting, and hu-man resources. AIRCO developed an ABC system to assist in the analysis of product prof-itability. Its fi rst step was to identify the resource cost pools that make up total overhead
LEARNING OBJECTIVE 5 Describe how ABC/M is used in manufacturing companies, service companies, and governmental organizations
LEARNING OBJECTIVE 5 Describe how ABC/M is used in manufacturing companies, service companies, and governmental organizations
EXHIBIT 5.11A Classifi cation of High-Value-Added and Low-Value-Added Activities.
A low-value-added activity consumes time, resources, or space, but adds little in satisfy-ing customer needs. If eliminated, customer value or satisfaction decreases inperceptively or remains unchanged. Moving parts between processes, waiting time, repairing, and rework are examples of low-value-added activities. A low-value-added activity for a television news broadcasting company is one that, if eliminated, would have little or no effect on the accu-racy and effectiveness of the newscast; the activity contributes little or nothing to the quest for viewer retention and improved ratings. Activities such as developing stories not used in a newscast or correcting prior stories are examples of low-value-added activities for a televi-sion broadcasting company. In fact, many would consider these activities as non-value-added. Inventory, transportation, waiting, and correction are examples of low-value-added activities. Other high- and low-value-added activities are illustrated in Exhibit 5.11 .
Reduction or elimination of low-value-added activities reduces cost. Low-value-added activities are those that:
Can be eliminated without affecting the form, fi t, or function of the product or service.
Begin with prefi x “re” (such as rework or returned goods).
Result in waste and add little or no value to the product or service.
Are performed due to ineffi ciencies or errors in the process stream.
Are duplicated in another department or add unnecessary steps to the business process.
Are performed to monitor quality problems.
Are performed due to a request of an unhappy or dissatisfi ed customer.
Produce an unnecessary or unwanted output.
If given the option, you would prefer to do less of.
•
•
•
•
•
•
•
•
•
A low-value-added activity consumes time, resources, or space, but adds little or does not contribute to satisfying customer needs.
A low-value-added activity consumes time, resources, or space, but adds little or does not contribute to satisfying customer needs.
1 Heather Nachtmann, and Mohammad Hani Al-Rifai, “An Application of Activity-Based Costing in the Air Conditioner Manufacturing Industry,” The Engineering Economist, 2004, 49, pp 221–236.
Activity High-Value-Added Low-Value-Added
Designing product XSetting up XWaiting XMoving XProcessing XReworking XRepairing XStoring XInspecting XDelivering product X
of $4,458,605 at the plant (Exhibit 5.12 ). The resource costs (indirect labor, computer and software, etc.) are from the fi rm’s accounting system, which collects resources costs in these 11 categories.
The next step is to identify production activities and to use resource consumption cost driv-ers to assign the resource costs to the activity cost pools. The activity cost pools are machines; data record maintenance; material handling; product changeover (setup); scheduling and pro-duction preparation; materials receiving and handling; product shipment; and customer ser-vice ( Exhibit 5.13 , column 1). The assignment of resources to activities typically uses resource consumption cost drivers. Instead of using cost drivers, AIRCO determined the estimated contribution of each resource to each activity based on managers’ and employees’ experience. For example, the resource, maintenance costs, $60,000, was assigned entirely to the activity, machines. To illustrate, the cost of the machine activity was determined from the resources as follows (other activities were obtained in a similar way):
Machine activity cost = 20 % of the computer and software costs + 100 % of energy costs + 15 % of miscellaneous expense + 100 % of maintenance expense + 100 % of depreciation expense + 12 % of offi ce and utilities expense
The machine activity cost, and the cost of other activities is shown in column 2 of Ex-hibit 5.13 . The use of estimated percentages in place of other types of resource consumption
Overhead Resource Cost
Indirect labor $2,786,900Computer and software 731,405Product transportation 319,800Energy 170,600Facility and vehicle rent 165,870Business and training travel 66,000Miscellaneous 65,480Maintenance 60,000Depreciation 48,200Advertising 40,000Offi ce and utilities 4,355 $4,458,610
EXHIBIT 5.12AIRCO Overhead Cost Resources
EXHIBIT 5.13 AIRCO Resource Consumption Cost Pools Assigned to Activities; Activity Cost Drivers, and Activity-Based Rates
Machines $ 435,425 Number of machine hours 73,872 $ 5.89Data record maintenance 132,596 Number of products lines 14 9,471Materials handling 1,560,027 Number of products 16,872 92.46Production changeover 723,337 Setup time (hours) 72 10,046 (setup)Scheduling and production 24,876 Number of production runs 2,788 8.92 preparationMaterial receiving and 877,106 Number of receipts 2,859 306 handlingProduct shipment 561,013 Distance (miles) 13,784,015 .041Customer service 144,230 Number of customer contacts 2,533 56.94 Total $4,458,610
EXHIBIT 5.15 AIRCO: Overhead Allocation and Product Profi tability under Volume-Based Costing
cost drivers is a practical and convenient approach that is often used in implementing ABC costing.
The next step in ABC is to identify activity consumption cost drivers, to identify the total amounts for these cost drivers, and then to determine the ABC-based application rate. This is shown in Exhibit 5.13 , columns 3, 4, and 5, respectively. Thus, the cost of machine time is assigned to each of the products based on machine hours used by that product times the rate of $5.89 per machine hour ($5.89 = $435,425/73,872). This is done in the same manner for the other activities. The determination of ABC cost and profi tability analysis for AIRCO’s key product lines is the fi nal step and is shown in Exhibit 5.14 . Note that this analysis shows that the 5-ton, 6-ton and 12.5-ton products are not profi table.
The ABC analysis can be compared to the volume-based approach that AIRCO used prior to ABC. The volume-based overhead costs were assigned to products based on a rate of $12.02 per direct labor hour. The results are shown in Exhibit 5.15 . Note that the ABC and volume-based methods show signifi cantly different results for some of the products, particularly the 6-ton and 12.5-ton models. While the detailed calculations of the ABC costs for these products is not shown, the company reports that the 12.5-ton model required signifi cantly more raw ma-terials receipts (the cost driver for material receiving and handling) than other products, and it also required more setup time and customer service contacts. Thus, the ABC costs for the 12.5-ton model are signifi cantly higher than for volume-based costs. Similarly, the 6-ton prod-uct has higher costs under ABC because of its relatively high use of setup time and customer service contact. The ABC information provides the company a useful basis for becoming more competitive, for example, by reconsidering the pricing of certain products and looking for ways to increase effi ciency in the use of its activities.
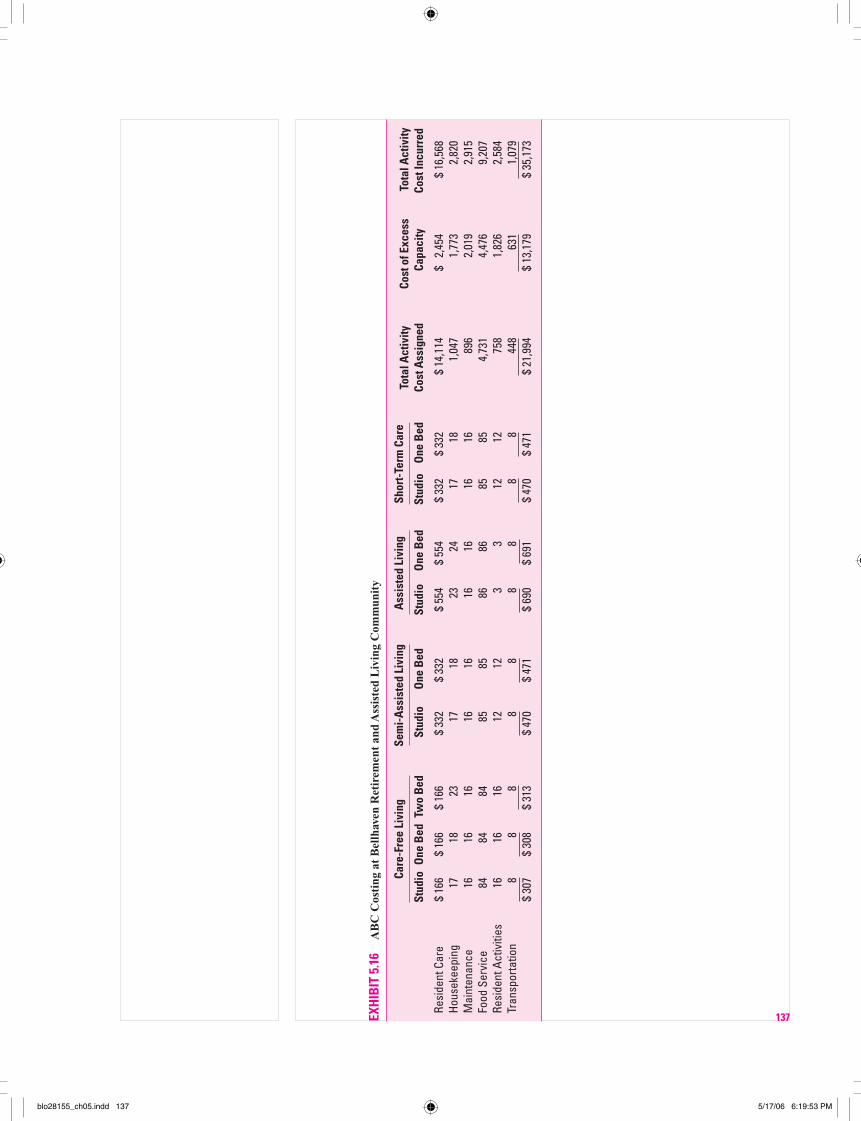
ABC/M Application in the Service Industry: A Retirement and Assisted Living Community The following is based on an actual 70-unit retirement and assisted living community, which we will call Bellhaven Homes, Inc. 2 Bellhaven has three levels of resident care: care-free
2 Sidney J. Baxendale, Mahesh Gupta, and P. S. Raju, “Profi t Enhancement Using an ABC Model,” Management Accounting Quarterly, Winter 2005, pp. 11–21.
living, semi-assisted living, assisted living, and short-term care. Each is offered in a studio or one bedroom fl oor plan, except care-free living, which is also offered in a two-bedroom fl oor plan. These nine different care-level/fl oor-plan combinations are priced differently and are re-garded as the cost objects at Bellhaven. There are currently 56 residents at Bellhaven, spread across the nine cost objects. The services at Bellhaven include resident care, housekeeping, maintenance of grounds and facility, food service, resident activities, and transportation. Each of these six services are the activities used by Bellhaven in developing an ABC model to deter-mine the cost and profi tability of each of its nine cost objects. The cost drivers for each activity are the number of hours worked by employees in each of these activities. The ABC application rates are then determined from the hours available in each of the service units, and the ABC costs for each cost object are calculated. Exhibit 5.16 illustrates the per resident costs within each of the nine cost objects. The ABC analysis provides Bellhaven useful information for pric-ing its services and for identifying activities where costs can be reduced and/or value added.
A special feature of the Bellhaven analysis is the calculation of the cost of unused capacity. Since Bellhaven maintains staff suffi cient to cover all 70 units in the facility, it is important to track the costs of underutilization. Bellhaven has room for 14 more residents. This means that the application rates are based on 70-unit capacity and not actual usage, as is sometimes the case in ABC. When rates are based on capacity, management is able to determine the additional information about the cost of unused capacity.
ABC/M Applications in Government ABC/M is used widely in government. The U.S. Postal Service example that introduced this chapter is one good example. Another example is the U.S. Patent and Trademark Offi ce (PTO) which uses ABC to better understand its cost structure. As the volume of patent requests has increased substantially, and since the PTO is not taxpayer supported but relies on user fees, the determination of accurate costs and the setting of appropriate user fees for its different services is critical. The ABC model at the PTO used 29 activities and the cost objects included utility patents, design patents, plant patents, reissues, reexaminations, trademarks, and ap-peals. One fi nding of the ABC implementation was that the cost of trademark processing was higher than expected. 3
3 For additional examples: Gary Cokins, Activity-Based Cost Management in Government, Management Concepts, Inc., 2001.
REAL-WORLD FOCUS Distorted Medicare Reimbursement with Inappropriate Cost Drivers
Hospitals must complete a Medicare cost report each year to be eligi-ble for government reimbursement for services rendered to Medicare patients. Government uses this cost information to set amounts for various Medicare reimbursement parameters. Hospitals often use the same cost information as the basis for determining the charges for privately insured patients. For inpatient care costs, Medicare requires that all operating costs pertaining to patient care be allocated to pa-tients based only on the number of days a patient spends in the hos-pital (patient-days). Thus, Medicare cost reporting does not explicitly consider the possibility of multiple cost drivers.
Huang and Kirby noted at least two cost drivers for patient care costs: (1) the number of patient-days and (2) the number of patients admitted. Patient-day costs include costs of meals, laundry, and basic nursing care. Admission costs include costs for taking patients’ his-tory upon admission, preparing patients for surgery, intensive care immediately following surgery, preparing rooms for new patients, and handling medical coding and billing. The fi rst cost driver, the number of patient-days, is a unit-level cost driver while the second cost driver is likely a batch-level cost driver.
Using publicly available data, Huang and Kirby compared the results of current Medicare reimbursement procedures that use a
single volume-based, unit-level cost driver (patient-days), with the results that would be obtained if Medicare reimbursements were based on two cost drivers: a unit-level cost driver (patient-days) and a batch-level cost driver (number of admissions). Their studyresults suggest that Medicare is potentially overcharged by between $66 million and $1.98 billion per year for hospital patient care! The main reason is that Medicare patients tend to be older and have a much longer average length of hospitalization than private insur-ance patients do. Because Medicare reimbursements consider only patientdays, Medicare is charged for a disproportionately large share of admitted patients.
Moreover, Medicare reimbursement for a given medical proce-dure is based on a formula developed by the Health Care Financ-ing Administration (HCFA) which relies on physician time and the complexity of the procedure. Since some of the costs of any given procedure may not be related to physician time and/or the complex-ity rating, the Medicare formula will not always accurately refl ect incurred costs.
Source: Yuchang Huang and Alison L. Kirby, “Distorted Medicare Reimburse-ments: The Effect of Cost Accounting Choices,” Journal of Management Accounting Research, Fall 1994, pp. 128–43.
Other examples include the Internal Revenue Service (IRS), which uses ABC/M to calcu-late the costs of processing each of its different types of tax returns, and the U.S. Army, which uses ABC in the management of the delivery of medical care and the maintenance of military equipment, among other applications.
The U.S. federal government encourages the use of ABC within its various units. In 1990, three offi cials responsible for federal fi nancial reporting established the Federal Accounting Standards Advisory Board (FASAB) as a federal advisory committee ( www.fasab.gov ). The offi cials were the Secretary of the Treasury, the Director of the Offi ce of Management and Budget, and the Comptroller General of the United States. They created FASAB to develop accounting standards and principles for the United States Government. FASAB Standard Num-ber 4, “Managerial Cost Accounting Concepts and Standards for the Federal Government, ” explains the advantages of ABC for use in governmental units.
Customer Profi tability Analysis
How is customer service doing? Bezos isn’t interested in a qualitative answer. He wants to
know average customer contacts per hour, average time per contact, the breakdown of e-mail
versus telephone, and the total cost to the company of each.
Interview with Jeff Bezos , CEO of Amazon.com, Fortune , May 26, 2003, p. 64.
ABC/M is best known for its application in computing product costs, but many fi rms fi nd that it is also very useful in determining the cost of serving customers and as a basis for evaluating the profi tability of a specifi c customer or of a selected group of customers. Why is this impor-tant? Most managers agree that 80% of their profi ts come from the top 20% of their customers, and most important, the bottom 20% of their customers are unprofi table! For example, to bet-ter compete with Wal-Mart, Best Buy works hard to attract profi table customers (it calls them angels ) and equally hard to discourage the unprofi table customers (the devils ), those that are price shopping and looking for discounts and promotions, and comparing prices to Wal-Mart. This strategy involves improved service and fewer discount/promotion offers. Best Buy stud-ies demographic and sales data for each store location to identify angels and devils. Similarly, the large food distributor, CONCO, studies its customer base (mostly restaurants) to identify profi table and unprofi table customers. CONCO found that certain food products and smaller customers tended to be unprofi table. 4
Customer profi tability analysis identifi es customer service activities and cost drivers and determines profi tability of each customer or group of customers. Here, customer service in-cludes all activities to complete the sale and satisfy the customer, including advertising, sales calls, delivery, billing, collections, service calls, inquiries, and other forms of customer ser-vice. Customer profi tability analysis allows managers to:
Identify most profi table customers.
Manage each customer’s costs-to-serve to a lower level.
Establish a surcharge for or repricing expensive costs-to-serve activities.
Reduce services for high cost-to-serve customers.
Introduce new products and services.
Discontinue products, services, or customers.
Improve the process of customer service.
Shift the customer’s purchase mix toward higher-margin products and service lines.
Offer discounts to gain more volume with low costs-to-serve customers.
Select customer mix—What types of customer should we market to? What types should we not market to?
Choose types of after-sale services to provide.
•
•
•
•
•
•
•
•
•
•
•
Customer profi tability analysis identifi es customer service activities, cost drivers, and the profi tability of individual customers or groups of customers.
Customer profi tability analysis identifi es customer service activities, cost drivers, and the profi tability of individual customers or groups of customers.
4 Stephen Schulist, “Using ABC to Manage and Improve at CONCO Foods,” The Journal of Corporate Accounting & Finance, March/April 2004, pp. 29–34; Gary McWilliams, “Analyzing Customers, Best Buy Decides Not All Are Welcome,” The Wall Street Journal, November 8, 2004, p. 1.
b lo 2 8 1 5 5 _ c h 0 5 . in d d 1 3 8blo28155_ch05.indd –1385 / 1 7 / 0 6 6 : 1 9 : 5 3 P M5/17/06 –6:19:53 PM
Chapter 5 Activity-Based Costing and Management 139
A good understanding of the profi tability of a fi rm’s current and potential customers can help fi rms to improve overall profi ts and to become more competitive. This begins with an analysis of the cost to serve the customer.
Customer Cost Analysis Not all customers require similar activities either before or after the sales. Examples of customer-specifi c activities include:
Order processing costs.
Billing, collection, and payment processing costs.
Accounts receivable and carrying costs.
Customer service costs.
Return or allowance processing costs.
Restocking costs.
Selling and marketing costs.
Customer cost analysis identifi es activities and cost drivers to service customers before and after sales, not including product costs. Traditionally these costs are hidden in the cus-tomer support, marketing, and sales function. ABC/M can help managers to grasp activities and their costs to serve customers.
Different activities often have different cost drivers. Based on the activities and cost drivers involved in services performed to acquire and complete a transaction, customer costs can be classifi ed into the following categories:
Customer unit-level cost —resources consumed for each unit sold to a customer. Examples include sales commissions based on the number of units sold or sales dollars, shipping cost when the freight charge is based on the number of units shipped, and cost of restocking each of the returned units.
Customer batch-level cost —resources consumed for each sales transaction. Examples in-clude order-processing costs, invoicing costs, and recording of sales returns or allowances every time a return or allowance is granted.
Customer-sustaining cost —resources consumed to service a customer regardless of the number of units or batches sold. Examples are salespersons’ travel costs to visit customers, monthly statement processing costs, and collection costs for late payments.
Distribution-channel cost —resources consumed in each distribution channel the fi rm uses to service customers. Examples are operating costs of regional warehouses that serve major customers and centralized distribution centers that serve small retail outlets.
Sales-sustaining cost —resources consumed to sustain sales and service activities that can-not be traced to an individual unit, batch, customer, or distribution channel. Examples are general corporate expenditures for sales activities, and salary, fringe benefi ts, and bonus of the general sales manager.
Exhibit 5.17 reports customer-related activities, cost drivers and their rates, and the cost category of each of the activities of Winsome Offi ce Supply. These activities are based on the results of a careful study of the fi rm’s selling, administrative, and general expenditures, as well as customer transactions for the last three years. Exhibit 5.18 reports the detailed customer-related activities that Winsome experienced for the sales to the fi rm’s three major customers GereCo, HomeServ Inc, and Advance Tek.
Both customer activity costs, cost categories, and their cost drivers illustrated in Exhibit 5.17 and the detailed customer-related activities reported in Exhibit 5.18 provide the basis for analyzing customer costs. Exhibit 5.19 reports customer cost analyses for Winsome’s three customers.
As illustrated in Exhibit 5.18 and 19 , the costs to service customers often differ because they do not require the same amount of services. These three customers purchased approxi-mately equal amounts from Winsome. The costs to serve these customers, however, ranged from $1,555 to $10,795.
•
•
•
•
•
•
•
•
•
•
•
•
LEARNING OBJECTIVE 6 Use an activity-based approach to analyze customer profi tability
LEARNING OBJECTIVE 6 Use an activity-based approach to analyze customer profi tability
Customer cost analysis identifi es activities and cost drivers to service customers.
Customer cost analysis identifi es activities and cost drivers to service customers.
Customer Profi tability Analysis Customer profi tability analysis combines customer revenues and customer cost analyses to assess customer profi tability and helps identify actions to improve customer profi tability. Exhibit 5.20 illustrates customer profi tability analysis for Winsome.
The customer profi tability analysis shows that HomeServ is the most profi table among Winsome‘s three major customers, even though HomeServ had the lowest amount of
EXHIBIT 5.17Customer-Related Activity, Cost Driver, Cost Rate, and Cost Category
Activity Cost Driver and Rate Cost Category
Order taking $30 per order Customer batch-levelOrder processing $20 per order, and Customer batch-level $1 per item Customer unit-levelDelivery $100 per trip, and Customer batch-level $1 per mile Customer batch-levelExpedited order taking, $800 per order Customer batch-level processing, and delivery (additional costs) Customer visit $200 per visit Customer sustainingMonthly billing: First statement $5 per statement Customer sustaining Subsequent reminder $25 per notice Customer sustainingSales returns $100 per occurrence Customer batch-levelRestocking $5 per item returned Customer unit-levelSales offi ce Salaries and fringe benefi ts $100,000 per month Sales sustaining Offi ce expenses $50,000 per month Sales sustaining
EXHIBIT 5.18Customer-Related Activity for Selected Customers Winsome Offi ce Supply
GereCo. HomeServ Inc. Advance Tek
Net sales $463,917 $477,600 $472,576Number of orders 2 20 80Average number of items per order 400 38 8Delivery miles 10 15 20Number of expedited orders 0 0 5Number of visits by salesperson 1 2 5Sales returns Number of requests 2 1 10 Average units per return 3 4 2
EXHIBIT 5.19Customer Cost Analysis, Winsome Offi ce Supply
purchases from Winsome. The analysis also shows that although Advance Tek made the high-est total purchases of the three, it yields the lowest net customer profi t.
The reasons that GereCo. is not as profi table as HomeServ relate to sales activities. Win-some granted GereCo. much more favorable sales terms than the terms granted to HomeServ. GereCo. also had a high amount of sales returns and allowances; it returned twice as often as HomeServ did.
Discounts and sales returns are contributing factors for the low profi tability of Advance Tek. Although Advance Tek had the highest total sales, it generated the lowest profi t of the three customers. Winsome should be concerned about Advance Tek’s high returns and its fre-quency of expediting orders. The high returns could be a result of the customer’s dissatisfac-tion with Winsome’s products. Winsome needs to look into the reason for the high returns before losing the customer to competition. Late payments also add cost to serve Advance Tek; they might indicate Advance Tek’s dissatisfaction with Winsome’s sales and services or tight-ness of Advance Tek’s fi nancial condition.
Customer Value Assessment Customer profi tability analysis provides valuable information to the assessment of customervalue. In addition, fi rms must weigh other relevant factors before determining the action appropriate for each customer. The following are among these relevant factors:
Growth potential of the customer, the customer’s industry, and its cross-selling potential.
Possible reactions of the customer to changes in sales terms or services.
•
•
Cost Management in Action CUSTOMER PROFITABILITY: IS IT BETTER FOR WEB CUSTOMERS?
An important part of customer profi tability is the cost to acquire a new customer. Bain and Company, a consulting fi rm, estimated that the cost of obtaining a new customer in the consumer electronics industry needs more than four years of business from each new customer to break even,
but more than half of the new customers will defect before the four-year breakeven point. The numbers are similar for the apparel industry. Many fi rms are now trying to acquire new customers through the Web. What would be the effect of the Web acquisition on profi tability?
EXHIBIT 5.20Customer Profi tability Analysis, Winsome Offi ce Supply
REAL-WORLD FOCUS ABC/M: Which Companies Have Success?
The Consortium for Advanced Manufacturing International (CAM-I) and the American Productivity and Quality Center (APQC) recently collaborated in the survey of 166 manufacturing and service fi rms to assess the implementation of ABC/M in these fi rms. Sixty-eight per-cent of the respondents were in manufacturing and 25% in service companies. The results showed that the majority of senior managers reported “very successful” implementations of the ABC/M system, while department managers were somewhat evenly split between “very successful” and “moderately successful.” Line personnel tend-ed to vote “moderately successful.” So, the higher the respondents were in the organization, the more they perceived benefi ts from use of the ABC/M system.
Interviews with selected respondents and further data analysis showed that the three most common characteristics of successful
systems were: (1) a high level of top management support and com-mitment; (2) technical competence of the implementation team; and (3) effective change management, that is, companies driven by com-petitive pressures to strive to better understand their internal capa-bilities and external competition. Some of the responding companies made strategic changes, including changes in the supply chain and changes in target customers. These results are similar to those re-ported in prior studies of ABC/M implementation.
Source: Dan Swenson and Douglas Barney, “ABC/M: Which Companies Have Success?” The Journal of Corporate Accounting & Finance, March/April 2001, pp. 35–44. See also, Douglas T. Hicks, “Good Decisions Require Good Models: Developing Activity-Based Solutions that Work for Decision Makers,” Cost Management, March/April 2005, pp. 32–40, and Michael D. Shields and Michael A. McEwen, “Implementing Activity-Based Costing Systems Successfully,” Cost Management, Winter, 1996, pp. 15–22.
Importance of having the fi rm as a customer for future sales references, especially when the customer could play a pivotal role in bringing in additional business.
Some companies quantify the concept of customer value in what is called customer life-time value (CLV) . CLV is the net present value of all estimated future profi ts from the customer. For example, assume Johnson Instruments Inc, a customer of Hughes Chemical Company, is expected to produce profi ts for Hughes of $20,000 per year for the next three years. If Hughes uses a discount rate of 6%, then the CLV for Johnson is 2.673 × $20,000 = $53,460. The PV factor, 2.673, is obtained from Table 2 of the Present Value Tables at the end of the text. CLV is a useful means to examine the relative value of Hughes’s customers.
•
Customer Lifetime Value (CLV) is the net present value of all estimated future profi ts from the customer.
Customer Lifetime Value (CLV) is the net present value of all estimated future profi ts from the customer.
If you want to make enemies, try to change something.
Woodrow Wilson
A successful ABC/M implementation requires close cooperation among management accoun-tants, engineers, and manufacturing and operating managers. They need to act as a team in identifying activities, cost drivers, and requisite information, both fi nancial and nonfi nancial.
Understanding the production process and identifying cost drivers require careful efforts. Efforts to redesign cost systems usually are rewarded when organizations have high product diversity, various cost drivers, multiple distribution channels, and heterogeneous batch sizes.
Following are processes found in many successful implementations of ABC/M:
LEARNING OBJECTIVE 7 Identify key factors for successful ABC/M implementation.
LEARNING OBJECTIVE 7 Identify key factors for successful ABC/M implementation.
Implementation Issues
Implementing Strategy Justifi cation
Involve management and employees in Allows them to become familiar with ABC/M. creating an ABC system They could then be more willing to implement the system
because they feel included and share in ownership of the new system.
Maintain a parallel system Allows individuals to adapt gradually to the ABC/M system. Abruptly changing cost systems can confuse and frustrate management and employees.
Use ABC/M on a job that will succeed Shows how and why the process works. Successfully completing one job enables individuals to see the benefi ts of ABC/M more clearly.
Chapter 5 Activity-Based Costing and Management 143
Two important issues to consider in ABC/M implementation have to do with the relatively high complexity of these systems in practical applications: multiple-stage activity-based cost-ing and time-driven activity-based costing.
Multiple-Stage Activity-Based Costing In practice, because of the complexity of the fi rm’s operations, some activities are cost objects for other activities. To implement this complexity, some fi rms will use multiple-stage activity-based costing, in which resource costs are assigned to certain activities, which are in turn assigned to other activities before being assigned to the fi nal cost objects—the fi rm’s products or services. Exhibit 5.21 illustrates such a case. The activity labeled “support activi-ties” provides service to other activities later in the value chain—product/service activities, customer activities, and information sustaining activities. The exhibit illustrates how a total of $70 of resource costs are assigned in multiple-stage ABC.
Time-Driven Activity-Based Costing A recent attempt to simplify some of the complexity of large ABC systems is based on the idea that the common element in the utilization of activities is the unit of time. 5 For example, the three activities—machine setup, inspection, and packaging—might require 80 minutes, 15 minutes, and 20 minutes, respectively. The activity consumption cost drivers for these ac-tivities are based on the total activity cost divided by the number of minutes available for that activity. For example, if the total cost of setup is $50,000, and there is a capacity of 1,250 minutes of setup time, then the activity rate is $50,000/1,250 = $40 per minute. This approach can simplify the ABC application, since the management accountant can add ad-ditional complexity to an activity by simply adding the additional minutes. For example, if setup time for a special customer order requires an additional 15 minutes, the assigned setup
5 Robert S. Kaplan and Steven R. Anderson, “Time-Driven Activity-Based Costing,” Harvard Business Review, November 2004.
Keep the initial ABC/M design simple Avoids overwhelming users and holds costs down; also reduces implementation time.
Create desired incentives Reassures employees that they will be properly evaluated in accordance with their performance.
Educate Managers and employees Uses seminars to educate managers and employees about ABC/M to enable them to understand the concept and ap-preciate the benefi ts. Management becomes aware of the activities that drive the business.
Supportactivities
$30
Material$10
Product/serviceactivities $15
Products$25
Customeractivities $20
Infrastructuresustaining $25
Resource Costs($70)
Cost of product, Customer activities + Sustainingcosts = Total costs to recover = $70
ABC asatotal system in this example begins with $70. It then reassigns andaccumulates the costs into the final cost objects.
Resources
Activities
$10 $10
$10
$10
$10$10
$5
$15
$25$45
$25
$15$30
*Intermediate activity driversreassign each activity's cumulativeinput costs plus its own cost.
cost would be based on $40 per minute times the total time of 80 + 15 = 95 minutes: 95 minutes × $40 = $3,800.
Another advantage of the time-driven approach is that, when the rates are based on practi-cal capacity rather than actual total usage (for example, assume the 1,250 minutes of total setup time above is the practical capacity in the setup activity, not the minutes used), then the approach can be used to determine the cost of unused capacity, much like Bellhaven Homes example shown earlier.
Summary Many companies have replaced their volume-based costing systems with activity-based accounting systems to gain better product costing and pricing. ABC facilitates activity-based management that improves competitiveness, reduces costs, increases productivity, and aug-ments fl exibility in meeting customer needs.
Volume-based costing systems use a volume-based overhead rate, either a single rate for the entire plant or departmental rates. These volume-based overhead rates typically use meas-ures such as direct labor-hours, machine-hours, or direct labor costs for all products or serv-ices, even if the fi rm has diverse products, manufacturing processes, and volumes. For fi rms with more than one product or process, these overhead rates often generate inaccurate and signifi cantly distorted product costs.
Activity-based costing (ABC) assigns costs to products or services based on consump-tion of resources and activities. ABC systems recognize the fact that products or services are results of activities and that activities consume resources and incur costs; it recognizes the causal relationships of cost drivers to activities. ABC systems use a two-stage procedure to as-sign costs to products or services. The fi rst-stage allocation is a resource cost assignment proc-ess by which factory overhead costs are assigned to activity cost pools or groups of activities called activity centers using appropriate resource consumption cost drivers. The second-stage allocation is an activity cost assignment process by which the costs of activities are assigned to products or services using appropriate activity consumption cost drivers.
Activity-based costing helps to reduce cost distortions often found in volume-based cost-ing systems and provides more accurate product costs. It also yields a clear view of how a fi rm’s diverse products, services, and activities contribute to the fi rm’s bottom line. Even though developing and implementing an ABC system is expensive and time consuming, many fi rms found the benefi t exceeds the cost of installing an ABC system.
Activity-based management (ABM) improves effi ciency and effectiveness of an organi-zation. Uses of ABM increase not only the value received by customers but also the fi rm’s profi ts.
Customer profi tability analysis traces costs to customers to allow management to deter-mine customer profi tability and to provide more attentive service to high-profi t customers, acquire new high-profi t customers, and improve the profi tability of current customers.
Numerous factors play important roles in implementing ABC/ABM. To be successful, management accountants need to cooperate with engineers and manufacturing and operating managers to form a design team.
Chapter 5 Activity-Based Costing and Management 145Chapter 5 Activity-Based Costing and Management 145
Customer Profi tability: Retention is the Key The overall cost to acquire a new customer has a strong effect on customer profi tability. These costs can be as high as $50 or more per customer. When customer retention is low, as it is in some industries, these costs lower overall customer profi tability. For example, customer retention in the apparel industry is far higher than in the consumer electronics industry. A number of fi rms use the Web to acquire new customers, and some do it more effectively than others. For example, America Online, Amazon.com, and Dell Computer have sophisticated programs for identifying potential new customers and for improving the retention of existing customers. Interestingly, studies have shown that Web customers tend to be more loyal; their reten-tion rates are somewhat higher than for traditional customers. Studies show that Web customers are most interested in convenience, not the lowest price, as is commonly thought. When they fi nd a convenient Web source that meets their needs, they tend to consolidate their purchases there. E-loyalty is the road to success for these companies.
Source: Frederick F. Reichheld and Pohil Schefter, “E -Loyalty; Your Secret Weapon on the Web,” Harvard Business Review, July–August 2000, pp. 105–113.
Comments on Cost Management
in Action
Comments on Cost Management
in Action
Volume-Based Costing Versus ABC Carter Company manufactures two products, Deluxe and Regular, and uses a traditional two-stage cost allocation system. The fi rst stage assigns all factory overhead costs to two production departments A and B, based on machine-hours. The second stage uses direct labor-hours to allocate overhead to individual products.
For 2006, the fi rms budgeted $1,000,000 total factory overhead cost for these operations.
Production Department A Production Department B
Machine-hour 4,000 16,000 Direct labor-hour 20,000 10,000
The following information relates to the fi rm’s operations for the month of January, 2006:
Deluxe Regular
Units produced and sold 200 800 Unit cost of direct materials $100 $ 50 Hourly direct labor wage rate $ 25 $ 20 Direct labor-hours in Department A per unit 2 2 Direct labor-hours in Department B per unit 1 1
Carter Company is considering implementing an activity-based costing system. Its management accountant has collected the following information for activity cost analysis:
Material movement $ 7,000 Number of production runs 350 15 20 Machine setups 400,000 Number of setups 500 25 50 Inspections 588,000 Number of units 19,600 200 800 Shipment 5,000 Number of shipments 250 50 100 $1,000,000
Required Calculate the unit cost for each of the two products under the existing volume-based costing system.
Calculate the overhead per unit of the cost driver under the proposed ABC system.
Calculate the unit cost for each of the two products if the proposed ABC system is adopted.
1.
2.
3.
Self-Study Problem (For solution, please turn to the end of the chapter.)
Self-Study Problem (For solution, please turn to the end of the chapter.)
5-1 Explain why a costing system that uses a volume-based rate is likely to produce distorted product costs.
5-2 “Undercosting a product increases the profi t from the product and benefi ts the fi rm.” Do you agree? Why?
5-3 Firms sell products with high costs at high prices. High selling prices increase revenues and profi ts. Why then should managers worry about product overcosting?
5-4 What is activity-based costing, and how can it improve an organization’s costing system?
5-5 Describe general levels of cost hierarchy in activity-based costing systems.
5-6 What is the second-stage procedure in tracing costs to products when using an activity-based costing system?
5-7 What type of company needs an activity-based costing system?
5-8 What are unit-level activities? Give two examples of unit-level activities.
5-9 What are batch-level activities? Give two examples of batch-level activities.
5-10 What are product-level activities? Give two examples of product-level activities.
5-11 What are facility-level activities? Give two examples of facility-level activities.
5-12 Why do product-costing systems using a single, volume-based cost driver tend to overcost high-volume products? Will there be any undesirable strategic effects from such product cost distortion?
5-13 What is activity-based management?
5-14 Give three examples of high-value-added activities in an organization that you choose.
5-15 Give three examples of low-value-added activities in an organization that you choose.
5-16 How can activity-based costing and management be used in service organizations?
5-17 Identify opportunities afforded by customer profi tability analysis.
Questions Questions
5-18 Tasty Beverage Co. produces soft drinks, specializing in sugar-based drinks. They produce 5,000 cans of product per batch. Setup cost for each batch is $50 and each drink costs $0.10 to produce. What is the total cost per batch? How much would it cost to fi ll an order for 100,000 cans?
5-19 Montross Lumber processes wood to be shipped to construction companies. In order to keep their products uniform, they conduct inspections on 20% of the boards produced. Inspections cost the company $10 per hour and it takes one minute to inspect each board. How much would it cost to fi ll an order for 30,000 boards?
5-20 Orange Inc. grows cabbage. Each package shipped out contains 20 vegetables. It costs Orange $5 to put together each package and $0.10 to clean and process each vegetable. If they are discussing an order for 50 heads of cabbage, how much higher is the cost of producing 60 heads, considering package size?
5-21 Williams Performance Co. manufactures sports cars. After making a sale, the salesperson sends the car to be detailed before the customer takes it home. Detailing the car takes 30 minutes at a cost of $15 per hour for direct labor and $5 per car for materials. If the average salesperson sells fi ve cars per day, what is the average cost per week for detailing cars?
5-22 Stackhouse Computing produces high performance desktop computers. Annual CGS data shows that the company spent $1,000,000 for 5,000 computers produced, and each computer requires two technician hours and fi ve hours of direct labor. Direct labor is paid $10 per hour by the company. What is the cost of one technician hour?
5-23 Scott Cameras produces digital cameras and has decided to switch from a volume-based system to an activity-based system. Scott produced 100,000 digital cameras in the most recent quarter and has determined that total activity costs were: $3,000,000 of materials cost, $500,000 of labor costs, $1,000,000 of inspection costs, and $500,000 of packaging costs. It takes 30 minutes of labor to pro-duce each camera, inspections are done for 20% of all cameras produced, and cameras are packaged individually. What are the rates for each of these activities?
5-24 Haywood Printing is processing a job with the following activity rates:
Activity Cost Driver Driver Rate
Direct Labor Number of Hours $ 8 Copying Number of Copies $0.05
If this job requires fi ve hours for the 1,000 copies, what is the activity based cost of the job?
Chapter 5 Activity-Based Costing and Management 147
5-29 Activity Levels and Cost Drivers Al’s Speedy Gourmet, a small hamburger shop, has identifi ed the following resources used in its operations:
Bread
Hourly help
Store rent
Ground beef
Catsup
a.
b.
c.
d.
e.
Advertising for Triple-Burger special
Salary for the store managers
Utilities
$1-off-coupon for the second order
Bags
f.
g.
h.
i.
j.
Required
Classify its costs as unit-level, batch-level, product-level, or facility-level costs.
Suggest a proper driver for each of the above items.
5-30 Activity Levels and Cost Drivers Shroeder Machine Shop has the following activities:
Machine operation
Machine setup
Production scheduling
Materials receiving
Research and development
a.
b.
c.
d.
e.
Machine maintenance
Product improvement
Parts administration
Final inspection
Materials handling
f.
g.
h.
i.
j.
Required
Classify each of the activities as a unit-level, batch-level, product-level, or facility-level activity.
Identify a proper cost driver for each activity in requirement 1.
5-31 Activity Levels and Cost Drivers Richardson Industries manufactures industrial tools after creating a mold for each newly designed tool. Richardson personally inspects every unit during the trial run of a new mold and 10 percent of the units manufactured in the fi rst three batches. Some of the activi-ties of the fi rm follow:
Designing molds
Creating molds
Inspecting products
Modifying molds
Setting up production
a.
b.
c.
d.
e.
Requesting and moving materials
Machining
Insuring equipment
Paying suppliers
Heating the factory
f.
g.
h.
i.
j.
Required
Classify each of the activities as a unit-level, batch-level, product-level, or facility-level activity.
Identify a proper cost driver for each activity in requirement 1.
1.
2.
1.
2.
1.
2.
Exercises Exercises
5-25 Locke Data Processing reported expenses of $5 million for indirect labor, of which $3 million was for data analysis and $2 million was for data entry. Locke recorded 100,000 hours of data entry and 30,000 hours of data analysis. What are the activity-based rates for each area of direct labor?
5-26 Mattresses-A-Million produces Pillow-Top mattresses. They have been using a volume-based cost-ing system to allocate overhead based on direct labor hours. The Pillow-Top requires two hours of direct labor. The company has been allocating overhead at the rate of $10 per direct labor hour. The accounting manager thinks they should switch to ABC and wants to know how much they would save. If the Pillow-Top Mattress requires 30 pounds of materials (materials handling costs are $0.10 per pound) and two setups at $5 per setup, is the accounting manager correct? According to the activity-based costs, how much was the cost of making a mattress overstated/understated?
5-27 Plant overhead for ABC Corp is $150 million per year, a portion of which (20%) is attributable to inspection costs which are charged to products on the basis of the number of parts in the products. The plant produces 500,000 units per year, and on the average, each product has 20 parts. What is the average inspection cost in a product? What is the inspection cost for a product with 50 parts?
5-28 The materials handling charge for ABC corp is $.50 per pound of fi nished product. What is the materials handling charge for a job that produced 10,000 units at a weight of 6 pounds per unit?
5-32 Activity Levels and Cost Drivers, Service Company Platte Valley Laboratories offers complete laboratory service for agriculture and the environment. A subdivision of its Agriculture Testing Department conducts soil tests (ST) and pesticide residues tests (PRT). The current costing system aggregates all $2,100,000 operating costs of the subdivision into a single overhead cost pool and charges a rate of $70 per test-hour. ST uses 10,000 test-hours, and PRT uses 20,000 test-hours. In an effort to establish a better costing structure, the controller has identifi ed the following costs:
a. Salaries and wages of lab technicians $1,200,000. These costs can be traced to ST, $540,000, and PRT, $660,000.
b. Equipment-related costs such as depreciation, maintenance, insurance and taxes, and energy, $300,000. The cost driver is the number of test-hours.
c. Setup costs, $240,000, to be assigned on the basis of the number of setup hours. ST has 8,500 setup hours, and PRT has 11,500 setup hours.
d. Costs of test designs, $360,000. These costs are to be assigned to ST and PRT on the basis of the time required to design the tests. ST requires 5,800 hours, and PRT requires 4,200 hours.
Required Classify each activity cost (a) through (d) as output unit-level, batch-level, product (or service) level, or facility level cost.
Calculate the cost per test-hour for ST and PRT using an improved costing structure. Explain briefl y the reasons for these costs to be different from the $70 per test-hour under the current costing system.
Set up a spreadsheet and verify your answer for 2 above.
Use the spreadsheet you set up for requirement 3 to answer this question. What will be the cost per test hour for ST and PRT if $360,000 of the salaries and wages should have been included in the setup cost and $540,000 of the salaries and wages should have been included in the costs of test designs? Should the fi rm determine cost per testing on the basis of test-hour? (Of the remaining $300,000 salaries and wages for lab technicians, $135,000 for 2,500 hours can be traced to ST and $165,000 for 5,000 hours can be traced to PRT.)
(CMA Adapted)
5-33 Volume-Based Costing Versus ABC Many companies recognize that their cost systems are inade-quate for today’s powerful global competition. Managers in companies selling multiple products are making important product decisions based on distorted cost information. This happens because most volume-based cost systems focused on inventory valuation. To elevate the level of management information, current literature suggests that companies should have as many as three cost systems for (1) inventory valuation, (2) operational control, and (3) activity-based costing.
Required Discuss why the volume-based cost system developed to value inventory distorts product cost information.
Identify the purpose and characteristics of each of the following cost systems:
a. Inventory valuation
b. Operational control
c. Activity-based costing
Describe the benefi ts that management can expect from activity-based costing.
List the steps that a company using a volume-based cost system would take to implement activity-based costing.
(CMA Adapted)
5-34 Activity-Based Costing Hakara Company has identifi ed the following overhead cost pools and cost drivers:
Chapter 5 Activity-Based Costing and Management 149
The following cost information pertains to the production of its products A and B:
A B
Number of units produced 4,000 20,000Direct materials cost ($) $40,000 $50,000Direct labor cost ($) $24,000 $40,000Number of setup hours 200 240Pounds of materials used 1,000 3,000Kilowatt-hours 2,000 4,000
Required Use activity-based costing to calculate the unit cost for each product.
5-35 Customer Profi tability Analysis: Luxury Hotel Industry The luxury hotel chain Ritz-Carlton re-cently introduced a system called “Mystique” that collects information about its customers from employees and staff at the hotel. The information is used to personalize the services provided to each guest. For example, a bottle of the guest’s favorite type of wine would be placed in the room without the guest having to request it. Similarly, the type of fruit a guest prefers will be waiting in the room on arrival. The information is available throughout the Ritz system so that when the guest checks into any Ritz-Carlton hotel, the special treatment is available. Other hotel chains such as Marriott, Hilton, and Hyatt have similar programs
Required
How do these information-gathering programs help the hotels become more competitive? What is the strategic role of these programs?
Do you see a role for activity-based accounting for these fi rms, as it relates to their information gathering and customer service?
What ethical issues, if any, do you see in the information-gathering systems?
5-36 Applications of ABC in Government Activity-based costing is used widely within the U.S. govern-ment. One example is the Department of Agriculture’s Animal and Plant Health Inspection Service (APHIS). APHIS helps to protect U.S. agriculture from exotic pests and diseases, to minimize wild-life/agriculture confl icts, and to protect the welfare of animals used for research or sold wholesale for pets. APHIS performs its services for a variety of users, some of whom pay a user fee. ABC was adopted to provide an accurate basis for determining these fees, and also for analysis of the effec-tiveness and effi ciency of its programs in meeting the Service’s overall goals. The National Institute of Health and the U.S. Mint also use ABC/M to help these organizations achieve their missions ef-fectively and effi ciently.
Required Identify an example or two of a governmental entity that you think could benefi t from the application of activity-based costing, and explain why.
Identify some of the resources, activities, and cost drivers you would expect to see in this application.
5-37 Activity-Based Costing in the Fashion Apparel Industry Fashion House, a manufacturer of high-fashion clothing for women, is located in South London. Its product line consists of trousers (45%), skirts (35%) , dresses (15%), and other (5%). Fashion House has been using a volume-based rate to assign overhead to each product; the rate it uses is £2.25 per unit produced. The results for the trousers line, using the volume-based approach are as follows:
Number of units produced (all fi gures in £) 10,000 Price $ 20.525 Total revenue $205,250
Direct materials $ 33,750 Direct labor 112,500 Overhead (volume based) 22,500 Total product cost $168,750 Nonmanufacturing expenses 31,500 Total cost $200,250
Recently, it has conducted a further analysis of the trousers line of product, using ABC. In the study, eight activities were identifi ed, and direct labor was assigned to the activities. The total conversion cost (labor and overhead) for the eight activities, after allocation to the trouser’s line is as follows:
Required Determine the net margin for trousers using ABC and comment on the difference in comparison to the volume-based calculations.
5-38 Volume-Based Versus ABC Overhead Rate GWS Hospital uses a hospitalwide overhead rate based on nurse-hours. The intensive care unit (ICU), which has 30 beds, applies overhead using patient-days. Its budgeted cost and operating data for the year follow:
Budget Information Hospital total overhead $69,120,000 Hospital total nurse-hours 1,152,000
Budget Cost Driver Information for ICU for the Month of June
Cost Pool Budget Cost Cost Driver Budget Cost Driver Activity
Beds $810,000 Number of bed-days 900 Equipment 422,500 Number of patient-days 845 Nursing care 457,500 Number of nurse-hours 6,000
In June, GWS’s intensive care unit had the following operating data:
5,900 nurse-hours 870 patient-days
Required Calculate the ICU’s overhead costs for the month of June using
The hospitalwide rate
The ICU departmentwide rate
The cost drivers for the ICU department
Explain the differences and determine which overhead assignment method is more appropriate.
5-39 Product Selection Strategy Johans Computer Company has two product lines, Desktop and Tablet. The fi rm’s costing system shows that each Desktop costs $550 to manufacture. Johans sells 9,000 Desktops at $660 per unit. A national low-price store has introduced a similar desktop computer with a market price of $380. Tablet computer is a new model that a handful of companies, including Jo-hans, introduced recently. Each Tablet computer costs Johans $750 to produce and sells for $2,750. Johans sells approximately 150 Tablet computers. The marketing vice president suggests shifting the sales mix in favor of Tablet computer. Unfortunately, Tablet computer is more complicated to make and few are produced.
Required Should Johans focus its sales on the Desktop or Tablet computer? Explain your answer.
Chapter 5 Activity-Based Costing and Management 151
5-40 High-Value-Added and Low-Value-Added Activities The Radiology Department of the Lindex General Hospital has the following activities:
Admitting patients
Retrieving patients from the waiting area
Assessing need for lab work
Sending patients to the lab
Bringing patient to the MRI machine
a.
b.
c.
d.
e.
Taking images
Checking images to determine the need for more images
Taking more images to get right pictures
Preparing report to the primary physician
f.
g.
h.
i.
Required Classify each item as a high-value-added, or a low-value-added activity.
5-41 High-Value-Added and Low-Value-Added Activities The Lindex General Hospital has determined the activities of a nurse including the following:
Report for duty and review patient charts
Visit each patient and take her/his temperature
Update patients’ records
Coordinate lab and radiology works
Wait for the attending physician to arrive
a.
b.
c.
d.
e.
Accompany attending physician
Explain treatments to patients
Call kitchen to have the wrong meal tray replaced
Perform CPR
f.
g.
h.
i.
Required Classify each item as a high-value-added or a low-value-added activity.
5-42 High-Value-Added and Low-Value-Added Activities Mazon.com sells merchandise through or-ders placed on its Web site. Some of the fi rm’s activities are
Print order forms
Review orders to ensure the accuracy of prices and the totals
Secure approval of charges on credit cards
Deliver order forms to supervisor to secure her/his approval
Make a copy of each order to send to the warehouse
Pick and pack items ordered
E-mail customer for items not in stock
E-mail customer on the shipment of the order with a thank-you note
Required Classify each item as a high-value-added or low-value-added activity.
5-43 ABC and Job-Costing Hood Company designs and manufactures machines that facilitate DNA sequencing. Depending on the intended purpose of each machine and its functions, each machine is likely to be unique. The job-order costing system in its Norfolk plant has fi ve activity cost pools, in addition to direct materials and direct labor. Job TPY–2306 requires 1,000 printed-circuit boards. The cost per board that passes the fi nal inspection is $240. On average, only 50 percent of the com-pleted units pass the fi nal inspection. The prime costs per completed board are direct materials $25 and direct labor $5. Information pertaining to manufacturing overheads for printed-circuit boards follows:
Overhead Rate Unit of Factory Activity per Units of Cost Driver Overhead Cost Pool Cost Driver Cost Driver per Board per Board
Axial insertion Number of axial insertions $0.15 30 $ A? Hardware insertion Number of hardware insertions 1.85 B? 37.00 Hand load Boothroyd time C? 5 35.50 Masking Number of points masked 0.08 100 D? Final test Test time F? 10 E?
Required Fill in the unknowns identifi ed as A through F.
5-44 Cost of Meal The following excerpt appeared in a syndicated advice column (March 20, 2003).
Dear Annie:
I attend out-of-town meetings and often am invited to join clients and associates for dinner. There is no way for me to politely refuse. The problem is, I can only afford so much for my meal. However, when the server comes to take our orders, one of the Big Shots invariably says to put the meal on one check. The others proceed to order expensive meals and wine, and we split the bill equally. I end up paying for a dinner that I can’t afford, yet to ask for a separate check would be embarrassing.
How can I handle this situation?
Bottom of the Totem Pole in Wisconsin
Required If you were Annie, how would you respond to this reader?
5-45 Product-Line Profi tability, ABC Supermart Food Stores (SFS) has experienced net operating losses in its frozen food products line in the last few periods. Management believes that the store can improve its profi tability if SFS discontinues frozen foods. The operating results from the most recent period are:
Frozen Food Baked Goods Fresh Produce
Sales $120,000 $90,000 $158,125 Cost of goods sold 105,000 67,000 110,000
SFS estimates that store support expenses are approximately 20 percent of revenues. The controller says that not every sales dollar requires or uses the same amount of store
support activities. A preliminary analysis reveals store support activities for these three product lines are:
Frozen Food Baked Goods Fresh Produce
Order processing (number of purchase orders) 10 55 90 Receiving (number of deliveries) 10 70 120 Shelf-stocking (number of hours per delivery) 2 0.5 4 Customer support (items sold) 30,000 40,000 86,000
The controller estimates activity-cost rates for each activity as follows:
Order processing $ 80 per purchase order Receiving $ 110 per delivery Shelf-stocking $ 15 per hour Customer support $0.20 per item
Required Prepare a product-line profi tability report for SFS under the current costing system.
Prepare a product-line profi tability report for SFS using the new information the controller provides.
What new insights does the ABC system in requirement 2 provide to SFS managers?
5-46 Customer Profi tability Analysis Doreen Company has gathered the following data pertaining to activities it performed for two of its major customers.
Jerry Inc. Donald Co.
Number of orders 5 30 Units per order 1,000 200 Sales returns: Number of returns 2 5 Total units returned 40 175 Number of sales calls 12 4
Chapter 5 Activity-Based Costing and Management 153
Doreen sells its products at $200 per unit, net 30. The fi rm’s gross margin ratio is 25 percent. Both Jerry and Donald pay their accounts promptly and no accounts receivable is over 30-days. After a careful analysis using a business intelligence software on the operating data for the past 30 months the fi rm has determined the following activity costs:
Activity Cost Driver and Rate
Sales calls $ 1,000 per visit Order processing $ 300 per order Deliveries $ 500 per order Sales returns $ 100 per return and $5 per unit returned Sales salary $100,000 per month
Required Classify activity costs into cost categories and compute the total cost for Doreen Company to service Jerry Inc. and Donald Co.
Compare the profi tability of these two customers (ignore cost of funds).
5-47 Customer Profi tability Analysis Garner Industries manufactures precision tools. The fi rm uses an activity-based costing system. CEO Deb Garner is very proud of the accuracy of the system in de-termining product costs. She noticed that since the installment of the ABC system 10 years earlier the fi rm had become much more competitive in all aspects of the business and earned an increasing amount of profi ts every year.
In the last two years the fi rm sold 1 million units to 4,100 customers each year. The manufactur-ing cost is $600 per unit. In addition, Garner has determined that the order-fi lling cost is $100.50 per unit. The $784.56 selling price per unit includes 12 percent markup to cover administrative costs and profi ts.
The order-fi lling cost per unit is determined based on the fi rm’s costs for order-fi lling activities. Order fi lling capacity can be added in blocks of 60 orders. Each block costs $60,000. In addition, the fi rm incurs $1,500 order-fi lling costs per order.
Garner serves two types of customers designated as PC (Preferred Customer) and SC (Small Customer). Each of the 100 PCs buys, on average, 5,000 units in two orders. The fi rm also sells 500,000 units to 4,000 SCs. On average each SC buys 125 units in 10 orders. Ed Cheap, a buyer for one PC, complains about the high price he is paying. Cheap claims that he has been offered a price of $700 per unit and threatens to take his business elsewhere. Garner does not give in because the $700 price Cheap demands is below her cost. Besides, she has recently raised the price to SC to $800 per unit and experienced no decline in orders.
Required Demonstrate how Garner arrives at $100.50 order-fi lling cost per unit.
What would be the amount of loss (profi t) per unit if Garner sells to Cheap at $700 per unit?
What is the amount of loss (profi t) per unit at the $800 selling price per unit for units sold to SC?
1.
2.
1.
2.
3.
5-48 Activity Based Costing; Customer Group Cost Analysis Hawler/Perkins Inc. (HPI) manufactures bedroom furniture in sets (a set includes a dresser, two queen-size beds, and one bedside table) for use in motels and hotels. HPI has three customer groups, which it calls the value, quality, and luxury groups. The value products are targeted to low-price motels that are looking for simple furniture, while the luxury furniture is targeted to the very best hotels. The value line is attractive to a variety of hotels and motels that appreciate the combination of quality and value. Currently there has been a small increase in the low-cost and value lines, and an appreciable increase in demand in the luxury line, refl ecting cyclical changes in the marketplace. Luxury hotels are now in more demand for business travel, while a few years ago, the value segment was the most popular for business travel-ers. HPI wants to be able to respond to the increased demand with increased production but worries about the increased production cost and about price setting as its mix of customers and production change. HPI has used a volume-based rate based on direct labor hours for some time. Direct labor cost is $12 per hour.
The production data for the three product lines follows.
Product Lines Value Quality Luxury
Units produced 15,000 5,000 500 Price $ 300 $ 400 $500 Direct materials cost per unit 80 50 110 Number of parts per unit 30 50 120 Direct labor hours per unit 4 5 7 Machine hours per unit 3 7 15 Production orders 50 70 200 Production setups 20 50 50 Orders shipped 1,000 2,000 300 Number of inspections 2 6 14
Required Determine the unit cost for each of the three products and the total production cost of each of the three product lines using activity-based costing.
Determine the unit production cost for each of the three products using HPI’s current volume-based approach.
The activity usage data given in the problem refl ects current usage of the various cost drivers to manu-facture the fi rm’s product lines. Suppose you are given the following information regarding the fi rm’s practical capacity for each of these activities, as follows:
Cost Driver Practical Capacity
Number of parts 990,000 Number of production orders 800 Number of setups 200 Machine hours 100,000 Direct labor hours 123,900 Number of orders shipped 5,000
Comment on how you would use this additional information for costing the fi rm’s products and assisting in strategic planning.
Compare the two approaches and discuss the strategic and competitive issues of using each of the two methods.
5-49 Cost Pools and Cost Drivers Based on a recent study of its manufacturing operations Johnston Manufacturing Corporation has identifi ed six resource consumption cost drivers. These cost drivers and their budgeted activity levels for the coming year are:
Cost Driver Activity Level
Number of purchase orders 6 Number of production runs (2,500 per production run) 40 Machine hours 100,000 Factory space (square feet) 24,000 Units of production 100,000 Engineering hours 20,000
1.
2.
3.
4.
Budgeted Cost Cost Driver
Materials handling $ 349,600 Number of PartsProduct scheduling 160,000 Number of Production ordersSetup labor 216,000 Number of setupsAutomated machinery 1,750,000 Machine hoursFinishing 619,500 Direct labor hoursPack and ship 285,000 Number of orders shipped $3,380,100General, selling, and adm. costs $ 500,000
Chapter 5 Activity-Based Costing and Management 155
The fi rm has budgeted the following costs for the year:
Engineering design $600,000 Depreciation—building 50,000 Depreciation—machine 40,000 Electrical power (for factory building) 6,000 Electrical power (for machining) 30,000 Insurance 20,000 Property taxes 15,000 Machine maintenance—labor 11,000 Machine maintenance—materials 9,000 Natural gas (for heating) 8,000 Inspection of fi nished goods 7,000 Setup wages 20,000 Receiving 10,000 Inspection of direct materials on receiving 3,000 Purchasing 20,000 Custodial labor 51,000
With the exception of the factory space cost pool, which uses machine hours as the activity consumption cost driver, other cost pools have identical resource and activity consumption cost drivers.
Required Identify the most appropriate activity cost pool for each of the cost items and cost driver for each activity cost pool you identifi ed.
Johnston has received a request to quote the price for 4,000 units of a new product. The production will require 100 engineering-hours and 4,250 machine-hours. What is the manufacturing overhead per unit the fi rm should use in determining the price?
5-50 Activity-Based Costing, Value Chain Activities Hoover Company uses activity-based costing and provides this information:
Manufacturing Activity Cost Driver Overhead Rate
Materials handling Number of parts $ 0.45 Machinery Number of machine-hours 51.00 Assembly Number of parts 2.85 Inspection Number of fi nished units 30.00
Hoover has just completed 80 units of a component for a customer. Each unit required 105 parts and 3 machine-hours. The prime cost is $1,200 per fi nished unit. All other manufacturing costs are classifi ed as manufacturing overhead.
Required Compute the total manufacturing costs and the unit costs of the 80 units just completed using ABC costing.
In addition to the manufacturing costs, the fi rm has determined that the total cost of upstream activities including research and development and product design is $180 per unit. The total cost of downstream activities, such as distribution, marketing, and customer service is $250 per unit. Compute the full prod-uct cost per unit, including upstream, manufacturing, and downstream activities. What are strategic implications of this new cost result?
Explain to Hoover Company the usefulness of calculating the total value-chain cost and of knowing costs of different value-creating activities.
5-51 Volume-Based Costing Versus ABC The California Cooking Oil Company (CCO) has been using machine-hours as the basis to determine overhead costs for all products. An ABC project team points out that the fi rm manufactures several products, each of which use signifi cantly different factory
supporting resources. As a start, the team suggests the following overhead cost pools, cost drivers, and estimated cost driver levels for manufacturing overheads:
Machine setups Number of setups 100 $100,000 Materials handling Number of barrels 8,000 80,000 Quality control Number of inspections 1,000 200,000 Other overhead cost Machine-hours 10,000 100,000
CCO has recently completed production of 500 barrels each of P5 and G23. P5 is a cornbased oil distributed primarily through supermarkets. G23 is made from olive oil, fl axseed oil, and other exotic ingredients and sold to up-scale restaurants as gourmet foods. The productions require the following operations:
Required Determine the overhead costs per barrel of P5 and G23 using the current single cost driver system based on machine-hours.
Determine the overhead costs per barrel of P5 and G23 using the multiple cost driver system suggested by the ABC project team.
Explain how the choice of costing system can be an important competitive factor for CCO. How can the costing system help the fi rm become more profi table and competitive?
5-52 Volume-Based Costing Versus ABC West Chemical Company produces three products. The operating results of 2007 are:
Product Sales Quantity Target Price Actual Price Difference
A 1,000 $279.00 $280.00 $ 1.00 B 5,000 $294.00 $250.00 <$ 44.00> C 500 $199.50 $300.00 $100.50
The fi rm sets the target price of each product at 150 percent of the product’s total manufactur-ing cost. Recognizing that the fi rm was able to sell Product C at a much higher price than the target price of the product and lost money on Product B, Tom Watson, CEO, wants to promote Product Cmuch more aggressively and phase out Product B. He believes that the information suggests that Product C has the greatest potential among the fi rm’s three products since the actual selling price of Product C was almost 50 percent higher than the target price while the fi rm was forced to sell Product B at a price below the target price.
Both the budgeted and actual factory overheads for 2007 are $493,000. The actual units sold for each product also are the same as the budgeted units. The fi rm uses direct labor dollars to estimate man-ufacturing overhead costs. The direct materials and direct labor costs per unit for each product are:
Product A Product B Product C
Direct materials $50.00 $114.40 $65.00 Direct labor 20.00 12.00 10.00 Total prime cost $70.00 $126.40 $75.00
Chapter 5 Activity-Based Costing and Management 157
The controller noticed that not all products consumed factory overheads similarly. Upon further investigations, she identifi ed the following usages of factory overheads during 2007:
Product A Product B Product C Total Overhead
Number of setups 2 5 3 $ 8,000 Weight of direct materials (pounds) 400 250 350 100,000 Waste and hazardous disposals 25 45 30 250,000 Quality inspections 30 35 35 75,000 Utilities (machine-hours) 2,000 7,000 1,000 60,000 Total $493,000
Required Determine the amount of overhead cost per unit and the total overhead for each of the products.
Is Product B the least profi table and Product C the most profi table under both the current and the ABC costing systems?
What is the new target price for each product based on 150 percent of the new costs under the ABC system? Compare this price with the actual selling price.
Comment on the result from a competitive and strategic perspective. As a manager of West Chemical, de-scribe what actions you would take based on the information provided by the activity-based unit costs.
5-53 Ethics, Cost System Selection Aero Dynamics manufactures airplane parts and engines for a vari-ety of military and civilian aircrafts. The company is the sole provider of rocket engines for the U.S. military that it sells for full cost plus a 5 percent markup.
Aero Dynamics’s current cost system is a direct labor-hour-based overhead allocation system. Recently, the company conducted a pilot study on the feasibility of using an activity-based costing system. The study shows that the new ABC system, while more accurate and timely, will result in the assignment of lower costs to the rocket engines and higher costs to the company’s other products. Apparently, the current direct labor-based costing system overcosts the rocket engines and undercosts the other products. On hearing of this, top management has decided to scrap the plans to adopt the ABC system because its rocket engine business with the military is signifi cant and the reduced cost would lower the price and, thus, the profi t for this part of Aero Dynamics’s business.
Required As the management accountant participating in this ABC pilot study project, what is your re-sponsibility when you learn that top management has decided to cancel the plans for the ABC system? Can you ignore your professional ethics code in this case? What would you do?
5-54 Volume-Based Costing Versus ABC Gorden Company produces a variety of electronic products. One of its plants produces two laser printers, Speedy and Deluxe. At the beginning of 2006, the fol-lowing data were prepared for this plant:
Deluxe Speedy
Quantity 50,000 400,000 Selling price $475.00 $300.00 Unit prime cost $180.00 $110.00 Unit overhead cost $ 20.00 $153.60
The unit overhead cost is calculated using the predetermined overhead application rate based on direct labor-hours.
Upon examining the data, the marketing manager was particularly impressed with the per-unit profi tability of the Deluxe printer and suggested that more emphasis be placed on producing and selling this product. The plant supervisor objected to this strategy, arguing that the Deluxe model required a very delicate manufacturing process. The supervisor believed that the cost of the Deluxe printer was likely to be much higher than reported.
Required Using the projected data based on the fi rm’s current costing system, calculate gross profi t per unit and gross profi t percentage for each product.
Using the suggested multiple cost drivers overhead rates, calculate the overhead cost per unit for each product and determine gross profi t per unit and gross profi t percentage for each product.
Based on your results, evaluate the suggestion of the marketing manager to emphasize the Deluxe model.
How does ABC contribute to Gorden’s competitive advantage?
5-55 Volume-Based Costing Versus ABC Hairless Company manufactures a variety of plastic shavers for men and women. The company’s plant is partially automated. The company uses an activity-based cost system based on the following budget data:
Overhead Overhead Cost Pool Cost Cost Driver Level for Cost Driver
Machine depreciation/maintenance $135,000 Machine-hours 27,000 Machine-hours Factory depreciation/utilities/insurance $120,000 Machine-hours 30,000 Machine-hours Product design $504,000 Hours in design 42,000 Design hours Material purchasing/storage $147,000 Raw materials cost $980,000
Two current product orders have these requirements:
15,000 Men’s Shavers 20,000 Women’s Shavers
Direct labor-hours 24 12 Raw materials cost $30,000 $26,000 Hours in design 15 37.5 Machine-hours 50 40
Required What total overhead should be assigned to each product order?
What is the overhead cost per shaver?
Compute the predetermined overhead rate if the fi rm uses a volume-based overhead rate based on direct labor-hours. The direct labor budget for the year is 3,020 hours.
Compute the total overhead cost assigned to each production order using the plantwide overhead rate.
What is the overhead cost per shaver using the volume-based overhead rate?
5-56 Resource and Activity-Based Cost Drivers EyeGuard Equipment Inc (EEI) manufactures protec-tive eyewear for use in commercial and home applications. The product is also used by hunters, home woodworking hobbyists, and in other applications. The fi rms has two main product lines—the highest-quality product is called Safe-T, and a low-cost, value version is called Safe-V. Information on the factory conversion costs for EEI is as follows:
Chapter 5 Activity-Based Costing and Management 159
EEI uses ABC costing to determine the unit costs of its products. The fi rm uses resource consump-tion cost drivers based on an estimate of the amount that each activity consumes, as shown below. EEI has four activities: job setup, assembly, inspecting and fi nishing, and packaging.
The activity cost drivers for the two products are summarized below. Additionally, direct material of $3.50 and $6 is required for the Safe-V and Safe-T products, respectively.
Activities Activity Driver
Setup Batch Assembly Units Inspect and Finishing Hours Packaging Hours
Safe-V Safe-T
Batches 250 600 Units 60,000 72,000 Finishing hours, per unit 0.2 0.3 Packaging hours, per unit 0.1 0.15 Materials per unit $ 3.50 $ 6.00
Required Determine the amount of the cost pool for each of the four activities.
Determine the activity-based rates for assigning factory costs to the two products.
Determine the activity-based total cost for each of the products.
What is the strategic role of the information obtained in part 3?
5-57 Resource and Activity-Based Cost Drivers (Continuation of 5-56) Assume the same information as in problem 5-56 above, except that EEI has determined resource-consumption rates based on cost drivers instead of estimated-percentage-consumption rates. The cost drivers and driver levels are given below:
Factory Costs Resource -Driver Resource Total
Salaries $ 850,000 Number of employees 17 Supplies 150,000 Number of machines 10 Factory Expense 550,000 Square feet, fl oor space 22,000 $1,550,000
The resource consumption drivers are used by the activities as follows:
Resource Driver Resource Total Setup Assembly Inspect & Finishing Packaging
Number of employees 17 1 10 5 1 Number of machines 10 1 5 4 Square feet, fl oor space 22,000 2,000 11,000 5,000 4,000
Required Determine the amount of the cost pool for each of the four activities.
Determine the activity-based rates for assigning factory costs to the two products.
Determine the activity-based total cost for each of the products.
5-58 Volume-Based Costing Versus ABC Moden Lighting Inc. (MLC) manufactures and sells lighting fi xtures. The company has two main product lines, ceiling fi xtures and luxury pendants. Its products
are sold through industry and wholesale suppliers. During a recent executive meeting, Bob Brighten, the vice president of marketing, made three observations: First, the price of the Ceiling Fixture (CF), a high-volume product for the fi rm, is often higher than that of competitors’ products. Second, MLC has been struggling to maintain its market share of CF. Third, the fi rm has sold approximately the same number of units of Luxury Pendant (LP), a high margin product, despite a 7.5 percent increase in price. Noting that the profi t margin per unit of LP is higher than that of CF, Brighten has suggested that MLC should push for producing and selling of LP. Regina Jones, the plant manager, objected to this strategy because the manufacturing processes of LP were much more complicated than those for CF. The total manufacturing costs would increase substantially if MLC shifted its product line to emphasize LP.
Aaron Higgins, the vice president of fi nance, observes that MLC uses a direct labor costbased system to determine the amount of manufacturing overhead for all of its products. For each direct la-bor dollar the fi rm attaches $2.00 overhead cost. Selected operating data for the year 2007 follow:
Cost per Unit
Product Units Sold Direct Materials Direct Labor Selling Price per Unit
LP 4,000 $20 $8 $70 CF 40,000 10 5 40
Aaron also has collected the following data on activity cost pools and their cost drivers:
Cost Pools/Activities Cost Drivers
Machine operation Machine-hours Support labor overhead Direct labor costs Machine setup Setup hours Assembly Number of parts Inspection Inspection hours
Estimated Overhead Costs and Activity Consumption Information for Cost Pools and Activities
Aaron explained why these cost drivers were appropriate:
The overhead costs for machine operation had nothing to do with the direct labor-hours. These costs were more likely to vary with the number of machine-hours. The support labor included allowances for benefi ts, break periods and costs related to the super-vising and engineering staff. This overhead was indirect to the products but was related to the direct labor costs.
The setup overhead was generated by changing the job to be run and should be related to the setup hours rather than the direct labor-hours.
The assembly overheads related to costs incurred to assemble parts. The more parts needed, the higher the overhead costs. Therefore, the correct cost driver should be the number of parts.
The inspection overhead arose from checking the fi nished goods. The higher the number of fi n-ished units, the higher the inspection overhead costs. The appropriate cost driver should be the number of hours spent on the inspection.
Required Using the current costing system, which uses direct labor costs as the basis to determine overhead costs, calculate the unit manufacturing costs of the two products.
Using the activity-based costing system, calculate the unit manufacturing costs of the two products.
Chapter 5 Activity-Based Costing and Management 161
Under ABC, is the Luxury Pendant as profi table as the vice president of marketing thinks it is under the existing costing system?
Evaluate the marketing vice president’s suggestion to shift the sales mix in favor of the Luxury Pendant units.
Give at least two reasons for the differences between the results for the two different costing systems.
5-59 Volume-Based Costing Versus ABC ADA Pharmaceutical Company produces three drugs: Diomy-cin, Homycin, and Addolin belonging to the analgesic (pain-killer) family of medication. Since its inception four years ago, ADA has used a direct labor-hour-based system to assign manufacturing overhead costs to products.
Eme Akpaffi ong, the president of ADA Enterprises, has just read about activity-based costing in a trade journal. With some curiosity and interest, she asked her fi nancial controller, Takedo Simon, to examine differences in product costs between the fi rm’s current costing and activity-based costing systems.
ADA has the following budget information for the year:
Diomycin Homycin Addolin
Cost of direct materials $ 205,000 $265,000 $258,000 Cost of direct labor 250,000 234,000 263,000 Number of direct labor-hours 7,200 6,800 2,000 Number of capsules 1,000,000 500,000 300,000
ADA has identifi ed the following activities as cost drivers and has allocated them to total over-head cost of $200,000 as follows:
Machine setup Setup hours $ 16,000 1,600 Plant management Workers 36,000 1,200 Supervision of direct labor Direct labor-hours 46,000 1,150 Quality inspection Inspection-hours 50,400 1,050 Expediting orders Customers served 51,600 645 Total overhead $200,000
Takedo selected the cost drivers with the following justifi cations:
SETUP HOURS: The cost driver of setup hours is used because the same product takes about the same amount of setup time regardless of size of batch. For different products, however, the setup time varies.
NUMBER OF WORKERS: Plant management includes plant maintenance and correspond-ing managerial duties that make production possible. This activity depends on the number of workers. The more workers involved, the higher the cost.
SUPERVISION OF DIRECT LABOR: Supervisors spend their time supervising produc-tion. The amount of time they spend on each product is proportional to the direct labor hours worked.
QUALITY INSPECTION: Inspection involves testing a number of units in a batch. The time varies for different products but is the same for all similar products.
NUMBER OF CUSTOMERS SERVED: The need to expedite production increases as the number of customers served by the company increases. Thus, the number of customers served by ADA is a good measure of expediting production orders.
Takedo gathered the following information about the cost driver volume for each product:
Diomycin Homycin Addolin
Machine setups 200 600 800 Plant management 200 400 600 Supervision of direct labor 200 300 650 Quality inspection 150 200 700 Expediting production orders 45 100 500
Required Use the fi rm’s current costing system to calculate the unit cost of each product.
Use the activity-based cost system to calculate the unit cost of each product.
The two cost systems provide different results; give several reasons for this. Why might these differences be strategically important to ADA Enterprises? How does ABC add to ADA’s competitive advantage?
How and why may fi rms in the pharmaceutical industry use ABC? What is the strategic advantage?
5-60 Volume-Based Costing Versus ABC Alaire Corporation manufactures several different printed-cir-cuit boards, but two of the boards account for the majority of the company’s sales. The fi rst product, a television (TV) circuit board, has been a standard in the industry for several years. The market for this board is competitive and price sensitive. Alaire plans to sell 65,000 of the TV boards in 2007 at $150 per unit. The second product, a personal computer (PC) circuit board, is a recent addition to Alaire’s product line. Because it incorporates the latest technology, it can be sold at a premium price. The 2007 plans include the sale of 40,000 PC boards at $300 per unit.
Alaire’s management group is meeting to discuss strategies for 2007. The current topic of con-versation is how to spend the sales and promotion dollars for 2007. The sales manager believes that the market share for the TV board could be expanded by concentrating Alaire’s promotional efforts in this area. In response to this suggestion, the production manager said, “Why don’t you go after a bigger market for the PC board? The cost sheets that I get show the contribution from the PC board is about double the contribution from the TV board. I know we get a premium price for the PC board; selling it should help overall profi tability.”
Alaire’s current volume-based costing system shows these data for TV and PC boards:
TV Board PC Board
Direct materials $80 $140 Direct labor 1.5 hours 4 hours Machine time .5 hour 1.5 hours
The current costing system uses three types of factory overhead: variable factory, materials hand-ling, and machine time. Variable factory overhead is applied on the basis of direct labor hours. For 2007, Alaire budgeted at $1,120,000 variable factory overhead and 280,000 direct labor-hours. The hourly rates for machine time and direct labor are $10 and $14, respectively. Alaire applies a materials-handling charge at 10 percent of direct materials cost, which is not included in variable factory overhead. Total 2007 expenditures for direct materials are budgeted at $10,800,000.
The company conducted an activity analysis and collected the following information for 10 activities:
1.
2.
3.
4.
Budgeted Overhead Costs Cost Driver Annual Activity for Cost Driver
Materials-related overhead Procurement $ 400,000 Number of parts 4,000,000 Production scheduling 220,000 Number of boards 110,000 Packaging and shipping 440,000 Number of boards 110,000 $1,060,000Variable overhead Machine setup $ 446,000 Number of setups 278,750 Hazardous waste disposal 48,000 Pounds of waste 16,000 Quality control 560,000 Number of inspections 160,000 General supplies 66,000 Number of boards 110,000 $1,120,000Manufacturing overhead Machine insertion $1,200,000 Number of insertions 3,000,000 Manual insertion 4,000,000 Number of insertions 1,000,000 Wave soldering 132,000 Number of boards 110,000 $5,332,000
Chapter 5 Activity-Based Costing and Management 163
Ed Welch, Alaire’s controller, believes that before the management group proceeds with the discus-sion about allocating sales and promotional dollars to individual products, it might be worthwhile to look at these products on the basis of the activities involved in their production. As Ed explained to the group, “Activity-based costing integrates the cost of all activities, known as cost drivers, into individual product costs rather than including these costs in overhead pools.” He prepared the pre-ceding information to help the management group understand this concept.
“Using this information,” Ed explained, “we can calculate an activity-based cost for each TV board and each PC board and then compare it to the standard cost we have been using. The only cost that remains the same for both cost methods is the cost of direct materials. The cost drivers will replace the direct labor, machine time, and overhead costs in the old standard cost fi gures.”
Required On the basis of Alaire’s current costing system and its cost data (direct materials, direct labor, materials-handling charge, variable overhead, and machine time overhead) given in the problem, calculate the total contribution margin expected in 2007 for Alaire Corporation’s TV board and PC board.
On the basis of activity-based costs, calculate the total contribution margin expected in 2007 for Alaire Corporation’s TV board and PC board.
Explain how the comparison of the results of the two costing methods might affect the sales, pricing, and promotion decisions made by Alaire Corporation’s management group. How would it affect the strategic, competitive position of the fi rm.
5-61 Volume-Based Costing Versus ABC Coffee Bean, Inc. (CBI) processes and distributes a variety of coffee. CBI buys coffee beans from around the world and roasts, blends, and packages them for resale. Currently the fi rm offers 15 coffees to gourmet shops in one-pound bags. The major cost is direct materials; however, a substantial amount of factory overhead is incurred in the predominantly automated roasting and packing process. The company uses relatively little direct labor.
Some of the coffees are very popular and sell in large volumes; a few of the newer brands have very low volumes. CBI prices its coffee at full product cost, including allocated overhead, plus a markup of 30 percent. If its prices for certain coffees are signifi cantly higher than the market, CBI lowers its prices. The company competes primarily on the quality of its products, but customers are price conscious as well.
Data for the 2007 budget include factory overhead of $3,000,000, which has been allocated by its current costing system on the basis of each product’s direct labor cost. The budgeted direct labor cost for 2007 totals $600,000. The fi rm budgeted $6,000,000 for purchases and use of direct materi-als (mostly coffee beans).
The budgeted direct costs for one-pound bags of two of the company’s products are as follows:
Mona Loa Malaysian
Direct materials $4.20 $3.20 Direct labor 0.30 0.30
CBI’s controller, Mona Clin, believes that its current product costing system could be providing misleading cost information. She has developed this analysis of the 2007 budgeted factory overhead costs:
Data regarding the 2007 production of two of its lines, Mona Loa and Malaysian, follow. There is no beginning or ending direct materials inventory for either of these coffees.
Mona Loa Malaysian
Budgeted sales 100,000 pounds 2,000 pounds Batch size 10,000 pounds 500 pounds Setups 3 per batch 3 per batch Purchase order size 25,000 pounds 500 pounds Roasting time 1 hour per 100 pounds 1 hour per 100 pounds Blending time 0.5 hour per 100 pounds 0.5 hour per 100 pounds Packaging time 0.1 hour per 100 pounds 0.1 hour per 100 pounds
Required Using Coffee Bean, Inc.’s current product costing system,
a. Determine the company’s predetermined overhead rate using direct labor cost as the single cost driver.
b. Determine the full product costs and selling prices of one pound of Mona Loa coffee and one pound of Malaysian coffee.
Using an activity-based costing approach, develop a new product cost for one pound of Mona Loa coffee and one pound of Malaysian coffee. Allocate all overhead costs to the 100,000 pounds of Mona Loa and the 2,000 pounds of Malaysian. Compare the results with those in requirement 1.
What are the implications of the activity-based costing system with respect to CBI’s pricing and product mix strategies? How does ABC add to CBI’s competitive advantage?
(CMA Adapted)
5-62 Cost of Capacity (Continuation of 5-61) Use the same information as above for Coffee Bean, Inc (CBI) except assume now that Mona Loa and Malaysian are the only two products at CBI. Also, now include the following additional information about the practical capacity Coffee Bean has in each of its activities. For example, currently Coffee Bean has total practical capacity for processing 1,400 purchase orders, 2,400 setups, etc. These are the levels of activity work that are sustainable.
Required Determine the activity rates based on practical capacity and the cost of unused capacity for each activity.
Explain the strategic role of the information you have developed in part (1) above.
Assume the same information used in parts (1) and (2) above, but now assume also that the costs in the purchasing activity consists entirely of the cost of 8 employees; the cost in materials handling consists entirely of the cost of 20 employees; the cost of quality control consists entirely of the cost of 4 emplo-yees; the cost of roasting and blending consists entirely of the costs of machines—10 roast-ing machines and 10 blending machines; and the cost of packaging consists entirely of the cost of 3 employees. Based on this additional information, what can you now advise management about the utilization of capacity?
Chapter 5 Activity-Based Costing and Management 165
5-63 Customer Profi tability Analysis Boston Depot sells offi ce supplies to area corporations and organizations. Tom Delayne, founder and CEO, has been disappointed with the operating results and the profi t margin for the last two years. Business forms are mostly a “commodity” business with low profi t margins. To increase profi t margins and gain competitive advantages, Delayne introduced “Desk-Top Delivery” service. The business seems to be as busy as ever. Yet, the operating income has been declining. To help identify the root cause of declining profi ts, he decided to analyze the profi tability of two of the fi rm’s major customers: Omega International (OI) and City of Albion (CA).
According to the customer profi tability analysis that Boston Depot conducts regularly, Boston Depot has the same amount of total sales with both OI and CA. However, the fi rm earns a higher gross margin and gross margin ratio from CA than those from the sales to OI, as demonstrated here:
Boston Depot adds a fl at l7.5 percent to all sales for expenses incurred in such activities as handling customers’ requests, pick-packing, order delivery, warehousing, and data entry. However, not all customers require the same level of services. Operation Manager, Jamie Steel, points out that CA has been a much heavier service user than OI. She shows the following data to support her belief:
Distribution Services Activities for OI and CA
OI CA
Number of requisitions 300 700 Requisition line (all pick-packing) 900 2,100 Average number of cartons in warehouse 50 500 Number of miles per delivery 5 6
Controller Rod Jay has been investigating ways to determine the costs of performing various activities. He summarized his fi ndings:
Requisitions handling $3,000,000 Requisitions 300,000 Warehouse 1,050,000 Number of cartons 70,000 Pick-packing 900,000 Pick-pack lines 600,000 Data entry 600,000 Pick-pack lines 600,000 Delivery charge $10 per requisition (delivery) plus $0.30 per mile
Steel points out that activities cost money. Two customers who request different service activities most likely are not costing the fi rm the same.
Required Using activity-based costing, compute the charges per unit of service activities.
Using activity-based costing, compute the total distribution costs for each of the customers.
Is the City of Albion a more profi table customer?
Is Omega International a better customer for Boston Depot?
5-64 Activity-Based Costing Miami Valley Architects Inc. provides a wide range of engineering and architectural consulting services through its three branch offi ces in Columbus, Cincinnati, and Dayton, Ohio. The company allocates resources and bonuses to the three branches based on the
net income of the period. The results of the fi rm’s performance for the year 2006 follows ($ in thousands):
Columbus Cincinnati Dayton Total
Sales $1,500 $1,419 $1,067 $3,986 Less: Direct labor 382 317 317 1,016 Direct materials 281 421 185 887 Overhead 710 589 589 1,888 Net income $ 127 $ 92 $ (24) $ 195
Miami Valley accumulates overhead items in one overhead pool and allocates it to the branches based on direct labor dollars. For 2006, this predetermined overhead rate was $1.859 for every direct labor dollar incurred by an offi ce. The overhead pool includes rent, depreciation, and taxes, regard-less of which offi ce incurred the expense. Some branch managers complain that the overhead alloca-tion method forces them to absorb a portion of the overhead incurred by the other offi ces.
Management is concerned with the 2006 operating results. During a review of overhead ex-penses, management noticed that many overhead items were clearly not correlated to the movement in direct labor dollars as previously assumed. Management decided that applying overhead based on activity-based costing and direct tracing wherever possible should provide a more accurate picture of the profi tability of each branch.
An analysis of the overhead revealed that the following dollars for rent, utilities, depreciation, and taxes could be traced directly to the offi ce that incurred the overhead ($ in thousands):
Columbus Cincinnati Dayton Total
Direct overhead $180 $270 $177 $627
Activity pools and their corresponding cost drivers were determined from the accounting records and staff surveys as follows:
General administration $ 409,000Project costing 48,000Accounts payable/receiving 139,000Accounts receivable 47,000Payroll/Mail sort and delivery 30,000Personnel recruiting 38,000Employee insurance processing 14,000Proposals 139,000Sales meetings/Sales aids 202,000Shipping 24,000Ordering 48,000Duplicating costs 46,000Blueprinting 77,000 $1,261,000
Chapter 5 Activity-Based Costing and Management 167
Required (Round all answers to thousands) What overhead costs should be assigned to each branch based on ABC concepts?
What is the contribution of each branch before subtracting the results obtained in requirement 1?
What is the profi tability of each branch offi ce using ABC?
Evaluate the concerns of management regarding the volume-based cost technique currently used.
5-65 Customer Profi tability Analysis Spring Company collected the following data pertaining to its ac-tivities with selected customers.
HS Inc. Adventix Baldwin
Total sales $600,000 $750,000 $900,000 Sales discount 2% 3% 2% Sales terms 2/10, n/30 1/15, n/60 2/10, n/eom Shipping terms FOB Shipping point FOB Destination FOB Destination Sales returns 2% 1% 3% Number of orders 10 5 50 Units per order 100 250 30 Expedited order 0 2 5 Sales visits 1 1 2 Number of sales returns 3 4 10
Spring Company mails monthly statements on or before the fi rst day of each month. HS pays all of its account payables within the cash discount periods. Baldwin does not take advantage of cash discounts. However, it pays its accounts on the specifi ed due dates. Adventix pays half of its accounts on the date that these accounts are due and pays the remainder at the end of the following month. Joan Lieberman, the controller of Spring Company, has estimated that the cost of working capital is approximately 2 percent per month.
Lieberman also gathered the following cost data:
Activity Cost Driver and Rate
Order taking $ 50 per order Order processing $ 75 per order Delivery $300 per delivery Expedited orders $500 per order Restocking $ 10 per unit plus $200 per return Sales visits $800 per visit
Required Prepare and interpret a customer profi tability analysis for Spring Company. How does it help Spring Company become more competitive and profi table?
1.
2.
3.
4.
Volume-Based Costing Versus ABC
1. Volume-based costing system
Stage 1 Allocation
Total overhead allocated to Department A $ 1,000,000 × ( 4,000 / 20,000 ) = $ 200,000 Total overhead allocated to Department B $ 1,000,000 × ( 16,000 / 20,000 ) = $ 800,000
Number of production runs $ 7,000 350 $ 20 Number of setups 400,000 500 800 Number of units 588,000 19,600 30 Number of shipments 5,000 250 20 $1,000,000