Phaie I RI umpling conducted in May 1988 Phaae II RI lampling conducted in April 1989
NC bull No criteria cxitta for thia compound
(1) Inaufficient Data to Develop Criteria Value preaented ia LOEL shy Loweit Obierved Effect Level
(2) Value preaented for carelnogeiia ia the 10-5 level
(3) Value preaented ia for dichloroethenea
(4) Value preieoted ia for trana 12-dichloroetliene
(5) pH dependent criteria (78 pH uted)
(6) Value preaented ia for chlorinated benzenea
(7) Value presented ia for total PCBa
(8) Effluent DiKhaige Limit based upon an effluent discharge of 5 gpm to the Neponset River during the 7-day low flow lOyr recurrence (2O20gpm)
USGS Pleasant Street Oauging Station on the Neponset River
(9) Dilution factor =[(5gpm+2020gpm)5gpml= 405
(lO)Concentration exceeds effluent discharge limit contaminant must be removed by Groundwater Treatment Plant before discharge to surface water [D=DAILY MAX A=AVG MONTHLY F=FISH]
-
-
-
- - -
-
-
-
-
-
o n o TABLE 1-3 COMPARISON OF METAL CONTAMINATION IN GROUNDWATER WFTH EFFLUENT DISCHARGE LEVELS - DISCHARGE TO THE NEPONSET RIVER
bull bull bull bull bull bull bull bull bull bull bull bull - bull bull bull bull gt gt bull gt bull bull bull bull bull - bull bulliii|vO|| iS iggJMLnei i iaD s-UNFILTEREDgssHis M-B33nsRmmMMM D A I L Y iiiiiiiiiiiiiAVGiiiiii |i mmmmMmmm Xy lira^li P H A S E I WtiiMM liwiAiiiii iiiiimiii iii-pHiwiiliiiii WampMM P H A S E I ilii iiwgiiiiiiiiiiiiiiiii|iiiii iiiiiiiiiiiiiiiiiiiili|i| iiii iiiiii iiiiiiiiiiiiiiiiiiii M A X I M U M iiiiipifriiii^iiii iiiiiiiiiiiiifiiii iiiiiiiiiiiiiiiii
555^gt5^5V555^^^^ i i i ilaquoiij S U R F A C E m m m Wtm^itM B E D R O C K bull bull gt f t bullbullbull B E D R O C K iiiFRiiliiiiiiiiiiiii iiiiiiijsiiiiiriiiiiiiiiiiiiiiii iiii|iiiiiiliiiiiiii E F F L U E N T E F F L U E N T E F F L U E N T iiiiiiiiiiiiiiiiii wmmm |||ii||li| |i IliAiiiiil WliampiMM liiiiltiilii^isiiii liiiiifctAXliii iiiAiiiiiiiiiiiiiiiii i^i^iibhreiiiiiiiiiiliiiiiiii liiiiiii iiHiiiiiiiiiiiiii- D I S C H A R O E D I S C H A R O E D I S C H A R O E iiiii imm^mi mmmn WmMm WBrnB
PARAlt4ETER W iMmm iiiiiiiii iiitjiiiii Wi^MMM iiii iiiiiiiiilii iiiaraquoliiii W-imMMi iiiiiiaiiiii mMmmmm iCSiiMAiiiiii O O N S U M P iiiiiiiVEitiiii liiiiisyifeEiiiiiiiii iiiiiiiiiitiiiiL iiii cii^i iiiiiifl|5iili iiiiiiili (UOW iiiiiiii (oon) iiiiult3piili (UOL) lzMcii0m (UGL) iipiiiiiiiiiiiiiiiiiiiiii ii|^(Siliiiiiiiiii|iiiiii (UOL) (2) (UOL) (6)C7) (IKJL) (6)C7) (UOn) (6) C7) i^iipi
M E T A L S
A h m i n u m 154000 390000 119 352 12500 43900 74 77 NA NA NA NC NC NC
fMgtimi-^ztm zmisectmi iMiMM wmmi M^iiiiampii iiJiiM 189 iiiiiiiiiisiiiiiilaquo3iii iiiiiiiiiiiiiiiiiiiiiifii iiiiiiiiiiiliiiii^-iiiii isiiiiiiiiiiisiiiii CJiiiiiijiii iiiiiiiiiiiiiStCiiiiiii iiiiiiiiiiiiiiiiiiiiiiiiiiiiM bullsiiiii iiiiiiili5 iiiiiiiiiiiiiii|iiiiiiiiiigtireii iiiiiiii-shy bull bull bull bull bull bull bull bull bull iiiiiiliiiiiiWiii bull bull laquo raquo - iiiiiiiiiililiiiiiiiilifii iiiiiiiiiiii iii|iiiiiiiiiiiiiiii l i i i i i i i i i i^ i l l l i s i i iiiiii i-iiiiiiiSiiiiiiisiiii iiiiiiiiiiiiiiiiii|fltii- 405000 iiiiiiiiiiilliiiiiiiiwii iiiiAiiishymBmmm imampmm WmMM Wimm iiiiillili iiiiiiiiliiiiiii
Lead 43 i t3 21 168 l i 37 30 168 14 (3) 054 p) NC 5670 219 NC
iiititlj^iusibiii^j iilllJii^ -M-W^M iiiiiiii^^i^ ii-|7laquo- L5W iiiiiiiiiiiiiilliiifii iiiiiiiiiiiiiiiltiiiiiiiiiiiiliiiiii ii5iiiiiiie iiiiiiiiiiii bullbull bull l t raquo iiiiiiiiiiiiiiiNC iiiiiiii isci i i i | | i i i | | i p i i II0M^I iiiiiliiiiiiiiilii WM^MmM ilillilflil i | | | l il |o| | l i i l i P liiiiiiiiii iiiiiiiiiiiiip8iii bullbull ( U si i l i l i iiiiii- iiii-li|i5 iiiiiiiiiiiiiiiiiiii iiiiiiiiiiipiiiiiiii-iiiiiiiiiiii -i- o-iil bull iiiiiiiiiiiiiiiiiiiiiiiiiiiM iiiiiiiiiiiiii iiiii iiiiii iiii iiiiii laquoiii
|i|||ii Iliii illl|iillSI |illliSl^| illillaquoii iiiiiiiiiiiiiiiiiiii iiiiiiiiiliiltiii laquo raquo iiiiiiiiiiiii||i||| iiiiiiiiiiiiii iii|i|ltoigttiiiiiiiiiiiiiiii i iiliiiiilii iiiiiiiiiiiii bull^bull i l iNc| i-|iiiii -i-iii ii gti5 i iiiiiiiili^^ iiiiiiiiiiii Oiiiiiiii|i bulliiiiiiii Sodium 14100 28900 12500 26raquo00 16320 33200 16300 68000 N c NC NC Nc NC Nc Thal l ium 10 10 58 10 1400 (1) 40 (1) 32 567000 16200 1296
igtPiiiilli MmmmiM liilililil iiliiiiisii iii|ii| bulliiii iiiiiisiiilii iiiiiiiiiiiii|i ii^|i iiiiiiiiiil iiiiiii iiiiiiii ii^iliiiiiiiNiilliiiiiiiji- bulli|iiiiiflaquoSiiiiiiiiiiiiiiiiii iii|lNe-|i-ii iiiiiiiiiisiiiiiiiiiiiiiiii Nc iiiiiii liiNCii iiiiiii iiiiiiiilifiei iiiii iiiiiii iilaquo|||il| mmmmi m m m i M iiiiiiiili iiiiiiiiiiiiiiiiisil i iiiisiiiiilllii iiiiliiiiiiiiliiiiiiiiiitii iiiiiiiiiiiiiiiiiiiiiiiiiiifiii iiiiiiliili-|s4ii iiilliiiiiiii ssiiiiiiiiiiiiii iiiiiiii^^iii-iiiii iiiiiiiiiiiiiiiiiiiiiiiliii i iiiiiiiiiiiiiiliiiiiiii 13365 iiiiiiiliiiiiiiiiiiiip^ P b a i e I RI sampling conducted in M a y 1988 Phase II RI samplmg conducted in Apri l 1989
N C = N o cri teria exiata for th is compotmd
N A = N o t Available
(1) Insufficient Data to Develop Cri ter ia Value presented is L O E L - Lowest Observed Effect Level
(2) Value preaented for careinogena ia the 10-S level
(3) Hardness dependent c r i te r ia (25 mgA C A C 0 3 uaed)
(4) Value presented is for Ihe m o r e toxic hexavalent form
(5) Value presented is proposed (more conservat ive)
(6) Effluent Discharge L imi t dilution factor based upon an effluent discbarge of 5 gpm to the Neponse t River during the 7 - d a y low flow lOyr recurrence (2020gpm)
USOS Pleasant Street Oaug ing atation on the Neponset River
(7) Dilut ion factor =[(Sgpm+2020gpm)Sgpm]= 405
(lO)Concentration exceeds effluent discharge limit contaminant must be removed by Groundwate r Treatment Plant before discharge to Ihe Neponset River [ D = D A I L Y M A X A = A V O M O N T H L Y F=FISH]
c and 1-3 for effluent (Uscharge limits for organic and inorganic compounds An acute toxicity
test showed that no toxic effect was observed for the interim treatment discharge
114 Conclusions
Based on the results of the Phase I bench scale treatabUity study the combined unit
operations of fUtration foUowed by carbon adsorption were effective in treating the
contaminated groundwater coUected during the pumping tests for temporary discharge to the
Neponset River A sample of the discharge was coUected during the groundwater treatment
and it was found to contain less than the quantitation limit of 05 xgL of PCB The metals
concentrations were aU determined to be below the discharge criteria A sample was also
coUected and submitted for an acute toxicity determination The resuUs showed that no toxic
effect was observed The bench scale treatability results and the on-line discharge analyses
demonstrate that the filtration and carbon adsorption unit operations were effective temporary
treatment techniques
^ 12 FULL SCALE STUDY
A groundwater treatability study was conducted to evaluate the performance of four different
treatment processes on contaminated groundwater obtained from the Norwood PCB site The
contaminants present in the groundwater were determined during previous studies conducted
in May 1988 and AprU 1989 by EBASCO Chapter 1 of the Final FeasibUity Study
(EBASCO 1989c) contains an overview of the results obtained during these investigations
Based on the resuUs of the May 1988 and AprU 1989 field investigations EPA concluded
that the overburden and bedrock aquifers beneath the site were contaminated with
polychlorinated biphenyls (PCBs) and volatUe and semivolatile organic compounds (VOCs
and SVOCs) It was determined that surficial and subsurface soUs dredge pUes of sediments
taken from Meadow Brook sediments in Meadow Brook and sediments in the drainage
system of the buUding operated by Grant Gear were the sources of the contamination In
r
c September 1989 EPA released the Record of Decision (ROD) for the Norwood PCB site In
the ROD EPA directed that groundwater be treated with a system including activated carbon
air stripping with vapor controls and precipitationfiltration iEPA also directed that
treatability studies or pUot studies be conducted to aid in the overaU design of the system
In accordance with the ROD a bench scale treatabUity study was conducted at the ENSECO
Laboratory Facility in Cambridge Massachusetts by Metcalf amp Eddy personnel between
January 14 and February 16 1992 This report presents a description of the work
completed resuUs and conclusions of the study
121 Objectives
The fuU-scale groundwater treatability study was conducted to determine if treatment
consisting of precipitation fUtration air stripping and carbon adsorption would effectively
remove the contamination present in the groundwater at the Norwood PCB site to appUcable
standards Information on the percent reduction of organic and inorganic compounds in the
groundwater volume type of residual and byproducts produced by each component were
also investigated A schematic detailing the treatability study and the sampling and analysis
conducted is presented in Figure 1-1
122 Description of Work
The treatability study was performed in accordance with Pre-Design Work Plan 3 and the
QuaUty Assurance Project Plan for the Phase n Bench-Scale TreatabiUty Study (Work
Plan 3)
Groundwater samples were coUected from the Norwood PCB site for use in this
investigation Interim sampling was performed on effluent streams generated from each
bench-scale process for analysis according to Table 1-4 Influent and final effluent samples
generated during the groundwater treatabiUty were coUected and analyzed through the CLP
^
o JAR TESTING SAMPLE ID
o
POLYMER TESTING
RAW GROUNDWATER
VOL 1 SVOL I p PCB f ^ ^ METALS
mdash SST
T
T
T
SS - Choose Polymer T ar)d Dose Estimate pH pf i After Coagu lant
Jar Test 1 PH10 bull
Lime wCoag wPdymer - SS T Metals
Ume wCoag wo Polymer - SS T Metals
- NaOH wCoag wPolymer - SS T Metals
NaOH wCoag wo Polymer - SS T Metals
Jar Test 2 pH9
Jar Test 3 pH8
bull
Lime w C oag wPdymer - SS T Metals
- Lime wCoag wo Polymer - SS T Metals
- NaOH wCoag wPolymer - SS T Metals
NaOH wCoag wo Polymer - SS T Metals
- Lime wCoag wPolymer - SS T Metals
- Lime wCoag wo Polymer - SS T Metals
- NaOH wCoag wPolymer - SS T Metals
- NaOH wCoag wo Polymer - SS T Metals
JT1 -1 shy
j r i -2 shy
JT1 -3 shy
JTI-4
j r 2 - 1
JT2-2 shy
JT2-3
j r2-4 bull
JT3-1 shy
JT3-2shy
JT3-3 bull
JT3-4 shy
HLTRATION TESTING
RIter Paper 1 - SS T Time mdash |
RIter Paper 2 - SS T Time-
Rlter Paper 3 - SS T Time -
CtHXise Filter Paper or Particle Retention Size
Sample Well Using Bailer
VOL SVOL PCB CLPMETALS (PPF-1)
Precipitate and Filter Using Optimized Polymer pH Coagulant and Filter
system for volatUes semivolatUes PCBs and metals AU interim samples were analyzed at
ENSECO in Cambridge Massachusetts AU data was vaUdated by MampE according to the
QAPP
1221 Groundwater Sample CoUection Groundwater for this study was coUected from
weUs MW-IA and ME-8 as shown on Figure 1-2 iMW-lA was chosen as a sampling
location because it was determined to be one of the most contaminated weUs on-site based
on previous investigations During the course of the treatabiUty study a decision was made
to obtain samples from ME-8 because results of the most recent sampling effort conducted by
ICF indicated that groundwater from this weU contained approximately 200 xgL vinyl
chloride whereas groundwater from MW-IA no longer contained any quantifiable amount
Removal of vinyl chloride by aeration needed to be demonstrated during this investigation
because vinyl chloride is not effectively removed by carbon adsorption
Groundwater samples were obtained on four separate occasions during the study as shown in
Table 1-5 On each occasion the groundwater was coUected in accordance with the Field
Sampling Plan Three weU volumes of water were purged from the weU using a centrifiigal
pump before any samples were coUected The pH temperature and conductivity of the
purge water was measured after each weU volume untU the measured values differed by less
than 10 for three consecutive samples to ensure the sample drawn was representative of the
water in the aquifer Samples for the metals precipitation and filtration study were coUected
using a centrifugal pump Samples for the air stripping and carbon adsorption study were
coUected with a teflon baUer to minimize aeration and possible loss of volatUes during
sample coUection
The samples were coUected in one gallon amber glass bottles and stored at 4degC Each
sample bottle wasfiUed to exclude a headspace in the bottle
e 10
200 200
SCALE IN FEET
D CAP ROCK SAMPLE LOCATION
bull WELLS
nOURE 1-2 GROUNDWATER AND TRENCH AND CAP
ROCK SAMPLING LOCATIONS
11
E T C A L F a EDDY
c TABLE 1-5 GROUNDWATER SAMPLING SUMMARY
Mode of Date WeU Amount Sampled pH Temp degC Conductivity SampUng
11392 MW-IA 10 gallons 62 8deg 220 umhocm pump
12792 MW-IA 16 gaUons 62 8deg 220 umhocm baUer
20392 MW-IA 16 gallons 62 8deg 220 umhocm baUer
20592 ME-8 2 gallons 64 8deg 230 umhocm baUer
1222 Precipitation Testing
General Chemical precipitation for the removal of metals was evaluated at three pH values
and three polymer dosages to determine the effectiveness of the treatment A preliminary
evaluation of different coagulants and polymers was conducted at three pH values by
r Metcalf amp Eddy personnel and a leading polymer vendor to determine which chemicals could
potentiaUy be used to precipitate groundwater Based on the results from the preliminary
evaluation jar tests were conducted by Metcalf amp Eddy personnel to aid in the determination
of the chemical dosages required to optimize the effectiveness of precipitation
Polymer and Coagulent Testing Polymer testing was performed by Metcalf amp Eddy and a
leading polymer vendor at the ENSECO laboratory faciUty in Cambridge Massachusetts
The effectiveness of anionic cationic and nonioiuc polymer was evaluated at three pH
values The best polymer was determined to be Drewfloc 2270 a low charge anionic high
molecular weight polymer This polymer was used in jar tests 1 through 5 The best
coagulent was determined to be Charge Pack 12 (CP-12) a higher charge cationic low
molecular weight coagulent The CP-12 coagulent was used in jar tests 1 through 5
described under jar testing
12 c
InitiaUy the effects of varying the pH of the groundwater sample was investigated Tests c were conducted at pH values of 80 90 and 100 with sodium hydroxide which had the best
settling characteristics based on visual observation and turbidity measurement Each polymer
was then tested at pH = 100 to evaluate Us effectiveness under optimum pH conditions
A formula of polymer and coagulant addition was developed based on visual observations
suspended soUds and turbidity analyses performed on each sample generated during the
investigation The anionic polymer effectively flocculated the existing smaU suspended
particles and the addkion of cationic coagulant removed iron and color when the pH was
raised to 100
Jar Testing Five jar tests were performed using the polymer and coagulants determined to
be effective during preliminary testing Jar tests 1 and 4 were conducted as dupUcates at
ph 10 Jar test 2 was conducted at pH 9 jar test 3 was conducted at pH 8 and jar test 5 was
conducted at pH 10 On each occasion prior to beginning the jar test the raw groundwater
was brought tol5deg-17degCina warm water bath The temperature was held constant to c eliminate the effects of temperature on reaction rates and solubUity
The foUowing is a description of activities conducted during the jar tests fti through 4 See
Figure 1-1 for details Four samples were evaluated during each jar test For each jar test
four 15 Uter beakers were fiUed with 1 Uter of raw groundwater The beakers were placed
on the stirrer platform and the paddles were lowered into the sample The jar stirrer was
operated at 80 revolutions per minute (rpm) The pH was then adjusted to the desired value
(pH = 10 9 8 10 for Tests 1 2 3 4) with a lime slurry in two samples and with a
sodium hydroxide solution (25) in the remaining two samples Lime was added to
investigate its effects on the precipitate and to evaluate its effectiveness in pH adjustment
The cationic coagulant was then added to each sample untU the concentration in solution was
30 mgL The solution was stirred at 80 rpm for 2 minutes to ensure complete mixing The
polymer was then added to one sample pH adjusted with sodium hydroxide and one sample
pH adjusted with lime Mixing continued for two minutes Next the solution was stirred
13 c
slowly orflocculated for five minutes at 20 rpm FinaUy the solutions were aUowed to
c settle for 10 minutes Visual observations were recorded and samples were submitted for
suspended soUds turbidity and metals analyses
Jar test 5 was performed to assess the removal of manganese and aluminum by preaeration
and permanganate additions (see Figure 1-1) Because no significant benefit was observed in
the previous tests when lime was used instead of sodium hydroxide sodium hydroxide was
used to adjust the pH in aU four samples to a pH of 100 in jar test 5 Only sodium
hydroxide was added to the groundwater in the first jar to determine the removal of
manganese and aluminum attributable to the formation of an insoluble salt at high pH
Sodium hydroxide and polymer were added to the second jar to evaluate the effectiveness of
the polymer Sodium hydroxide polymer and coagulant were added to sample 4 The
supemate from sample 4 was then fUtered This was performed to determine if the required
removal efficiencies could be achieved by chemical precipitation and filtration
Permanganate was added to sample 3 in addition to sodium hydroxide coagulant and
polymer to determine if the manganese and aluminum present could be chemicaUy oxidized c to a less soluble state which would enhance the efficiency of fUtration The supemate was
then siphoned off using clean tygon tubing and a syringe into the sample containers
Samples were submitted for metals suspended soUds and turbidity as illustrated on
Figure 1-1
1223 Filtration Testing A bench-scale filtration study was perfonned to determine the
optimum pore size of filter media that could effectively remove the suspended soUds in the
precipitated groundwater The determination of the removal efficiency for each filter was
based on the concentration of suspended soUds and turbidity of the filtered water The time
required to filter the groundwater was also evaluated
Prior to filtration the metals in the groundwater were precipitated and coagulent and polymer
were added using the optimum conditions developed during the precipitation study The
optimum conditions consisted of pH adjustment to 10 with sodium hydroxide addition of
14 c
coagulent CP-12 to a concentration of one percent and addition of Drewfloc 2270 polymer to
c a concentration of 10 mgl Three grades (10 xm 5 xm and 1 xm pore sizes) of filter
paper were used with a Buchner ftmnel to filter aUquots of the precipitated groundwater
Samples of the filtered water were submitted to ENSECO for suspended soUds and turbidity
analysis
A sample of the metal hydroxide sludge was coUected during the treatability study The
sludge sample was submitted to the CLP system for PCB and metals analysis so that a
characterization of the sludge could be made and disposal options could be evaluated
1224 Air Stripping Testing Precipitated fUtered groundwater was aerated at three
different air to water ratios to determine the most effective stripping ratio To ensure that
worst case volatUe organic compound concentrations were present in the samples for this
study some modifications were made in how the sample was coUected and treated First
the groundwater was coUected with a baUer to prevent the loss of volatUes AdditionaUy the
water was fUtered under positive pressure foUowing the precipitation step to minimize the c loss of volatUes that would result if the water was filtered using a vacuum pump
An aquarium pump tygon tubing and aeration stone with a glass-fiber fUter cartridge was
used to aerate 1-Uter aUquots of precipitated and filtered groundwater The aeration flow
rate was caUbrated by filling a graduated cylinder with air that had been filled with tap water
and inverted in a water bath The air was diffused at 375 missec into 1-Uter aUquots of
groundwater and the time measured as iUustrated in Table 1-6 The aerated groundwater was
submitted to ENSECO for volatUe organics analysis
1225 Carbon Adsorption Testing The effectiveness of activated carbon for the removal
of organic compounds in the groundwater at the site was evaluated The carbon used was
the powdered activated 325 mesh carbon suppUed by Calgon Corporation The groundwater
samples used for this investigation were obtained and filtered as described in the air stripping
15 c
c
c
TABLE 1-6 AERATION TEST OPERATIONS
Air to Water Ratio Volume Volume of by Volume of Water Air Reqd Min of Aeration
251 1000 ml 25000 ml 111 501 1000 ml 50000 ml 222 751 1000 ml 75000 ml 333
section of this report to minimize the loss of volatUes A total of twelve samples were mn
during this investigation The necessity of air stripping was investigated by comparing the
resuUs from four samples that were air stripped to seven samples that were treated identicaUy
with the exception of air stripping AU samples for the air stripping comparison went
through the precipitation filtration and carbon adsorption processes AdditionaUy one
sample was prepared with no carbon added to serve as an untreated sample The samples are
summarized in Table 1-7 Each groundwater sample was prepared and mixed with a
predetermined dose of Calgon powdered 325 mesh activated carbon and placed m an open
Erlenmyer flask on a shaker table for a two-hour time period at 180 rpm A rotary shaker
table capable of accommodating twelve (12)-1000 ml Erlenmyer flasks was used Effluent
was fUtered with a barrel filter using a glass-fiber pre-fUter and a Whatman 45 micron
membrane The effluent clear and odorless in aU cases was added to sample containers
preserved and packed for shipment to CLP laboratories Since the shaker table could
accommodate 12 flasks a total of approximately 4 gaUons of effluent was generated during
each mn Several mns were performed to generate adequate quantities of sample for
analysis accordmg to Table 1-7 Groundwater was simUarly prepared for submittal to
Aquatec Lab in Burlington Vermont for chronic toxicity testing Three (3) shipments of
approximately 2 gaUons each were made
r 16
C) o o TABLE 1-7 CLP TREATABILITY STUDY SAMPLING SUMMARY
Dose g of Carbon Required of mis in gs Carbon
Sample ID 1000 ml of GW Analysis Volume mis Flasks Flasks in each
Precipitation Filtration Aeration amp Carbon
AC-1 05 V SV MET 3400 3 1067 054 AC-2 20 V SV PCB 4400 4 1100 22 AC-3 50 V SV MET 3400 3 1133 57 AC-4 100 V SV PCB 4400 4 1100 110 AC-5 Trip Blank 0 V
Precipitation Filtration amp Carbon
C-0 0 V 500 1 500 0
C-1 05 V SV MET 3200 3 1067 053
c-2 10 V PCB 2200 2 1100 11
C-3 20 V SV CT 29000 24 1250 25
C-4 50 V SV PCB 4400 4 1100 55
C-17 70 V MET 1200 1 1200 70
C-18 100 V SV 2200 2 1100 110
C-13 Treatability Blank 0 V PCB 2200 0 0 0
C-20 Trip Blank 0 V 0
C-10 Duplicate of C-1 05 SV 2000 2 1000 05
C-1 05 (MSMSD) 500 1 500 025
C-11 Duplicate of C-1 05 MET 1000 1 1000 05
C-20 Duplicate of C-2 10 V PCB (MSMSD)
4400 4 1100 11
C-16 Duplicate of C-4 50 PCB 2000 2 1000 50
C-6 0 PCB 2000 2 1000 0
17
o o n TABLE 1-7 (Continued) CLP TREATABILITY STUDY SAMPLING SUMMARY
Dose g of Carbon Required of mis in gs Carbon
Sample ID 1000 ml of GW Analysis Volume mis Flasks Flasks in each
Precipitation amp Filtration
PPF-1 V SV MET PCB 2000 2 1000 0
Sludge
Sludge-1 0 MET PCB 0
V = VolatUe organics SV = Semivolatile organics MET = Metals PCB = Polychlorinated biphenyls CT = Chronic toxicity MSMSD = Matrix spikematrix spike dup D = DupUcate TB = Trip blank PPF = Precipitated and pressure filtered
(to minimize volatUes loss as opposed to vacuum filtration)
18
c
c
123 Results
1231 Precipitation Testing
Polymer Testing Preliminary polymer and coagulant testing was conducted to determine
the type of polymer and coagulant that could be employed to treat groundwater from the site
The Drewfloc polymer and the Drew CP-12 cationic coagulant were chosen as the most
effective types InitiaUy the effect of varying the pH of the groundwater sample was
investigated The resuUs of tests conducted at pH values of 80 90 and 100 are presented
on Table 1-8 As the pH value was raised the quaUty of the floe improved The sample
raised to a pH level of 100 with sodium hydroxide exhibited the best settling characteristics
based on the color turbidity soUds and the quaUty of the floe
The effects of varying the polymer dose was then investigated at pH=100 The cationic
coagulant added to a concentration of 30 ppm after pH adjustment and prior to polymer
addition produced the clearest supemate based on color turbidity and suspended soUds
results Table 1-8 also summarizes the results from this investigation
Jar Testing Four jar tests were performed to evaluate the effectiveness of chemical
precipitation for the removal of metals in groundwater from weU MW-IA The analytical
results from the jar test are presented in Table 1-9 The greatest metal reductions occurred
when the pH was 100 Samples for which the pH was adjusted with lime showed better
removal of barium manganese and sodium concentrations than those samples for which the
pH was adjusted with sodium hydroxide Samples for which the pH was adjusted with
sodium hydroxide showed greater declines in the concentrations of calcium and magnesium
No significant effect was observed on the removal of cobalt iron lead aluminum potassium
and zinc when lime or sodium hydroxide was used to raise the pH The observation that
samples for which the pH was adjusted with sodium hydroxide had elevated concentrations of
19 c
c TABLE 1-8 PRELIMINARY POLYMER TESTING RESULTS
Description of Supemate
Procedure pH ColorSoUds
mgl Turbidity
NTU Floe SettleabUity
Varymg pH
Raw Groundwater pH adjustedNaOH pH adjustedNaOH pH adjustedNaOH
62 80 90 100
YeUowbrownYeUowbrownYeUowbrownYeUowbrown
450 gt50 gt gt 5 0 gt gt50
58 SUght mst pin floe medium
gt medium
None Slow Faster Fastest
Varying polymer dose pH adjustment wNaOH
pH adjustedno polymer
100 YeUowbrown gt gt50 gt medium Fast
Above wpolymerat 1 ppm
100 Light yeUow lt 10 35 large 18 Fast
c Polymer at 5 ppm 100
Polymer at 1 ppm 100 wcoag 30 ppm
Light yeUow
Very Ught
lt 10
lt 10 yeUow
32
30
Large 18
Targe 18
Fast
Fast
n 20
o o n TABLE 1-9 F U L L - S C A L E TREATABILITY STUDY JAR T E S T R E S U L T S
Results in mgL
SAMPLE ID iiiiiiiiiiiiiiiiiiiiMW JAiSiiii iiiJTililiiiiiiiiiiii iiiJTil^iiiiiii iiiiiiiiiiTIi3iiiiiiiii iiiii^ii^li^iiiiiiiiiiiiii^iiri^iiiiisiiiiiiiiiiiiimii iiiiiJT4^iiiiiiiiiiiiiinP4i4iiiiiiiiiii iiiiiJT2iiliiiiiiiiiiiiT2^iiiiiii |i|S^ iiiiiiiiiiiiiiiiiiiiiiiiiiiiilM ii iiiiiiiiiiiiiiiiiiiiJlt iiiiiiiiii iiiiiiiiii-iiiiiiii iiiiiiiii=iiiiiiiiiiiiiliiiiii iiiiiiiiiiiiiiiiiiiiiiliiiiiiiiiiiiiiiiiiiiiiiiiiliiiiiiiiiiiiiM ii^iiiiiiiiiiiii6iiiiiiiiiiiiiiiiiiijqiiiiii mmsectlsectMimamp0^
Zinc 0488 002 U 002 U 002 U 002 U 002 U 002 U 002 U 002 U 002 U 002 U
E S A M P L E ID iiiiiiiiiiiiiiiiiiiiJT2i3iiiiiiiiiiiiiiiii ^T2-4iiiiiiiii iiiiiiiiJ^alliiiiiiiiiiiii iii^Ta^iiiiiiiiiiii iiiiiiiiit3|3iiiiiiiiiiiii iiilT3Tr4iiiiiiiiiiiiiii rrs-i iiiiiiiiiiiiiiJTSl iiiiiiiiiiiiiii iiiiiitJiJiiiiiiiiiii iiiiiiWs-4iiiiiiiiiiiii iiiiiiiJT5r-5ii|iiiiiiii
iiiiiiiiliiiiiiiiiiiiiiiiiBSsiii iiiiiiiiiiiiiiiiiiiiiilgtHiiiiiiiiiiii iiiiiiNaOHiiiiiiii iiiiiiiiiiii)iliimiiiiiiiii iiiiiiiiSiiriiiisiiiiiiiiii iiiiiiiiNiliiiiiiiiii iiiii iNapHiiiiiiiiiiiii iiiiiiiiiiiiiiiifloiiiiiiiii iiii^iiiiiiiiiii iiiiiiii NiitQHiiiiiiiii iiiiiiiiiWftOHiiiiiiii wmm iii^iiiiiiiisiiiiiiiAli|ilii iiiiiiiiiiixiiiiiEal3i iltgtoi PolyCoag C o a g u l a n t PolyCoag Coagulant iiiiiiii iiiiiii iiiiiii)|sihyii^iiiiiiii PolyCoag PolyCoag iiiPoij^iii^il ANALYTES Aerated KMn04
Barium 0073 0072 010 010 010 010 NA NA NA NA NA Calcium 247 247 571 574 273 277 NA NA NA NA NA Cobalt 001 U 001 U 0017 0018 0017 0019 NA NA NA NA NA Iron 01 U Ol U 016 023 016 043 NA NA NA NA NA Lead 0005 U 0005 U 0005 U 0005 U 0005 U 0005 U NA NA NA NA NA Magnesium 44 44 50 51 50 50 NA NA NA NA NA Manganese 35 33 43 43 44 44 063 086 099 094 14 Potassium 5 U 5 U 5 U 5 U 5 U 5 U NA NA NA NA NA Sodium 423 477 170 169 502 508 NA NA NA NA NA Zinc 002 U 002 U 0082 011 015 016 NA NA NA NA NA
Notes Only metals detected in untreated groundwater from MWIA are presented NA = Not Analyzed
U = undetected at specified detection limit JTI = Jar Test 1
c
c
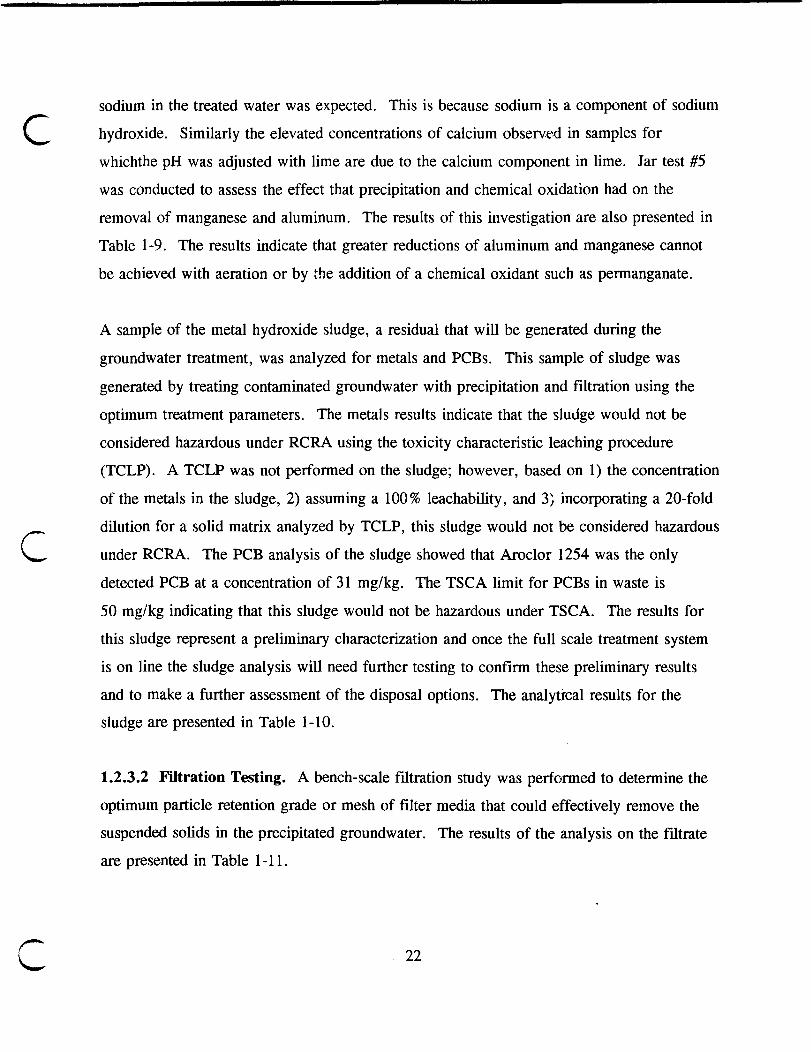
sodium in the treated water was expected This is because sodium is a component of sodium
hydroxide Similarly the elevated concentrations of calcium observed in samples for
whichthe pH was adjusted wUh lime are due to the calcium component in lime Jar test 5
was conducted to assess the effect that precipitation and chemical oxidation had on the
removal of manganese and aluminum The results of this investigation are also presented in
Table 1-9 The results indicate that greater reductions of aluminum and manganese cannot
be achieved with aeration or by the addition of a chemical oxidant such as permanganate
A sample of the metal hydroxide sludge a residual that wiU be generated during the
groundwater treatment was analyzed for metals and PCBs This sample of sludge was
generated by treating contaminated groundwater with precipitation and filtration using the
optimum treatment parameters The metals results indicate that the sludge would not be
considered hazardous under RCRA using the toxicity characteristic leaching procedure
(TCLP) A TCLP was not performed on the sludge however based on 1) the concentration
of the metals in the sludge 2) assuming a 100 leachability and 3) incoiporating a 20-fold
dUution for a soUd matrix analyzed by TCLP this sludge would not be considered hazardous
under RCRA The PCB analysis of the sludge showed that Aroclor 1254 was the only
detected PCB at a concentration of 31 mgkg The TSCA limit for PCBs in waste is
50 mgkg indicating that this sludge would not be hazardous under TSCA The results for
this sludge represent a preliminary characterization and once the fuU scale treatment system
is on line the sludge analysis wiU need further testing to confirm these preliminary results
and to make a further assessment of the disposal options The analytical resuUs for the
sludge are presented in Table 1-10
1232 FUtration Testing A bench-scale filtration study was performed to determine the
optimum particle retention grade or mesh of filter media that could effectively remove the
suspended soUds in the precipitated groundwater The results of the analysis on the fUtrate
are presented in Table 1-11
n 22
c
c
TABLE 1-10 PRECIPITATED METAL HYDROXIDE SLUDGE RESULTS Results in mgkg
i||ipiiiii|iiiiiiiiiiiiiiiii^^iiiili|ii^^^ TCLP or TSCA L i n i l t s i Tfesi-iiiiiiiiiiiiiiisiiiiii^iiiiiiSvHiij^ in Solid Matrices ii iiiiS WM3KT2S
METALS
Aluminum Antimony Arsemc Barium Beryllium
Cadmium Calcium Chromium Cobalt Copper Iron Lead Magnesium Manganese Mercury Nickel Selenium Silver Sodium Thallium Vanadium Zinc
PCBs
Aroclor 1254
41100 231 195 346 5767
9120 338
25 114
39000 694 5260 2730
03313
04
8960 08
561446
31
U U
U
J
U U U R
U U J
J
NC NC 100
2000 NC 20
NC 100 NC NC NC 100 NC NC
4 NC 20
100 NC NC NC NC
50
Notes = TCLP Limits incorporated a 1 to 20 dilution factor for solid matrices Aroclor 1254 was the only PCB detected The remaining six Aroclors
were nondetect at a quantitation limit of 36 mgkg NC = No criteria exists for this compound U = Undetected at speciiied detection limit
L J = Estimated value due to validation criteria R = The result is rejected
23
c
c
TABLE 1-11 FILTRATION STUDY RESULTS
Media Rating Speed Suspended SoUds Turbidity
Raw 45 mgl 578 Course 10 um 200 mls5 sec lt5 mgl 16 NTU Medium 5 um 200 mls7 sec lt5 mgl 19 NTU Fine 1 um 200 mls23 sec lt5 mgl 18 NTU
Since there was virtuaUy no difference in the quaUty of effluents but substantial increase in
time to filter with the fine filter paper the medium 5 micron paper was chosen to prepare
sample for ftirther study
1233 Air Stripping Precipitated fUtered groundwater was aerated at 3 different air to
water ratios to evaluate the effectiveness of air stripping for the removal of volatUe organic
compounds in the groundwater Tables 1-12 and 1-13 shows the analytical results for
groundwater samples obtained from weUs MW-IA and ME-8 respectively No volatUe
organic compounds were detected in samples that were aerated at a 501 air to water ratio
Aeration of precipitated filtered groundwater obtained from weU ME-8 removed aU of the
vinyl chloride at an air to water ratio of 251
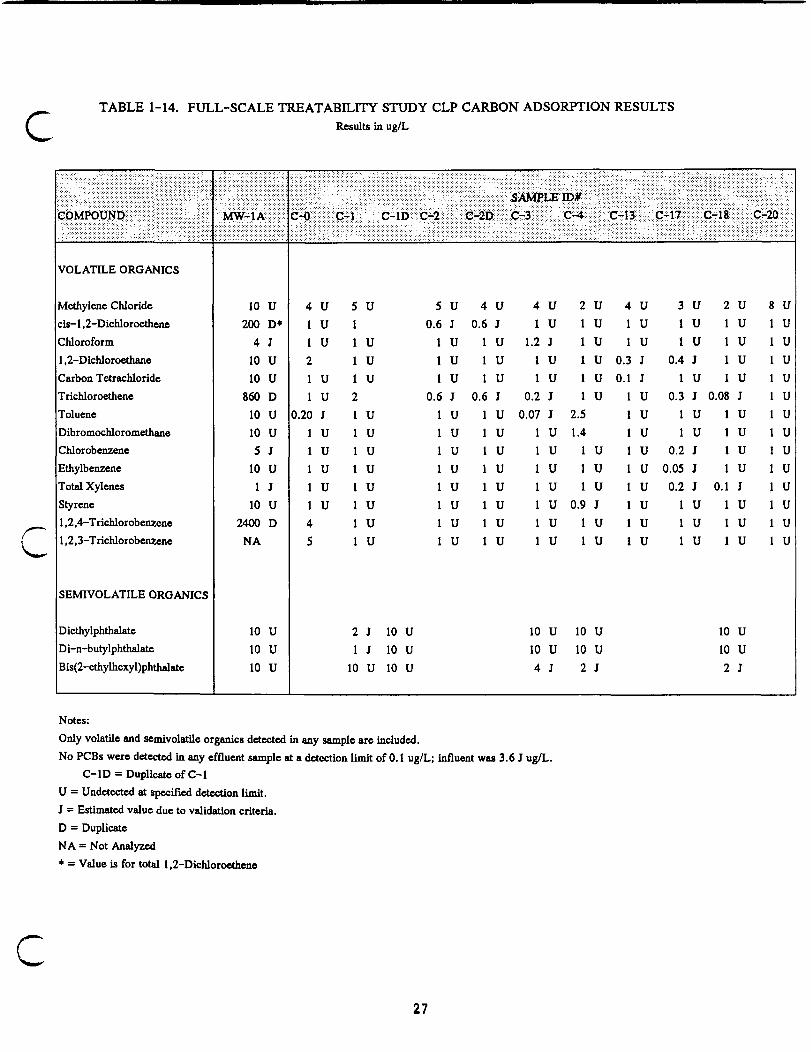
1234 Carbon Adsorption The effectiveness of carbon adsorption for the removal of
organic compounds in the groundwater was evaluated The analytical results are presented in
Table 1-14 At the lowest carbon dosage only 1 xg1 of cis-12-dichloroethene and
2 xg1 of trichloroethene remained No site-related volatUe organic compounds were detected
in samples which were treated with higher doses of carbon Toluene and
dibromochloromethane were detected in sample C-4 however these two compounds were
not detected in the raw groundwater and must therefore be a result of lab contamination
24 c
c TABLE 1-12 FULL SCALE TREATABILITY STUDY AIR STRIPPING RESULTS IN ugL FOR WELL MWIA
Methylene Chloride 10 u 4 U 5 U 5 U 4 U 4 U 2 U 4 U
cis-12-Dichloroethene 200 D 1 U 1 06 J 06 J 1 U 1 U 1 U
Chloroform 4 J 1 U 1 U 1 U 1 U 12 J 1 U 1 U
12-Dichloroethane 10 U 2 1 u 1 U 1 U 1 U 1 U 03 J
Carbon Tetrachloride 10 u 1 U 1 u 1 U 1 U 1 U 1 U 01 J
Trichloroethene 860 D 1 U 2 06 J 06 J 02 J 1 U 1 U
Toluene 10 U 020 J 1 U 1 U 1 U 007 J 25 1 U
Dibromochloromethane 10 U 1 U 1 U 1 U 1 U 1 U 14 1 U
Chlorobenzene 5 J 1 U 1 U 1 U 1 U 1 U 1 U 1 U
Ethylbenzene 10 U 1 U 1 U 1 U 1 U 1 U 1 U 1 U
Total Xylenes 1 J 1 U 1 U 1 U I U 1 U 1 U 1 U
Styrene 10 U 1 U 1 u 1 U 1 U 1 U 09 J 1 U
124-Trichloroben2ene 2400 D 4 1 u 1 U 1 U 1 U 1 U 1 U
123-Trichloroben2ene NA 5 1 u 1 U 1 U 1 U 1 U 1 U ^
SEMIVOLATILE ORG ANICS
Diethylphthalate 10 U 2 J 10 u 10 U 10 u Di-n-butylphthalate 10 U 1 J 10 u 10 U 10 u
Bis(2-ethylhexyl)phthal ate 10 U 10 U 10 u 4 J 2 J
Notes
Only volatile and semivolatile organics detected in any sample are included
No PCBs were detected in any effluent sample at a detection limit of 01 ugL influent was 36 J ugL
C-ID = Duplicate of C-1
U = Undetected at specified detection limit
J = Estimated value due to validation criteria
D = Duplicate
NA = Not Analyzed
= Value is for total 12-Dichlorocthene
i| f|iiiiiiiiiiiiiii^ti8ili| WSk
3 U 2 u 8 U
1 U 1 u 1 U
1 U 1 u 1 U
04 J 1 U 1 U
1 U 1 u 1 U
03 J 008 J 1 U
1 U 1 u 1 U
1 U 1 u 1 U
02 J 1 U 1 U
005 J 1 U 1 U
02 J OI J 1 u 1 U 1 U 1 u 1 U 1 U 1 u 1 U 1 U 1 u
10 U
10 u
2 J
27
c
The effectiveness of combining aeration and carbon adsorption to remove organic c contaminants was also investigated These results are also summarized in Table 1-15 No
organic compounds were detected m any of the samples generated during this investigation
124 Conclusions The results of the groundwater treatability study demonstrate that
treatment consisting of precipitation fUtration air stripping with vapor phase controls and
carbon adsorption appear able to meet cleanup levels estabUshed for the site Figure 1-3 is a
schematic representation of the proposed system The ROD stipulates that treated
groundwater wUl be reinjected to the aquifer onsite in this case MCLs are the cleanup
levels An altemative to be evaluated is discharging the treated groundwater to a surface
water body either Meadow Brook or the Neponset River In this case cleanup levels are
estabUshed as effluent discharge levels Effluent discharge levels are calculated by
multiplying the ambient water quaUty criteria (AWQC) values for each compound by a
dUution factor The dUution factor for the Neponset River is based on a 100-gpm treatment
discharge rate and a Neponset River 7010 of 2020 gpm The dUution factor for Meadow
Brook is 1 since the treatment discharge rate is greater than the flow of the brook therefore
effluent discharge levels for Meadow Brook are set at AWQC
Tables 1-16 through 1-19 compare effluent discharge levels for both the Neponset River and
Meadow Brook to carbon adsorption effluent from the groundwater treatability study
Table 1-16 summarizes the concentration of metals in untreated groundwater the metals
concentrations remaining foUowing precipitation and filtration the metals concentration
foUowing aeration and carbon adsorption the metals concentrations foUowing caition
adsorption only the MCLs and the effluent discharge levels based on discharge to the
Neponset River The only metal effluent concentration which exceeds the MCLs is
aluminum the MCL for aluminum however is a secondary MCL which is nonenforceable
No metals concentrations in the effluent exceed any of the effluent discharge levels
n 28
c TABLE 1-15 FULL-SCALE TREATABILITY STUDY AERATION AND CARBON ADSORPTION RESULTS Results in ugL
iiiiii|Mpt-HiiDiiii-iiiiii^iiiiiiiiiiii iii bullbullbull^(6-^1 iiiiii-iiiiiiiii iiiiiiiiii^g-2iiiiiiiiiii|i
l | | | ibyNigtii i i i i | i i i i i i i | ivi
VOLATILE ORGANICS
Mediylene Chloride 6 U 4 U Carbon Tetrachloride 1 U 01 J Toluene 02 J 1 u Total Xylenes 1 U 1 u Acetone 5 U 5 U 2-Butanone 5 U 5 U 2-Hexanone 5 U 5 U 4-Methy 1-2-pentanone 5 U 5 U Carbon Disulfide 1 U 1 U
c Notes Only volatile organics detected in any sample are included U = undetected at specified detection limit J = value is estimated due to validation criteria
iiiiiA61iiiiiiiiiiiii
3 U 1 U
02 J 01 J
5 U 5 J 5 U
5 U 1 U
i|AGii[ijiiifii
3 U U
01 J 1 U 5 U 5 U 5 U 5 U 1 U
i^^^iiiiiic|ii[|ili
10
1 u 1 u 1 u 5 U 5 J
5 U 5 U 1 U
29
c
o o o
o
Gas Phase GAC or Catalytic Oxidation
To ^ Ambient
Air
To Groundwater Recharge or
Raw Treated ) Neponset River Groundwater Groundwater Influent Holding Tank J
Solids for Offsite Disposal
(NOTE Air stripper not necessary if discharge to Neponset)
FIGURE 1-3 PROPOSED GROUNDWATER TREATMENT SYSTEM SCHEMATIC
2483JP
o n o TABLE 1-16 COMPARISON OF INORGANIC FULL-SCALE TREATABILITY STUDY RESULTS TO MCLS AND DISCHARGE LEVELS
[i^i^^^^ iiiiiiijiMf|iilaquo4 Precipitation Aeration and Carbon AdsorpUoi iiiiiiiiiiiiiiiiiiiiiiritliiiiin
iiiii iiSiiii|iiiiiiiiiiiiiiiii and Filtration M^ Iiiiiiiiiiiiii iiiiiiiii|iiii|i|iiiiiiiiiii liiiijlliiiii
iiiiiiiiiiiiiiiiiiiii iiiiiiiiiiiiii i i i i i i i|ii||iiiiiiiiiiiiiiiiiiiiiiiii iiiiiiiiiiiiiiiilii Giliii iiiii ii iiiii i iiiic iD|i laquoi|iiiiiiii iiiiitiiiiciiiiiiiiiiiii
Discharge levels calculated by multiplying AWQC by a dilution factor based on a 100 gpm treatment discharge rate and a Neponset River 7Q10 of 2020 gpm
U = Undetected at specified detection limit
J = Estimated value due to validation criteria
NC = No criteria exists for the compound
P = Proposed MCL
S = Secondary MCL
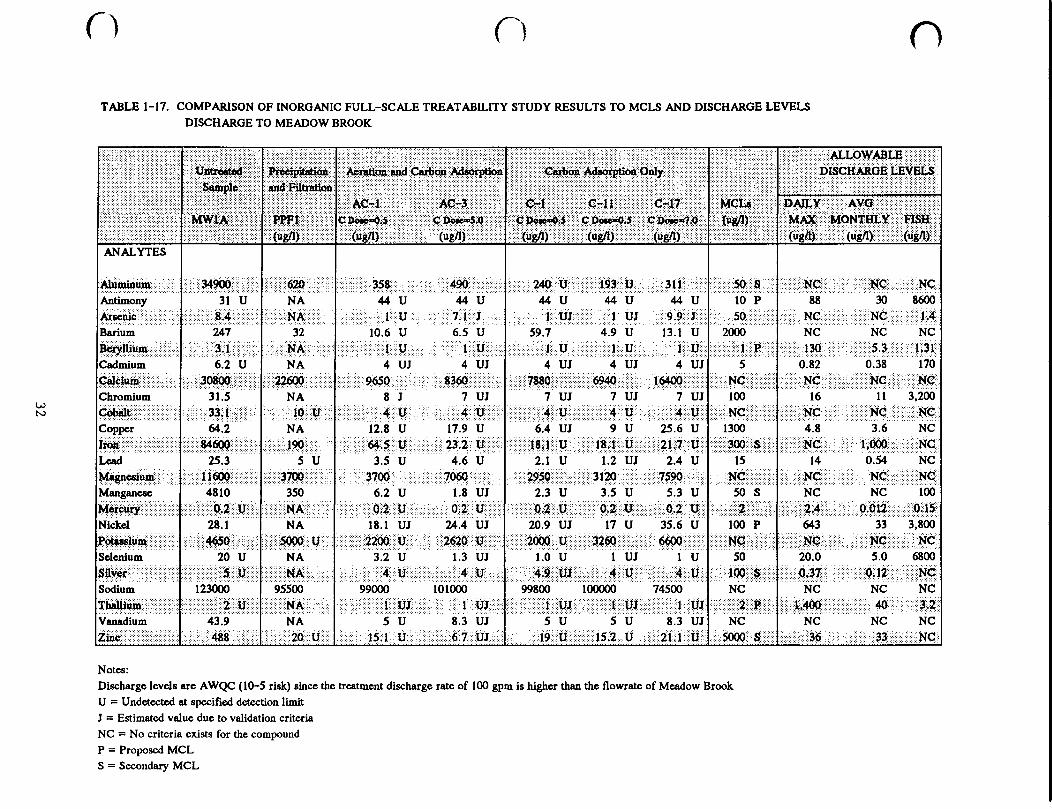
n n o TABLE 1-17 COMPARISON OF INORGANIC FULL-SCALE TREATABILITY STUDY RESULTS TO MCLS AND DISCHARGE LEVELS
DISCHARGE TO MEADOW BROOK
[isjiiiiiiiiiiiiiiii-ii |iiiiiiiiiiiiiiiiiiiiiiiiiiiiiiiiiiiiiiiiiiiiiii iiiiiiiiiiiiiiiiiiiiiiiiiiiiii iiiiiiiiiiiiiiiiiiiiiiii- iiiiiiiiiiiiiiiiiiiiiiiiiiiiiiiiii ^iiiiiiiiiiiiiiiiiiiiiiiiiiiiiiiiii bull immMmii^^ F- piiiipiiiiil i i i i i i i i i i i AcraUon and Caibon AdsorpUon iii iii iiii i i i i l l l i i i i i i ^ ^ i p t ^ sectffllM^ ^ ^
Ajumin iw u i 358 bull490 z ii 240 i--lJi iiiiiiiiiiiJ^3iiitJi i i iii i3 lliiiiiiiiii iiii|ii]^(Ciiiiiiiiiii-iii-iiiiiiii5iiiii-iiiiiiiiNC^ Antimony 2i ij NA 44 U i44 U 44 U 44 U 44 U 10 P 88 30 8600
Ariseiaic- iiiiiiiiiiiiiiiiiiiiii8iiiiiiiiiiiiiii iiiiiiiiii-iis- - iiiiiiiiii- 1 u 71 J i-iiiiiy3|ili-uj - i i i 9 l i j i iii--5Qiiiiiiiiiiiiii iiiiii NC- NC - iL | Barium 247 32 106 U 65 U 597 49 U 131 IJ 2006 NC NC NC
Blaquoay|Hiiraquosi-- bullbullbull--bull i-iiiii-iiiiii3iiiiiiliiiiiiii -iiiiiiiiiiiNAi-iiiiiii I u -- 1 U iiiiiiiiiliilliiiiii-ii|iyi- iiiii iiiiiiiiiiiiiiiiii ii|i|40 - 53-bullbull13|shyCadmium ( S i u bull bull bull bull bull bull bull bull bull N A 4 UJ 4 UJ bullr^^ 4UJ 4UJ 5 682 038 170 Cai lc turn i bull- iiiiii3PiOCfiii iiiiiiiiiiii iiiiiiiiii^iiiiiiiiiiiiii 9650 i 8360 iiii7886iiiiiiiiiiiiiiiiiiiiiiii^iiiiiiii-ii6^^ iiiiii5isNltiiiiiiiiiiiiiiiiiii iiiiiiNC NGi NC Chromium 315 NA 8 J 7 UJ 7 u j 7 uj 7 iirj 160 16 11 3206
CO i-iii-iiii 33iitiii-iiiiii ii-iiiii-i-Jfiiiiii--iiii - bull bull 4 U Z 4 U- iiiiiiiiiiiiiilii-uiiiiiiiiiiiiiiiiiiiiiii4iitjiii-iiiiiiiiiii4 iiiiii-ii Nltiiiiiiiiiiiiiiiiiiiiii i l i iNc-- -NCi^-NCi
P ^ i bull bull Copper 6 4 i NA 128 U 179 U bull64Uj 9 U --256--u-- 1300 48 36 NC
Jtaa- iiiiiiiiiiii ltJOlt iiiiiiiiiii isiiiiiiiJQiii-i - z 6AS U ii232U-^^ bulliiiiiiiiiiiiiiiiiiiiuiiiiiiiiiiiiiiiiiiiiiiiiiiiiiiiiiii2 ipit|iiiiii iiiiii3pQiiiiJiiiilii liiiNC- v 1000- bull- NCi head 253 5^U^ 35 U 46 U 21 U 12 U J 2^4 u 14 054 NCis |Magnlaquoaiuiai iiiiiiiiiiilaquo)6iiiiiiiiiiiii iiiiiiiiiiii|lS)6iiiiiiiiiiiiii 3700 7060i V^ bulliiiMiiiiiiiiiiiiiiiiiii3Jpiiiiiii7^0iiiii^^^ i iiigtKSiiiiiiiiiiiiiiii bulliii I N C bull N C Ncjii Manganese 4810 bull356 62 U 18 UJ 23 U 35 U 53 U 56 S NC NC 106
Wtercuryi iiiiiiiiiiiiiiiiiiiiiiiiyiiiMiiiiiii iiiiiiiiiiiiiiiiiNAiiiiiii i P-2 U bullbull 0 2 U-- iiiiiiiiiiiiiiiiOi|iiittiiiiiii|iiiii 6iiiiit|iiiiiiiiiiiiiQ|iit|iiiiii iiiii|i|iiiiiiiiiii iiii|iii24- -- oon --0i|i Nickel 281 isrA 181 UJ 244 UJ 269 uil 17 U 356 il 166 P 643 33 3800
Potraquoslaquolum -iiiiiiiiiii4liS0iiiiiiiiii iiiiiiiiiiiii PPQiiiiU i 2200 U i ii 2620 XT | |i |owiiyiiiiii | |(^iiiiiiiiiii^ iiiiiiiiiiiiiiiW|iiiiiiiiiiiiii iii iii|ip--i NC- bullbullbull-KCii Selenium 20 U NA 32 U 13 UJ 1 6 u 1 UJ i u 5 6 266 50 6800 Sflycri i-i- iiiiiiiiiiiiiiiiiiiiiiiiiiiiiiiiiiiiiii iiiiiiiiiiiiiiiiiii iiii- i-4U bull -^M- U iii bull i i i i | | i | | i i i i |-i i | i | l | i i i i | i i i i iiiii-i ^66iiiiiiiiiiiiiii i|iP37 -0i2iNi Sodium 1 2 3 6 6 6 9 5 5 6 6 99000 lOlOOO 99866 106066 74566 NC NC NC NC
I m iiiiiiiiiiiiiiiiiiiiii||jriiiiii||iii|i|iii|| | ii46Q ^40- -bull-3iThaUJiiiitt - iiiiiiiiiiiiiiiiiiiiiiiiiiliiiiiiiiii iiiiiiiiiiiiiiNAii- I UJ ^ iiiiiiiiiiiiiiiiii Vanadium 439 NA 5 U 83 UJ 5 U 5 IJ 0 IJJ NC NC NC NC
Ziiicii^ iiiiiiii-iiiii- 488iiiiiiiiiiiiii iiiiiiiiiiii6iiu 151 U 67 UJ iiiii iiiiiiiiiiiiiiiil52iU- iiiiiiiii2 liiiiiiiiiii iiJiOQ()ii- Siiiiiiii iiiiiiiiii|6 bull bull33 - N C i
Notes
Discharge levels are AWQC (10-5 risk) since the treatment discharge rate of 100 gpm is higher than the flowrate of Meadow Brook
U = Undetected at specified detection limit
J = Estimated value due to validation criteria
NC = No criteria eus ts for the compound
P = Proposed MCL
S = Secondary MCL
o n o TABLE 1-18 COMPARISON OF ORGANIC FULL-SCALE TREATABILITY STUDY RESULTS TO MCLS AND DISCHARGE LEVELS - DISCHARGE TO THE NEPONSET RIVER
||x|o | bull iiii||i||il|A iiiiii iiiiiiiiliiiiiiiiiiili ii5iiPo|laquo|o|i iii||l|i|i||ii||y E^ly1 C DoteslOO ii i^i|raquoiiipltii=(iiiii|iii iiii i i w i M w iiiiiiilliHiJLYiiii iiiiWiiiiii iiiiiiiiiiiiii ii iiiiiiiiiiiiiiiiiiii iiiiii iiii iiiiiiiiiii iiiiiiiiiiiiiiiiii iiiiiiiiiililiiiiiiiiiliiiiii bulliiiiii lagaiiiiiiiii iiiiiiiiiiiiiiiiiiiiiiiiiiiiiiiii (ugL) iiiiiiii^iiiiiiiiii iiiiiiiiiiiiipiiiii iiUiiiiiii^ WmnKiiiiiii i(iiiiiiii i iii iiiiiiiiiiMiiiiii VOLATILE ORGANICS
112-Trichlorocthane 5 J 25 U 1 u 1 u 1 U 1 u 1 u 5 NC NC 8904
1122-TetrachIororthane 16 J 25 U 1 u I u I U 1 u 1 u NC NC 50880 2332
Chloroform 4 J 25 U 1 u 1 u 1 U I u 1 u NC 612680 26288 3328
Vinyl Chloride 10 U 50 U I u 1 u 1 u 1 u 1 u 2 NC NC 111300
11-DichIoroethene 10 U 25 U 1 u 1 u 1 u I u 1 u 7 245920 0 403
12-Dichloroethene (total) 200 D 97 1 u 1 u 1 u 1 u 1 70 245920 NC 29680000
Trichloroethene 860 D 430 1 u I u 1 u 1 u 2 5 954000 464280 19504
Tetrachloroethene 5 J 25 U 1 u I u 1 u 1 u 1 u 5 111936 17808 1876
Xylenes (total) 1 J 25 U 1 u 1 u 01 J 1 u I u lOOOO NC NC NC
Chlorobenzene 5 J 25 U 1 u 1 u 1 u 1 u I U NC NC NC NC
SEMIVOLATILE ORGANICS
Pentachlorophenol 25 U ND 25 U 25 U 25 U 25 U 25 U I 424 276 NC
Chlorobenzenes(total) 5300 1060 NC
13-Dichlorobenzene 3 J 2 10 U 10 U 10 U 10 U 10 U 600 NC NC 55120
14-Dichlorobenzene 17 9 10 U 10 U 10 U 10 U 10 U 75 NC NC 55120
12-Dichlorobciizcne 7 J 5 10 U 10 U 10 U 10 U 10 U 600 NC NC 360400
124-Trichlorobenzene 2400 D 50 10 u 10 u 10 U 10 u 10 U 9 5300 1060 NC
PESTICIDESPCBS
Arocloi-1254 36 J 32 NA 01 u NA OI u NA 05 42 03 01
Heptachlor 0074 J NA NA NA NA NA NA 04 11 01 01
Aldrin 017 J NA NA NA NA NA NA NC 64 NC 002
Heptachlor Epoxide 0045 J NA NA NA NA NA NA 02 NC NC NC
gamma-Chlordane 0056 J NA NA NA NA NA NA 2 51 OI 01
Notes
Discharge levels calculated by multiplying AWQC (10-S risk) by a dilution factor based on a 100 gpm treatment discharge rate and a Neponset River 7Q10 of 2020 gpm
Compounds presented are only those detected in the untreated groundwater sample
NA = Not analyzed J = Estimated value due to validation criteria
NC = No criteria exists for the compound D = The reported value is from the diluted analysis
U = Undetected at specified detection limit P = Proposed MCL
o n o TABLE 1-19 COMPARISON OF ORGANIC FULL-SCALE TREATABILITY STUDY RESULTS TO MCLS AND DISCHARGE LEVELS - DISCHARGE TO MEADOW BROOK
i 1 liiiisisi i ii iii iii|i|i i l i 11 i |ii^^ i i i i i i i i iiiiiiiiiiiiiiiiii iiiiiiiiiiiiieiciidiiiiii iiiiiiiiiiiiii iiiiiliiiiiii^^iiiiii iiiiiiiiiiiiiiiiiiii iiliiiii i iiiiipiiiliiiiiiiliiii iiiiiiiiiiiiiiiiii iiiii|iii|i|i-iiiiii iiAVQiii|iiiii i ii-iiiiiiigt-iiii ^^
iiiiiiiiiiiiiiii iiiiiiiiiiiiiiiiiiiiiiiiiiiiii iiiiiiiiiiiiiiiiiiiiii I i i i i i i i i||i|i|||iiiiiiiiiiiiiiii|iiii iii-|iiilaquo|i3[i|ii |||^|ii^|i|^|iii i (3 i i ^ ^ l i i illjliii^jiii^ iieip|i(iii|i iiiiiiiiiiiiiiiiiiii i^|iii|(iiiijiii|)|r^ iiii-iiliiiiiiiiiiiii ||i |illlli|i i|li|i|ii iiiiiiiiiiiiiiiiii iiiiiiiiiii|tiiiiiiiiiiiiiiiiiii iiiiiiiiiiiifiiiiiiiiii iiiiiiiiiiiiiiiiilaquoiiiiiii iiiiiiiiiiilliiiiiiiiiiiiiiii i (laquoy^ iiiiiiiiiiiii(Wiiiiiiiii iiiiiiiii i lK^ iiiiiiiiliiiiiiiiiiiiiiiii (ugl)iii iiMiiiiiii VOLATILE ORGANICS
112-Trichloroethane 5 J 25 U 1 u 1 u 1 u 1 u 1 u 5 NC NC 420
1122-Tetrachloroethane 16 J 25 U 1 u 1 u 1 u 1 u 1 u NC NC 2400 110
Chloroform 4 J 25 U 1 u 1 u 1 u I u 1 u NC 28900 1240 157
Vinyl Chloride 10 u 50 U 1 u 1 u 1 u 1 u I u 2 NC NC 5250
11-Dichloroethene 10 u 25 U 1 u 1 u 1 u I u 1 u 7 11600 NC 19
12-Dichlorocthene (total) 200 D 97 1 u I u 1 u 1 u 1 70 11600 NC 1400000
Trichloroethene 860 D 430 1 u 1 u 1 u I u 2 5 45000 21900 920
Tetrachloroethene 5 J 25 U 1 u 1 u 1 u 1 u 1 U 5 5280 840 89
Xylenes (total) 1 J 25 U 1 u 1 u 01 J I u I U 10000 NC NC NC
Chlorobenzene 5 J 25 U 1 u 1 u 1 u 1 u I u NC NC NC NC
SEMIVOLATILE ORGANICS
Pentachlorophenol 25 U ND 25 U 25 U 25 U 25 U 25 U 1 20 13 NC
Chlorobenzenes(total) 250 50 NC
13-Dichlorobcnzene 3 J 2 10 U 10 U 10 u 10 U 10 U 600 NC NC 2600
14-Dichlorobenzene 17 9 10 U 10 U 10 u 10 U 10 U 75 NC NC 2600
12-Dichlorobenzene 7 J 5 10 U 10 U 10 u 10 U 10 U 600 NC NC 17000
124-Trichlorobenzene 2400 D 50 10 u 10 u 10 u 10 u 10 U 9 250 50 NC
PESTICIDESPCBS
Aroclor-1254 36 J 32 01 u 01 u OI u OI u NA 05 20 0014 00045
Heptachlor 0074 J NA NA NA NA NA NA 04 052 00038 00029
Aldrin 017 J NA NA NA NA NA NA NC 3 NC 000079
Heptachlor Epoxide 0045 J NA NA NA NA NA NA 02 NC NC NC
gamma-Chlordane | 0056 J NA NA NA NA NA NA 2 24 00043 00048
Notes
Discharge levels are AWQC (10-5 risk) since the treatment discharge rate of 100 gpm is higher than the flowrate of Meadow Brook
Compounds presented are only those detected in the untreated groundwater sample
NA = Not analyzed J = Estimated value due to validation criteria
NC = No criteria exists for the compound D = The reported value is from the diluted analysis
U = Undetected at specified detection limit P = Proposed MCL
Table 1-17 shows a comparison of effluent to effluent discharge levels based on discharge to c Meadow Brook assuming a dilution factor on one If the treated groundwater was discharged
to Meadow Brook effluent discharge levels for arsenic would be exceeded Since arsenic is
a difficult compound to remove in a groundwater treatment plant it is concluded that
Meadow Brook may not be usable as a discharge point
Table 1-18 presents concentrations of organic contaminants in untreated groundwater from
MW-IA the precipitated and filtered effluent the effluent following both aeration and
carbon and the effluent from carbon adsorption only These values are compared to MCLs
and effluent discharge levels Only one carbon dose for the carbon only study the lowest
dose of 05 g carbon1000 ml groundwater is shown as a conservative example In both
cases using aeration and carbon and carbon alone organic contaminants were removed to
below MCLs and to below discharge levels Therefore aeration at an air-to-water ratio of
251 and a carbon dose of 05 g carbon1000 ml groundwater effectively removed volatile
organics semivolatile organics and PCBs from the groundwater
c It is expected that a maximum air-to-water ratio at 251 will be effective for an air stripper
onsite because full-scale air strippers are many times more efficient than the bench scale
models This is due to the greater surface area and turbulence found in the stripper The
off-gas from the air stripper will have to be treated to meet applicable standards either by a
catalytic oxidation unit or a vapor phase carbon adsorption system
Since no vinyl chloride was present in MW-IA and vinyl chloride is a difficult compound to
remove with carbon adsorption tests were performed with groundwater from ME-8 which
contained 210 xg1 vinyl chloride These results were presented in Table 1-13 which shows
that air stripping at an air-to-water ratio of 251 is effective in removing vinyl chloride In
order to reach the MCL of 2 figl for vinyl chloride an air stripper is required Carbon
adsorption alone would not remove vinyl chloride down to the MCL If the treated
groundwater is discharged to the Neponset River instead of being reinjected an air stripper
to remove vinyl chloride is not necessary since the discharge level is 111300 xg1
35 c
Table 1-19 shows a comparison between the organic concentrations in treatability study c effluents and effluent discharge levels based on discharge to Meadow Brook All volatile and
semivolatile organic compounds are removed to the effluent discharge levels It is
impossible to determine if PCBs were effectively removed since the most stringent discharge
level is 0014 xgL and the detection limit in the study is 01 xgL Discharge to Meadow
Brook may not be feasible due to 1) the treatability study cannot prove that PCBs are
removed to effluent discharge levels and 2) arsenic concentrations in the treated effluent
were higher than effluent discharge levels (based on a dilution factor of one)
The preliminary results of the sludge analysis indicate that the sludge is nonhazardous under
RCRA and TSCA Once the fiill scale groundwater treatment system is on line samples of
the sludge should be reanalyzed to confirm the preliminary results and to further assess the
disposal options
In summary the results of the treatability study indicate that groimdwater from the Norwood
PCB site can be treated effectively to allow discharge to either the Neponset River or r gtlaquo^ reinjection back into the aquifer If treated groundwater is reinjected the treatment plant
must include an air stripper to remove vinyl chloride If treated groundwater is discharged
to the Neponset River an air stripper is not necessary to meet discharge levels however the
use of Best Available Technology (BAT) may be required which would necessitate the
inclusion of an air stripper A cost comparison between an air stripper combined with
liquid-phase carbon versus liquid-phase carbon alone was performed and reported in the
Modeling Report The conclusion was there is not a significant difference in cost the
present worth assuming a discount factor of 8 and a 16-year period of perfonnance was
135 vs 102 million dollars (see Volume 2 Section 3) These costs will be evaluated
further during the design phase of the project The efficiracy at the full scale plant can be
optimized to ensure that at no time will the effluent from the plant exceed any applicable
groundwater or surface water standard
36 C
Section Two
c
c
20 ROCKS
21 Introduction and Objectives
There are several sources of rocks potentially contaminated with PCBs present on the Grant
Gear property portion of the Norwood PCB site Three different sources of rocks were
collected for analysis from the Grant Gear property The three rock sources included
overburden rocks from a trench west of the Grant Gear facility and below the interim
remedial cap crushed stone from the interim remedial cap west of the Grant Gear facility
and pea stone from the upper and lower roofs of the Grant Gear facility Throughout this
section rocks collected from on top of the interim remedial cap will be referred to as cap
rocks and overburden rocks wUl be referred to as trench rocks The rock collected from the
roof were analyzed under Work Plan 1 and are discussed in the Building Investigation
Report
The objective of this portion of the predesign work was threefold
bull To determine the PCB contamination if any on the different sources of rocks
bull To assess the feasibility of dry tumbling as a remedial altemative for the rocks
bull To assess the feasibility of water washing as a remedial altemative for the rocks
The dry tumblingwater washing was conducted on rocks that were reported to be too large
to be remediated with overburden soils by the solvent extraction technique
22 Description of Work
Samples of the three sources of rocks were collected by Metcalf amp Eddy personnel on
January 8-10 1992 Refer to Figure 1-1 for the locations of the trench and the cap rock
37 c
sampling points The samples were delivered to ENSECO laboratory in Cambridge
c Massachusetts and stored in a refrigerator at 4degC prior to sample preparation and analysis
Metcalf amp Eddy performed the sample preparation portion of the PCB analysis Rock
samples were weighed and gently placed in precleaned two liter glass beakers A quality
control surrogate compound was then added to each sample or method blank for subsequent
percent recovery determination The rocks were then immersed in extraction solvent
consisting of 30 percent acetone and 70 percent hexane by volume iEach sample and blank
was heated to 50degC and intermittently swirled by hand for a thirty minute extraction time
The extracts were then dried using sodium sulfate concentrated to 10 milliliters final volume
and submitted to ENSECO for PCB analysis using EPA SW846 Method 8080
The trench rocks were divided into three size categories with average diameters of one inch
two inches and three inches The rock size is an important consideration for the solvent
extraction remediation technique
^s^^ The three trench rock sizes and six cap rock samples were analyzed initially to determine the
extent of PCB contamination As outlined in the Quality Assurance Project Plan a second
portion of the cap rock sample with the highest initial PCB concentration was subjected to
water washing remediation and analyzed for PCBs Separate portions of the trench rock
samples were subjected to dry tumbling for ten and thirty minute intervals and water washing
for ten and thirty minute intervals The remediated rocks were then analyzed for PCBs
The dry tumbling and water washing were performed using an electronic rotary device The
rock samples were placed in clean two liter plastic sampling containers with screw cap
closures Laboratory distilled deionized water was poured into the water wash test
containers while the dry tumble samples had only the rocks enclosed
38 c
c 23 RESULTS
The one-inch average diameter trench rocks were initially contaminated with 1800 mgkg of
Aroclor 1254 Because the one-inch trench rocks were above the 10 mgkg cleanup standard
sample portions of the rocks were processed step by step through each of the four
remediations Although an eighty five percent reduction in PCB contamination was achieved
between the initial and final remediation samples the final concentration of 270 mgkg is still
well above the cleanup standard The results however showed a trend with the highest
concentration of PCBs detected on the initial sample lower PCB concentrations with the
ten-minute remediation and the lowest PCB concentrations achieved with the longest
thirty-minute remediation as expected The results for the one-inch trench rocks are
presented in Table 2-1
The two-inch average diameter rocks showed results similar to those of the one inch size
The initial sample had a concentration of 2500 mgkg of Aroclor 1254 The best
remediation result obtained was 450 mgkg for the ten-minute water wash sample A thirty c minute water wash sample for the two-inch trench rocks was not conducted when it became
apparent that a 10 mgkg cleanup level could not be obtained Because the 10 mgkg cleanup
level was not achievable the thirty minute water washing of two-inch rocks was not
conducted to minimize the level of effort and analytical costs The PCB result for the
thirty-minute dry screened sample 1900 mgkg Aroclor 1254 was higher than expected
This result was counter to the trend that was expected and observed with the one-inch rocks
and it demonstrates the non-homogenous nature of the rock samples This trend breaking
analytical result caused by the heterogenous or nonuniform nature of the rock sample matrix
was not repeated because the cleanup level could not be achieved The results for the
two-inch trench rock samples are presented in Table 2-1
The three-inch average diameter trench rocks yielded markedly different analytical results
The initial sample prepared with minimal on- site screening had a PCB concentration of
75 mgkg below the cleanup standard of 10 mgkg Although the initial result was below
39 c
TABLE 2-1 TRENCH ROCK WASHING RESULTS
Trench Rocks 1 inch Average Diameter
PCB Concentration
Sample mgKg
Initial sample 1800
Ten minute dry screened 620
Ten minute water wash 880
Thirty minute dry screened 290
Thirty minute water wash 270
Trench Rocks 2 inch Average Diameter
PCB Concentration
Sample mgKg
Initial sample 2500
Ten minute dry screened 490
Ten minute water wash 450
Thirty minute dry screened 1900
Trench Rocks 3 inch Average Diameter
PCB Concentration Sample mgKg
Initial sample 750
Ten min dry screened 210
Ten min water wash 025 UJ
Aroclor 1254 was the only PCB detected UJ - The sample was nondetect for PCBs to the estimated detection limit
of 025 mgKg
40
the cleanup standard it was close enough to warrant the first ten minute dry tumble c remediation step The first remediation step with a PCB concentration of 21 mgkg
confirmed that the three-inch trench rocks are less contaminated than their smaller
counterparts The three-inch ten-minute water washed sample was not submitted for fiill
quality control PCB analysis in an effort to minimize analytical costs The ten-minute water
washed sample result is from a partial quality control PCB screening analysis and is reported
as estimated Because of the lag time in tumaround of analytical results this sample had
been prepared extracted and screened and the information was available therefore it is
presented herein The results for the three inch average diameter rocks are presented in
Table 2-1
Six samples of cap rocks were collected and analyzed for PCBs AU of the results were less
than 02 mgkg or 200 xgkg For these cap rock samples an action level of 50 xgkg was
established in the Quality Assurance Project Plan The 50 xgkg value is an action level
established by EPA for this study only and is not a cleanup level identified in the ROD The
action if the results exceeded 50 igkg was to water wash the most highly PCB contaminated c sample Water washing was performed on cap rock sample number two The initial result
for this sample was 150 xgkg while the ten minute water washed sample yielded 24 igkg
Aroclor 1254 The cap rock results showed fairly consistent PCB concentrations in the range
of 50 to 150 igkg Aroclor 1254 The results are presented in Table 2-2
24 CONCLUSIONS
The cap rock samples were all determined to have PCB concentrations approximately one
hundred times less than the cleanup level of 10 mgkg Water washing conducted on the
most contaminated cap rock sample removed approximately eighty five percent of the PCBs
initially present These cap rock samples contained some fine soil like material which was
perhaps windblown carried on tmck tires or created by friction This material contributed
to the measured PCB concentrations for the cap rock samples
41 c
c TABLE 2-2 INTERIM REMEDIAL CAP ROCKS ANALYTICAL RESULTS
LOCAiSifi iiiiiiiiiiiiiii--iiiiiiiiiiiiiiiiiiiiidiiiiiiliiiiiiiii^ 10 minute Water Wash iiiii|ijii|iiii|iii^ PCB Concentration (ligKg)
1 120 NA
2 150 24
3 110 NA
4 31 U NA
5 86 NA
6 71 NA
Notes Aroclor 1254 was the only PCB detected U - Sample was nondetect for PCBs to the reported
detection limit - The highest initial PCB concentration cap rock sample was
subjected to a ten minute water wash remediation
42
C
The results of the rock tumbling and water washing demonstrate that this form of remediation r will not achieve the cleanup level of 10 mgkg for the one-inch and two-inch average
diameter overburden rocks The three inch rocks are below the cleanup level without
remediation It should be noted that these overburden rock samples were coUected from one
of the most highly contaminated areas at the site based on the remedial investigation results
These samples therefore represent worst case conditions
The dry tumbling remediation steps did not remove aU of the adhered soU particles as
anticipated This adhered highly PCB contaminated soU contributed to the measured rock
surface PCB concentration because the PCBs were extracted from the soU as weU as the rock
surface during sample preparation
The water wash remediation was effective in removing aU of the adhered soU The results
indicate that the rock surface and near surfaces have been contaminated with PCBs which
cannot be removed by water washing but are extractable with acetonehexane
c During the trench rock coUection ample one-inch and two-inch average diameter rocks were
avaUable at shaUow depths The trench had to be dug deeper to obtain the three inch size
rocks Because of the relative immobiUty of PCBs in soU the PCB concentration decreases
with depth as reported in the remedial investigation This decrease in PCB concentration
with depth is part of the explanation as to why the three inch rocks showed less
contamination than the smaUer sizes Also a factor is the surface area to mass ratio As the
mass of the rock increases the surface area to mass ratio decreases Since the PCBs are on
the surface or near surface of the rocks as the relative surface area decreases with size or
mass the reported concentration wiU decrease correspondingly
During the trench excavation and overburden rock coUection a two- to three-inch lens of
dark oUy appearing materials was observed This material was analyzed with a PCB field
screening kit and found to contain in excess of 10000 mgkg PCBs Some of the one and
two-inch diameter rocks sampled appeared dark in color Because it was not known whether
43 c
c
the dark rocks were naturaUy colored or from the tarry lens and to keep the study unbiased
these dark rocks were sampled randomly with the remaining rocks The dark appearing
rocks were estimated to comprise approximately five percent of the one and two-inch rock
sizes Inclusion of highly contaminated rocks in the samples would boost the reported PCB
concentrations
Altemative remedial measures other than rock tumbUng and water washing include detergent
and water washing organic solvent washing or steam cleaning Although preUminary
indications from the solvent extraction vendors are that only up to one inch size rocks can be
handled the possibiUty of designing a treatment system to handle larger rocks wiU be
explored during the design phase of this project If the size of the rocks precludes them
from remediation by solvent extraction along with contaminated soUds a rock cmsher wiU be
employed to reduce the contaminated rocks to a size that can be handled Although other
altematives for rock remediation might work solvent extraction with contaminated soUs or
rock cmshing foUowed by solvent extraction appear to be the easiest most cost effective
means to achieve the cleanup standards Whichever remedial altemative is selected rock
washing would only be necessary on rocks with average diameters between one and two
inches coUected from soU highly contaminated with PCBs A very rough estimate of rocks
onsite between one- and two-inch diameters is approximately 5000 tons No remediation of
the rocks is necessary if the solvent extraction technology can handle two-inch size rocks
44 c
z[v(x^(rogt 5
EPA Contract No 68-W9-(X)36 EPA Work Assignment No 19-1N51
Phaie I RI umpling conducted in May 1988 Phaae II RI lampling conducted in April 1989
NC bull No criteria cxitta for thia compound
(1) Inaufficient Data to Develop Criteria Value preaented ia LOEL shy Loweit Obierved Effect Level
(2) Value preaented for carelnogeiia ia the 10-5 level
(3) Value preaented ia for dichloroethenea
(4) Value preieoted ia for trana 12-dichloroetliene
(5) pH dependent criteria (78 pH uted)
(6) Value preaented ia for chlorinated benzenea
(7) Value presented ia for total PCBa
(8) Effluent DiKhaige Limit based upon an effluent discharge of 5 gpm to the Neponset River during the 7-day low flow lOyr recurrence (2O20gpm)
USGS Pleasant Street Oauging Station on the Neponset River
(9) Dilution factor =[(5gpm+2020gpm)5gpml= 405
(lO)Concentration exceeds effluent discharge limit contaminant must be removed by Groundwater Treatment Plant before discharge to surface water [D=DAILY MAX A=AVG MONTHLY F=FISH]
-
-
-
- - -
-
-
-
-
-
o n o TABLE 1-3 COMPARISON OF METAL CONTAMINATION IN GROUNDWATER WFTH EFFLUENT DISCHARGE LEVELS - DISCHARGE TO THE NEPONSET RIVER
bull bull bull bull bull bull bull bull bull bull bull bull - bull bull bull bull gt gt bull gt bull bull bull bull bull - bull bulliii|vO|| iS iggJMLnei i iaD s-UNFILTEREDgssHis M-B33nsRmmMMM D A I L Y iiiiiiiiiiiiiAVGiiiiii |i mmmmMmmm Xy lira^li P H A S E I WtiiMM liwiAiiiii iiiiimiii iii-pHiwiiliiiii WampMM P H A S E I ilii iiwgiiiiiiiiiiiiiiiii|iiiii iiiiiiiiiiiiiiiiiiiili|i| iiii iiiiii iiiiiiiiiiiiiiiiiiii M A X I M U M iiiiipifriiii^iiii iiiiiiiiiiiiifiiii iiiiiiiiiiiiiiiii
555^gt5^5V555^^^^ i i i ilaquoiij S U R F A C E m m m Wtm^itM B E D R O C K bull bull gt f t bullbullbull B E D R O C K iiiFRiiliiiiiiiiiiiii iiiiiiijsiiiiiriiiiiiiiiiiiiiiii iiii|iiiiiiliiiiiiii E F F L U E N T E F F L U E N T E F F L U E N T iiiiiiiiiiiiiiiiii wmmm |||ii||li| |i IliAiiiiil WliampiMM liiiiltiilii^isiiii liiiiifctAXliii iiiAiiiiiiiiiiiiiiiii i^i^iibhreiiiiiiiiiiliiiiiiii liiiiiii iiHiiiiiiiiiiiiii- D I S C H A R O E D I S C H A R O E D I S C H A R O E iiiii imm^mi mmmn WmMm WBrnB
PARAlt4ETER W iMmm iiiiiiiii iiitjiiiii Wi^MMM iiii iiiiiiiiilii iiiaraquoliiii W-imMMi iiiiiiaiiiii mMmmmm iCSiiMAiiiiii O O N S U M P iiiiiiiVEitiiii liiiiisyifeEiiiiiiiii iiiiiiiiiitiiiiL iiii cii^i iiiiiifl|5iili iiiiiiili (UOW iiiiiiii (oon) iiiiult3piili (UOL) lzMcii0m (UGL) iipiiiiiiiiiiiiiiiiiiiiii ii|^(Siliiiiiiiiii|iiiiii (UOL) (2) (UOL) (6)C7) (IKJL) (6)C7) (UOn) (6) C7) i^iipi
M E T A L S
A h m i n u m 154000 390000 119 352 12500 43900 74 77 NA NA NA NC NC NC
fMgtimi-^ztm zmisectmi iMiMM wmmi M^iiiiampii iiJiiM 189 iiiiiiiiiisiiiiiilaquo3iii iiiiiiiiiiiiiiiiiiiiiifii iiiiiiiiiiiliiiii^-iiiii isiiiiiiiiiiisiiiii CJiiiiiijiii iiiiiiiiiiiiiStCiiiiiii iiiiiiiiiiiiiiiiiiiiiiiiiiiiM bullsiiiii iiiiiiili5 iiiiiiiiiiiiiii|iiiiiiiiiigtireii iiiiiiii-shy bull bull bull bull bull bull bull bull bull iiiiiiliiiiiiWiii bull bull laquo raquo - iiiiiiiiiililiiiiiiiilifii iiiiiiiiiiii iii|iiiiiiiiiiiiiiii l i i i i i i i i i i^ i l l l i s i i iiiiii i-iiiiiiiSiiiiiiisiiii iiiiiiiiiiiiiiiiii|fltii- 405000 iiiiiiiiiiilliiiiiiiiwii iiiiAiiishymBmmm imampmm WmMM Wimm iiiiillili iiiiiiiiliiiiiii
Lead 43 i t3 21 168 l i 37 30 168 14 (3) 054 p) NC 5670 219 NC
iiititlj^iusibiii^j iilllJii^ -M-W^M iiiiiiii^^i^ ii-|7laquo- L5W iiiiiiiiiiiiiilliiifii iiiiiiiiiiiiiiiltiiiiiiiiiiiiliiiiii ii5iiiiiiie iiiiiiiiiiii bullbull bull l t raquo iiiiiiiiiiiiiiiNC iiiiiiii isci i i i | | i i i | | i p i i II0M^I iiiiiliiiiiiiiilii WM^MmM ilillilflil i | | | l il |o| | l i i l i P liiiiiiiiii iiiiiiiiiiiiip8iii bullbull ( U si i l i l i iiiiii- iiii-li|i5 iiiiiiiiiiiiiiiiiiii iiiiiiiiiiipiiiiiiii-iiiiiiiiiiii -i- o-iil bull iiiiiiiiiiiiiiiiiiiiiiiiiiiM iiiiiiiiiiiiii iiiii iiiiii iiii iiiiii laquoiii
|i|||ii Iliii illl|iillSI |illliSl^| illillaquoii iiiiiiiiiiiiiiiiiiii iiiiiiiiiliiltiii laquo raquo iiiiiiiiiiiii||i||| iiiiiiiiiiiiii iii|i|ltoigttiiiiiiiiiiiiiiii i iiliiiiilii iiiiiiiiiiiii bull^bull i l iNc| i-|iiiii -i-iii ii gti5 i iiiiiiiili^^ iiiiiiiiiiii Oiiiiiiii|i bulliiiiiiii Sodium 14100 28900 12500 26raquo00 16320 33200 16300 68000 N c NC NC Nc NC Nc Thal l ium 10 10 58 10 1400 (1) 40 (1) 32 567000 16200 1296
igtPiiiilli MmmmiM liilililil iiliiiiisii iii|ii| bulliiii iiiiiisiiilii iiiiiiiiiiiii|i ii^|i iiiiiiiiiil iiiiiii iiiiiiii ii^iliiiiiiiNiilliiiiiiiji- bulli|iiiiiflaquoSiiiiiiiiiiiiiiiiii iii|lNe-|i-ii iiiiiiiiiisiiiiiiiiiiiiiiii Nc iiiiiii liiNCii iiiiiii iiiiiiiilifiei iiiii iiiiiii iilaquo|||il| mmmmi m m m i M iiiiiiiili iiiiiiiiiiiiiiiiisil i iiiisiiiiilllii iiiiliiiiiiiiliiiiiiiiiitii iiiiiiiiiiiiiiiiiiiiiiiiiiifiii iiiiiiliili-|s4ii iiilliiiiiiii ssiiiiiiiiiiiiii iiiiiiii^^iii-iiiii iiiiiiiiiiiiiiiiiiiiiiiliii i iiiiiiiiiiiiiiliiiiiiii 13365 iiiiiiiliiiiiiiiiiiiip^ P b a i e I RI sampling conducted in M a y 1988 Phase II RI samplmg conducted in Apri l 1989
N C = N o cri teria exiata for th is compotmd
N A = N o t Available
(1) Insufficient Data to Develop Cri ter ia Value presented is L O E L - Lowest Observed Effect Level
(2) Value preaented for careinogena ia the 10-S level
(3) Hardness dependent c r i te r ia (25 mgA C A C 0 3 uaed)
(4) Value presented is for Ihe m o r e toxic hexavalent form
(5) Value presented is proposed (more conservat ive)
(6) Effluent Discharge L imi t dilution factor based upon an effluent discbarge of 5 gpm to the Neponse t River during the 7 - d a y low flow lOyr recurrence (2020gpm)
USOS Pleasant Street Oaug ing atation on the Neponset River
(7) Dilut ion factor =[(Sgpm+2020gpm)Sgpm]= 405
(lO)Concentration exceeds effluent discharge limit contaminant must be removed by Groundwate r Treatment Plant before discharge to Ihe Neponset River [ D = D A I L Y M A X A = A V O M O N T H L Y F=FISH]
c and 1-3 for effluent (Uscharge limits for organic and inorganic compounds An acute toxicity
test showed that no toxic effect was observed for the interim treatment discharge
114 Conclusions
Based on the results of the Phase I bench scale treatabUity study the combined unit
operations of fUtration foUowed by carbon adsorption were effective in treating the
contaminated groundwater coUected during the pumping tests for temporary discharge to the
Neponset River A sample of the discharge was coUected during the groundwater treatment
and it was found to contain less than the quantitation limit of 05 xgL of PCB The metals
concentrations were aU determined to be below the discharge criteria A sample was also
coUected and submitted for an acute toxicity determination The resuUs showed that no toxic
effect was observed The bench scale treatability results and the on-line discharge analyses
demonstrate that the filtration and carbon adsorption unit operations were effective temporary
treatment techniques
^ 12 FULL SCALE STUDY
A groundwater treatability study was conducted to evaluate the performance of four different
treatment processes on contaminated groundwater obtained from the Norwood PCB site The
contaminants present in the groundwater were determined during previous studies conducted
in May 1988 and AprU 1989 by EBASCO Chapter 1 of the Final FeasibUity Study
(EBASCO 1989c) contains an overview of the results obtained during these investigations
Based on the resuUs of the May 1988 and AprU 1989 field investigations EPA concluded
that the overburden and bedrock aquifers beneath the site were contaminated with
polychlorinated biphenyls (PCBs) and volatUe and semivolatile organic compounds (VOCs
and SVOCs) It was determined that surficial and subsurface soUs dredge pUes of sediments
taken from Meadow Brook sediments in Meadow Brook and sediments in the drainage
system of the buUding operated by Grant Gear were the sources of the contamination In
r
c September 1989 EPA released the Record of Decision (ROD) for the Norwood PCB site In
the ROD EPA directed that groundwater be treated with a system including activated carbon
air stripping with vapor controls and precipitationfiltration iEPA also directed that
treatability studies or pUot studies be conducted to aid in the overaU design of the system
In accordance with the ROD a bench scale treatabUity study was conducted at the ENSECO
Laboratory Facility in Cambridge Massachusetts by Metcalf amp Eddy personnel between
January 14 and February 16 1992 This report presents a description of the work
completed resuUs and conclusions of the study
121 Objectives
The fuU-scale groundwater treatability study was conducted to determine if treatment
consisting of precipitation fUtration air stripping and carbon adsorption would effectively
remove the contamination present in the groundwater at the Norwood PCB site to appUcable
standards Information on the percent reduction of organic and inorganic compounds in the
groundwater volume type of residual and byproducts produced by each component were
also investigated A schematic detailing the treatability study and the sampling and analysis
conducted is presented in Figure 1-1
122 Description of Work
The treatability study was performed in accordance with Pre-Design Work Plan 3 and the
QuaUty Assurance Project Plan for the Phase n Bench-Scale TreatabiUty Study (Work
Plan 3)
Groundwater samples were coUected from the Norwood PCB site for use in this
investigation Interim sampling was performed on effluent streams generated from each
bench-scale process for analysis according to Table 1-4 Influent and final effluent samples
generated during the groundwater treatabiUty were coUected and analyzed through the CLP
^
o JAR TESTING SAMPLE ID
o
POLYMER TESTING
RAW GROUNDWATER
VOL 1 SVOL I p PCB f ^ ^ METALS
mdash SST
T
T
T
SS - Choose Polymer T ar)d Dose Estimate pH pf i After Coagu lant
Jar Test 1 PH10 bull
Lime wCoag wPdymer - SS T Metals
Ume wCoag wo Polymer - SS T Metals
- NaOH wCoag wPolymer - SS T Metals
NaOH wCoag wo Polymer - SS T Metals
Jar Test 2 pH9
Jar Test 3 pH8
bull
Lime w C oag wPdymer - SS T Metals
- Lime wCoag wo Polymer - SS T Metals
- NaOH wCoag wPolymer - SS T Metals
NaOH wCoag wo Polymer - SS T Metals
- Lime wCoag wPolymer - SS T Metals
- Lime wCoag wo Polymer - SS T Metals
- NaOH wCoag wPolymer - SS T Metals
- NaOH wCoag wo Polymer - SS T Metals
JT1 -1 shy
j r i -2 shy
JT1 -3 shy
JTI-4
j r 2 - 1
JT2-2 shy
JT2-3
j r2-4 bull
JT3-1 shy
JT3-2shy
JT3-3 bull
JT3-4 shy
HLTRATION TESTING
RIter Paper 1 - SS T Time mdash |
RIter Paper 2 - SS T Time-
Rlter Paper 3 - SS T Time -
CtHXise Filter Paper or Particle Retention Size
Sample Well Using Bailer
VOL SVOL PCB CLPMETALS (PPF-1)
Precipitate and Filter Using Optimized Polymer pH Coagulant and Filter
system for volatUes semivolatUes PCBs and metals AU interim samples were analyzed at
ENSECO in Cambridge Massachusetts AU data was vaUdated by MampE according to the
QAPP
1221 Groundwater Sample CoUection Groundwater for this study was coUected from
weUs MW-IA and ME-8 as shown on Figure 1-2 iMW-lA was chosen as a sampling
location because it was determined to be one of the most contaminated weUs on-site based
on previous investigations During the course of the treatabiUty study a decision was made
to obtain samples from ME-8 because results of the most recent sampling effort conducted by
ICF indicated that groundwater from this weU contained approximately 200 xgL vinyl
chloride whereas groundwater from MW-IA no longer contained any quantifiable amount
Removal of vinyl chloride by aeration needed to be demonstrated during this investigation
because vinyl chloride is not effectively removed by carbon adsorption
Groundwater samples were obtained on four separate occasions during the study as shown in
Table 1-5 On each occasion the groundwater was coUected in accordance with the Field
Sampling Plan Three weU volumes of water were purged from the weU using a centrifiigal
pump before any samples were coUected The pH temperature and conductivity of the
purge water was measured after each weU volume untU the measured values differed by less
than 10 for three consecutive samples to ensure the sample drawn was representative of the
water in the aquifer Samples for the metals precipitation and filtration study were coUected
using a centrifugal pump Samples for the air stripping and carbon adsorption study were
coUected with a teflon baUer to minimize aeration and possible loss of volatUes during
sample coUection
The samples were coUected in one gallon amber glass bottles and stored at 4degC Each
sample bottle wasfiUed to exclude a headspace in the bottle
e 10
200 200
SCALE IN FEET
D CAP ROCK SAMPLE LOCATION
bull WELLS
nOURE 1-2 GROUNDWATER AND TRENCH AND CAP
ROCK SAMPLING LOCATIONS
11
E T C A L F a EDDY
c TABLE 1-5 GROUNDWATER SAMPLING SUMMARY
Mode of Date WeU Amount Sampled pH Temp degC Conductivity SampUng
11392 MW-IA 10 gallons 62 8deg 220 umhocm pump
12792 MW-IA 16 gaUons 62 8deg 220 umhocm baUer
20392 MW-IA 16 gallons 62 8deg 220 umhocm baUer
20592 ME-8 2 gallons 64 8deg 230 umhocm baUer
1222 Precipitation Testing
General Chemical precipitation for the removal of metals was evaluated at three pH values
and three polymer dosages to determine the effectiveness of the treatment A preliminary
evaluation of different coagulants and polymers was conducted at three pH values by
r Metcalf amp Eddy personnel and a leading polymer vendor to determine which chemicals could
potentiaUy be used to precipitate groundwater Based on the results from the preliminary
evaluation jar tests were conducted by Metcalf amp Eddy personnel to aid in the determination
of the chemical dosages required to optimize the effectiveness of precipitation
Polymer and Coagulent Testing Polymer testing was performed by Metcalf amp Eddy and a
leading polymer vendor at the ENSECO laboratory faciUty in Cambridge Massachusetts
The effectiveness of anionic cationic and nonioiuc polymer was evaluated at three pH
values The best polymer was determined to be Drewfloc 2270 a low charge anionic high
molecular weight polymer This polymer was used in jar tests 1 through 5 The best
coagulent was determined to be Charge Pack 12 (CP-12) a higher charge cationic low
molecular weight coagulent The CP-12 coagulent was used in jar tests 1 through 5
described under jar testing
12 c
InitiaUy the effects of varying the pH of the groundwater sample was investigated Tests c were conducted at pH values of 80 90 and 100 with sodium hydroxide which had the best
settling characteristics based on visual observation and turbidity measurement Each polymer
was then tested at pH = 100 to evaluate Us effectiveness under optimum pH conditions
A formula of polymer and coagulant addition was developed based on visual observations
suspended soUds and turbidity analyses performed on each sample generated during the
investigation The anionic polymer effectively flocculated the existing smaU suspended
particles and the addkion of cationic coagulant removed iron and color when the pH was
raised to 100
Jar Testing Five jar tests were performed using the polymer and coagulants determined to
be effective during preliminary testing Jar tests 1 and 4 were conducted as dupUcates at
ph 10 Jar test 2 was conducted at pH 9 jar test 3 was conducted at pH 8 and jar test 5 was
conducted at pH 10 On each occasion prior to beginning the jar test the raw groundwater
was brought tol5deg-17degCina warm water bath The temperature was held constant to c eliminate the effects of temperature on reaction rates and solubUity
The foUowing is a description of activities conducted during the jar tests fti through 4 See
Figure 1-1 for details Four samples were evaluated during each jar test For each jar test
four 15 Uter beakers were fiUed with 1 Uter of raw groundwater The beakers were placed
on the stirrer platform and the paddles were lowered into the sample The jar stirrer was
operated at 80 revolutions per minute (rpm) The pH was then adjusted to the desired value
(pH = 10 9 8 10 for Tests 1 2 3 4) with a lime slurry in two samples and with a
sodium hydroxide solution (25) in the remaining two samples Lime was added to
investigate its effects on the precipitate and to evaluate its effectiveness in pH adjustment
The cationic coagulant was then added to each sample untU the concentration in solution was
30 mgL The solution was stirred at 80 rpm for 2 minutes to ensure complete mixing The
polymer was then added to one sample pH adjusted with sodium hydroxide and one sample
pH adjusted with lime Mixing continued for two minutes Next the solution was stirred
13 c
slowly orflocculated for five minutes at 20 rpm FinaUy the solutions were aUowed to
c settle for 10 minutes Visual observations were recorded and samples were submitted for
suspended soUds turbidity and metals analyses
Jar test 5 was performed to assess the removal of manganese and aluminum by preaeration
and permanganate additions (see Figure 1-1) Because no significant benefit was observed in
the previous tests when lime was used instead of sodium hydroxide sodium hydroxide was
used to adjust the pH in aU four samples to a pH of 100 in jar test 5 Only sodium
hydroxide was added to the groundwater in the first jar to determine the removal of
manganese and aluminum attributable to the formation of an insoluble salt at high pH
Sodium hydroxide and polymer were added to the second jar to evaluate the effectiveness of
the polymer Sodium hydroxide polymer and coagulant were added to sample 4 The
supemate from sample 4 was then fUtered This was performed to determine if the required
removal efficiencies could be achieved by chemical precipitation and filtration
Permanganate was added to sample 3 in addition to sodium hydroxide coagulant and
polymer to determine if the manganese and aluminum present could be chemicaUy oxidized c to a less soluble state which would enhance the efficiency of fUtration The supemate was
then siphoned off using clean tygon tubing and a syringe into the sample containers
Samples were submitted for metals suspended soUds and turbidity as illustrated on
Figure 1-1
1223 Filtration Testing A bench-scale filtration study was perfonned to determine the
optimum pore size of filter media that could effectively remove the suspended soUds in the
precipitated groundwater The determination of the removal efficiency for each filter was
based on the concentration of suspended soUds and turbidity of the filtered water The time
required to filter the groundwater was also evaluated
Prior to filtration the metals in the groundwater were precipitated and coagulent and polymer
were added using the optimum conditions developed during the precipitation study The
optimum conditions consisted of pH adjustment to 10 with sodium hydroxide addition of
14 c
coagulent CP-12 to a concentration of one percent and addition of Drewfloc 2270 polymer to
c a concentration of 10 mgl Three grades (10 xm 5 xm and 1 xm pore sizes) of filter
paper were used with a Buchner ftmnel to filter aUquots of the precipitated groundwater
Samples of the filtered water were submitted to ENSECO for suspended soUds and turbidity
analysis
A sample of the metal hydroxide sludge was coUected during the treatability study The
sludge sample was submitted to the CLP system for PCB and metals analysis so that a
characterization of the sludge could be made and disposal options could be evaluated
1224 Air Stripping Testing Precipitated fUtered groundwater was aerated at three
different air to water ratios to determine the most effective stripping ratio To ensure that
worst case volatUe organic compound concentrations were present in the samples for this
study some modifications were made in how the sample was coUected and treated First
the groundwater was coUected with a baUer to prevent the loss of volatUes AdditionaUy the
water was fUtered under positive pressure foUowing the precipitation step to minimize the c loss of volatUes that would result if the water was filtered using a vacuum pump
An aquarium pump tygon tubing and aeration stone with a glass-fiber fUter cartridge was
used to aerate 1-Uter aUquots of precipitated and filtered groundwater The aeration flow
rate was caUbrated by filling a graduated cylinder with air that had been filled with tap water
and inverted in a water bath The air was diffused at 375 missec into 1-Uter aUquots of
groundwater and the time measured as iUustrated in Table 1-6 The aerated groundwater was
submitted to ENSECO for volatUe organics analysis
1225 Carbon Adsorption Testing The effectiveness of activated carbon for the removal
of organic compounds in the groundwater at the site was evaluated The carbon used was
the powdered activated 325 mesh carbon suppUed by Calgon Corporation The groundwater
samples used for this investigation were obtained and filtered as described in the air stripping
15 c
c
c
TABLE 1-6 AERATION TEST OPERATIONS
Air to Water Ratio Volume Volume of by Volume of Water Air Reqd Min of Aeration
251 1000 ml 25000 ml 111 501 1000 ml 50000 ml 222 751 1000 ml 75000 ml 333
section of this report to minimize the loss of volatUes A total of twelve samples were mn
during this investigation The necessity of air stripping was investigated by comparing the
resuUs from four samples that were air stripped to seven samples that were treated identicaUy
with the exception of air stripping AU samples for the air stripping comparison went
through the precipitation filtration and carbon adsorption processes AdditionaUy one
sample was prepared with no carbon added to serve as an untreated sample The samples are
summarized in Table 1-7 Each groundwater sample was prepared and mixed with a
predetermined dose of Calgon powdered 325 mesh activated carbon and placed m an open
Erlenmyer flask on a shaker table for a two-hour time period at 180 rpm A rotary shaker
table capable of accommodating twelve (12)-1000 ml Erlenmyer flasks was used Effluent
was fUtered with a barrel filter using a glass-fiber pre-fUter and a Whatman 45 micron
membrane The effluent clear and odorless in aU cases was added to sample containers
preserved and packed for shipment to CLP laboratories Since the shaker table could
accommodate 12 flasks a total of approximately 4 gaUons of effluent was generated during
each mn Several mns were performed to generate adequate quantities of sample for
analysis accordmg to Table 1-7 Groundwater was simUarly prepared for submittal to
Aquatec Lab in Burlington Vermont for chronic toxicity testing Three (3) shipments of
approximately 2 gaUons each were made
r 16
C) o o TABLE 1-7 CLP TREATABILITY STUDY SAMPLING SUMMARY
Dose g of Carbon Required of mis in gs Carbon
Sample ID 1000 ml of GW Analysis Volume mis Flasks Flasks in each
Precipitation Filtration Aeration amp Carbon
AC-1 05 V SV MET 3400 3 1067 054 AC-2 20 V SV PCB 4400 4 1100 22 AC-3 50 V SV MET 3400 3 1133 57 AC-4 100 V SV PCB 4400 4 1100 110 AC-5 Trip Blank 0 V
Precipitation Filtration amp Carbon
C-0 0 V 500 1 500 0
C-1 05 V SV MET 3200 3 1067 053
c-2 10 V PCB 2200 2 1100 11
C-3 20 V SV CT 29000 24 1250 25
C-4 50 V SV PCB 4400 4 1100 55
C-17 70 V MET 1200 1 1200 70
C-18 100 V SV 2200 2 1100 110
C-13 Treatability Blank 0 V PCB 2200 0 0 0
C-20 Trip Blank 0 V 0
C-10 Duplicate of C-1 05 SV 2000 2 1000 05
C-1 05 (MSMSD) 500 1 500 025
C-11 Duplicate of C-1 05 MET 1000 1 1000 05
C-20 Duplicate of C-2 10 V PCB (MSMSD)
4400 4 1100 11
C-16 Duplicate of C-4 50 PCB 2000 2 1000 50
C-6 0 PCB 2000 2 1000 0
17
o o n TABLE 1-7 (Continued) CLP TREATABILITY STUDY SAMPLING SUMMARY
Dose g of Carbon Required of mis in gs Carbon
Sample ID 1000 ml of GW Analysis Volume mis Flasks Flasks in each
Precipitation amp Filtration
PPF-1 V SV MET PCB 2000 2 1000 0
Sludge
Sludge-1 0 MET PCB 0
V = VolatUe organics SV = Semivolatile organics MET = Metals PCB = Polychlorinated biphenyls CT = Chronic toxicity MSMSD = Matrix spikematrix spike dup D = DupUcate TB = Trip blank PPF = Precipitated and pressure filtered
(to minimize volatUes loss as opposed to vacuum filtration)
18
c
c
123 Results
1231 Precipitation Testing
Polymer Testing Preliminary polymer and coagulant testing was conducted to determine
the type of polymer and coagulant that could be employed to treat groundwater from the site
The Drewfloc polymer and the Drew CP-12 cationic coagulant were chosen as the most
effective types InitiaUy the effect of varying the pH of the groundwater sample was
investigated The resuUs of tests conducted at pH values of 80 90 and 100 are presented
on Table 1-8 As the pH value was raised the quaUty of the floe improved The sample
raised to a pH level of 100 with sodium hydroxide exhibited the best settling characteristics
based on the color turbidity soUds and the quaUty of the floe
The effects of varying the polymer dose was then investigated at pH=100 The cationic
coagulant added to a concentration of 30 ppm after pH adjustment and prior to polymer
addition produced the clearest supemate based on color turbidity and suspended soUds
results Table 1-8 also summarizes the results from this investigation
Jar Testing Four jar tests were performed to evaluate the effectiveness of chemical
precipitation for the removal of metals in groundwater from weU MW-IA The analytical
results from the jar test are presented in Table 1-9 The greatest metal reductions occurred
when the pH was 100 Samples for which the pH was adjusted with lime showed better
removal of barium manganese and sodium concentrations than those samples for which the
pH was adjusted with sodium hydroxide Samples for which the pH was adjusted with
sodium hydroxide showed greater declines in the concentrations of calcium and magnesium
No significant effect was observed on the removal of cobalt iron lead aluminum potassium
and zinc when lime or sodium hydroxide was used to raise the pH The observation that
samples for which the pH was adjusted with sodium hydroxide had elevated concentrations of
19 c
c TABLE 1-8 PRELIMINARY POLYMER TESTING RESULTS
Description of Supemate
Procedure pH ColorSoUds
mgl Turbidity
NTU Floe SettleabUity
Varymg pH
Raw Groundwater pH adjustedNaOH pH adjustedNaOH pH adjustedNaOH
62 80 90 100
YeUowbrownYeUowbrownYeUowbrownYeUowbrown
450 gt50 gt gt 5 0 gt gt50
58 SUght mst pin floe medium
gt medium
None Slow Faster Fastest
Varying polymer dose pH adjustment wNaOH
pH adjustedno polymer
100 YeUowbrown gt gt50 gt medium Fast
Above wpolymerat 1 ppm
100 Light yeUow lt 10 35 large 18 Fast
c Polymer at 5 ppm 100
Polymer at 1 ppm 100 wcoag 30 ppm
Light yeUow
Very Ught
lt 10
lt 10 yeUow
32
30
Large 18
Targe 18
Fast
Fast
n 20
o o n TABLE 1-9 F U L L - S C A L E TREATABILITY STUDY JAR T E S T R E S U L T S
Results in mgL
SAMPLE ID iiiiiiiiiiiiiiiiiiiiMW JAiSiiii iiiJTililiiiiiiiiiiii iiiJTil^iiiiiii iiiiiiiiiiTIi3iiiiiiiii iiiii^ii^li^iiiiiiiiiiiiii^iiri^iiiiisiiiiiiiiiiiiimii iiiiiJT4^iiiiiiiiiiiiiinP4i4iiiiiiiiiii iiiiiJT2iiliiiiiiiiiiiiT2^iiiiiii |i|S^ iiiiiiiiiiiiiiiiiiiiiiiiiiiiilM ii iiiiiiiiiiiiiiiiiiiiJlt iiiiiiiiii iiiiiiiiii-iiiiiiii iiiiiiiii=iiiiiiiiiiiiiliiiiii iiiiiiiiiiiiiiiiiiiiiiliiiiiiiiiiiiiiiiiiiiiiiiiiliiiiiiiiiiiiiM ii^iiiiiiiiiiiii6iiiiiiiiiiiiiiiiiiijqiiiiii mmsectlsectMimamp0^
Zinc 0488 002 U 002 U 002 U 002 U 002 U 002 U 002 U 002 U 002 U 002 U
E S A M P L E ID iiiiiiiiiiiiiiiiiiiiJT2i3iiiiiiiiiiiiiiiii ^T2-4iiiiiiiii iiiiiiiiJ^alliiiiiiiiiiiii iii^Ta^iiiiiiiiiiii iiiiiiiiit3|3iiiiiiiiiiiii iiilT3Tr4iiiiiiiiiiiiiii rrs-i iiiiiiiiiiiiiiJTSl iiiiiiiiiiiiiii iiiiiitJiJiiiiiiiiiii iiiiiiWs-4iiiiiiiiiiiii iiiiiiiJT5r-5ii|iiiiiiii
iiiiiiiiliiiiiiiiiiiiiiiiiBSsiii iiiiiiiiiiiiiiiiiiiiiilgtHiiiiiiiiiiii iiiiiiNaOHiiiiiiii iiiiiiiiiiii)iliimiiiiiiiii iiiiiiiiSiiriiiisiiiiiiiiii iiiiiiiiNiliiiiiiiiii iiiii iNapHiiiiiiiiiiiii iiiiiiiiiiiiiiiifloiiiiiiiii iiii^iiiiiiiiiii iiiiiiii NiitQHiiiiiiiii iiiiiiiiiWftOHiiiiiiii wmm iii^iiiiiiiisiiiiiiiAli|ilii iiiiiiiiiiixiiiiiEal3i iltgtoi PolyCoag C o a g u l a n t PolyCoag Coagulant iiiiiiii iiiiiii iiiiiii)|sihyii^iiiiiiii PolyCoag PolyCoag iiiPoij^iii^il ANALYTES Aerated KMn04
Barium 0073 0072 010 010 010 010 NA NA NA NA NA Calcium 247 247 571 574 273 277 NA NA NA NA NA Cobalt 001 U 001 U 0017 0018 0017 0019 NA NA NA NA NA Iron 01 U Ol U 016 023 016 043 NA NA NA NA NA Lead 0005 U 0005 U 0005 U 0005 U 0005 U 0005 U NA NA NA NA NA Magnesium 44 44 50 51 50 50 NA NA NA NA NA Manganese 35 33 43 43 44 44 063 086 099 094 14 Potassium 5 U 5 U 5 U 5 U 5 U 5 U NA NA NA NA NA Sodium 423 477 170 169 502 508 NA NA NA NA NA Zinc 002 U 002 U 0082 011 015 016 NA NA NA NA NA
Notes Only metals detected in untreated groundwater from MWIA are presented NA = Not Analyzed
U = undetected at specified detection limit JTI = Jar Test 1
c
c
sodium in the treated water was expected This is because sodium is a component of sodium
hydroxide Similarly the elevated concentrations of calcium observed in samples for
whichthe pH was adjusted wUh lime are due to the calcium component in lime Jar test 5
was conducted to assess the effect that precipitation and chemical oxidation had on the
removal of manganese and aluminum The results of this investigation are also presented in
Table 1-9 The results indicate that greater reductions of aluminum and manganese cannot
be achieved with aeration or by the addition of a chemical oxidant such as permanganate
A sample of the metal hydroxide sludge a residual that wiU be generated during the
groundwater treatment was analyzed for metals and PCBs This sample of sludge was
generated by treating contaminated groundwater with precipitation and filtration using the
optimum treatment parameters The metals results indicate that the sludge would not be
considered hazardous under RCRA using the toxicity characteristic leaching procedure
(TCLP) A TCLP was not performed on the sludge however based on 1) the concentration
of the metals in the sludge 2) assuming a 100 leachability and 3) incoiporating a 20-fold
dUution for a soUd matrix analyzed by TCLP this sludge would not be considered hazardous
under RCRA The PCB analysis of the sludge showed that Aroclor 1254 was the only
detected PCB at a concentration of 31 mgkg The TSCA limit for PCBs in waste is
50 mgkg indicating that this sludge would not be hazardous under TSCA The results for
this sludge represent a preliminary characterization and once the fuU scale treatment system
is on line the sludge analysis wiU need further testing to confirm these preliminary results
and to make a further assessment of the disposal options The analytical resuUs for the
sludge are presented in Table 1-10
1232 FUtration Testing A bench-scale filtration study was performed to determine the
optimum particle retention grade or mesh of filter media that could effectively remove the
suspended soUds in the precipitated groundwater The results of the analysis on the fUtrate
are presented in Table 1-11
n 22
c
c
TABLE 1-10 PRECIPITATED METAL HYDROXIDE SLUDGE RESULTS Results in mgkg
i||ipiiiii|iiiiiiiiiiiiiiiii^^iiiili|ii^^^ TCLP or TSCA L i n i l t s i Tfesi-iiiiiiiiiiiiiiisiiiiii^iiiiiiSvHiij^ in Solid Matrices ii iiiiS WM3KT2S
METALS
Aluminum Antimony Arsemc Barium Beryllium
Cadmium Calcium Chromium Cobalt Copper Iron Lead Magnesium Manganese Mercury Nickel Selenium Silver Sodium Thallium Vanadium Zinc
PCBs
Aroclor 1254
41100 231 195 346 5767
9120 338
25 114
39000 694 5260 2730
03313
04
8960 08
561446
31
U U
U
J
U U U R
U U J
J
NC NC 100
2000 NC 20
NC 100 NC NC NC 100 NC NC
4 NC 20
100 NC NC NC NC
50
Notes = TCLP Limits incorporated a 1 to 20 dilution factor for solid matrices Aroclor 1254 was the only PCB detected The remaining six Aroclors
were nondetect at a quantitation limit of 36 mgkg NC = No criteria exists for this compound U = Undetected at speciiied detection limit
L J = Estimated value due to validation criteria R = The result is rejected
23
c
c
TABLE 1-11 FILTRATION STUDY RESULTS
Media Rating Speed Suspended SoUds Turbidity
Raw 45 mgl 578 Course 10 um 200 mls5 sec lt5 mgl 16 NTU Medium 5 um 200 mls7 sec lt5 mgl 19 NTU Fine 1 um 200 mls23 sec lt5 mgl 18 NTU
Since there was virtuaUy no difference in the quaUty of effluents but substantial increase in
time to filter with the fine filter paper the medium 5 micron paper was chosen to prepare
sample for ftirther study
1233 Air Stripping Precipitated fUtered groundwater was aerated at 3 different air to
water ratios to evaluate the effectiveness of air stripping for the removal of volatUe organic
compounds in the groundwater Tables 1-12 and 1-13 shows the analytical results for
groundwater samples obtained from weUs MW-IA and ME-8 respectively No volatUe
organic compounds were detected in samples that were aerated at a 501 air to water ratio
Aeration of precipitated filtered groundwater obtained from weU ME-8 removed aU of the
vinyl chloride at an air to water ratio of 251
1234 Carbon Adsorption The effectiveness of carbon adsorption for the removal of
organic compounds in the groundwater was evaluated The analytical results are presented in
Table 1-14 At the lowest carbon dosage only 1 xg1 of cis-12-dichloroethene and
2 xg1 of trichloroethene remained No site-related volatUe organic compounds were detected
in samples which were treated with higher doses of carbon Toluene and
dibromochloromethane were detected in sample C-4 however these two compounds were
not detected in the raw groundwater and must therefore be a result of lab contamination
24 c
c TABLE 1-12 FULL SCALE TREATABILITY STUDY AIR STRIPPING RESULTS IN ugL FOR WELL MWIA
Methylene Chloride 10 u 4 U 5 U 5 U 4 U 4 U 2 U 4 U
cis-12-Dichloroethene 200 D 1 U 1 06 J 06 J 1 U 1 U 1 U
Chloroform 4 J 1 U 1 U 1 U 1 U 12 J 1 U 1 U
12-Dichloroethane 10 U 2 1 u 1 U 1 U 1 U 1 U 03 J
Carbon Tetrachloride 10 u 1 U 1 u 1 U 1 U 1 U 1 U 01 J
Trichloroethene 860 D 1 U 2 06 J 06 J 02 J 1 U 1 U
Toluene 10 U 020 J 1 U 1 U 1 U 007 J 25 1 U
Dibromochloromethane 10 U 1 U 1 U 1 U 1 U 1 U 14 1 U
Chlorobenzene 5 J 1 U 1 U 1 U 1 U 1 U 1 U 1 U
Ethylbenzene 10 U 1 U 1 U 1 U 1 U 1 U 1 U 1 U
Total Xylenes 1 J 1 U 1 U 1 U I U 1 U 1 U 1 U
Styrene 10 U 1 U 1 u 1 U 1 U 1 U 09 J 1 U
124-Trichloroben2ene 2400 D 4 1 u 1 U 1 U 1 U 1 U 1 U
123-Trichloroben2ene NA 5 1 u 1 U 1 U 1 U 1 U 1 U ^
SEMIVOLATILE ORG ANICS
Diethylphthalate 10 U 2 J 10 u 10 U 10 u Di-n-butylphthalate 10 U 1 J 10 u 10 U 10 u
Bis(2-ethylhexyl)phthal ate 10 U 10 U 10 u 4 J 2 J
Notes
Only volatile and semivolatile organics detected in any sample are included
No PCBs were detected in any effluent sample at a detection limit of 01 ugL influent was 36 J ugL
C-ID = Duplicate of C-1
U = Undetected at specified detection limit
J = Estimated value due to validation criteria
D = Duplicate
NA = Not Analyzed
= Value is for total 12-Dichlorocthene
i| f|iiiiiiiiiiiiiii^ti8ili| WSk
3 U 2 u 8 U
1 U 1 u 1 U
1 U 1 u 1 U
04 J 1 U 1 U
1 U 1 u 1 U
03 J 008 J 1 U
1 U 1 u 1 U
1 U 1 u 1 U
02 J 1 U 1 U
005 J 1 U 1 U
02 J OI J 1 u 1 U 1 U 1 u 1 U 1 U 1 u 1 U 1 U 1 u
10 U
10 u
2 J
27
c
The effectiveness of combining aeration and carbon adsorption to remove organic c contaminants was also investigated These results are also summarized in Table 1-15 No
organic compounds were detected m any of the samples generated during this investigation
124 Conclusions The results of the groundwater treatability study demonstrate that
treatment consisting of precipitation fUtration air stripping with vapor phase controls and
carbon adsorption appear able to meet cleanup levels estabUshed for the site Figure 1-3 is a
schematic representation of the proposed system The ROD stipulates that treated
groundwater wUl be reinjected to the aquifer onsite in this case MCLs are the cleanup
levels An altemative to be evaluated is discharging the treated groundwater to a surface
water body either Meadow Brook or the Neponset River In this case cleanup levels are
estabUshed as effluent discharge levels Effluent discharge levels are calculated by
multiplying the ambient water quaUty criteria (AWQC) values for each compound by a
dUution factor The dUution factor for the Neponset River is based on a 100-gpm treatment
discharge rate and a Neponset River 7010 of 2020 gpm The dUution factor for Meadow
Brook is 1 since the treatment discharge rate is greater than the flow of the brook therefore
effluent discharge levels for Meadow Brook are set at AWQC
Tables 1-16 through 1-19 compare effluent discharge levels for both the Neponset River and
Meadow Brook to carbon adsorption effluent from the groundwater treatability study
Table 1-16 summarizes the concentration of metals in untreated groundwater the metals
concentrations remaining foUowing precipitation and filtration the metals concentration
foUowing aeration and carbon adsorption the metals concentrations foUowing caition
adsorption only the MCLs and the effluent discharge levels based on discharge to the
Neponset River The only metal effluent concentration which exceeds the MCLs is
aluminum the MCL for aluminum however is a secondary MCL which is nonenforceable
No metals concentrations in the effluent exceed any of the effluent discharge levels
n 28
c TABLE 1-15 FULL-SCALE TREATABILITY STUDY AERATION AND CARBON ADSORPTION RESULTS Results in ugL
iiiiii|Mpt-HiiDiiii-iiiiii^iiiiiiiiiiii iii bullbullbull^(6-^1 iiiiii-iiiiiiiii iiiiiiiiii^g-2iiiiiiiiiii|i
l | | | ibyNigtii i i i i | i i i i i i i | ivi
VOLATILE ORGANICS
Mediylene Chloride 6 U 4 U Carbon Tetrachloride 1 U 01 J Toluene 02 J 1 u Total Xylenes 1 U 1 u Acetone 5 U 5 U 2-Butanone 5 U 5 U 2-Hexanone 5 U 5 U 4-Methy 1-2-pentanone 5 U 5 U Carbon Disulfide 1 U 1 U
c Notes Only volatile organics detected in any sample are included U = undetected at specified detection limit J = value is estimated due to validation criteria
iiiiiA61iiiiiiiiiiiii
3 U 1 U
02 J 01 J
5 U 5 J 5 U
5 U 1 U
i|AGii[ijiiifii
3 U U
01 J 1 U 5 U 5 U 5 U 5 U 1 U
i^^^iiiiiic|ii[|ili
10
1 u 1 u 1 u 5 U 5 J
5 U 5 U 1 U
29
c
o o o
o
Gas Phase GAC or Catalytic Oxidation
To ^ Ambient
Air
To Groundwater Recharge or
Raw Treated ) Neponset River Groundwater Groundwater Influent Holding Tank J
Solids for Offsite Disposal
(NOTE Air stripper not necessary if discharge to Neponset)
FIGURE 1-3 PROPOSED GROUNDWATER TREATMENT SYSTEM SCHEMATIC
2483JP
o n o TABLE 1-16 COMPARISON OF INORGANIC FULL-SCALE TREATABILITY STUDY RESULTS TO MCLS AND DISCHARGE LEVELS
[i^i^^^^ iiiiiiijiMf|iilaquo4 Precipitation Aeration and Carbon AdsorpUoi iiiiiiiiiiiiiiiiiiiiiiritliiiiin
iiiii iiSiiii|iiiiiiiiiiiiiiiii and Filtration M^ Iiiiiiiiiiiiii iiiiiiiii|iiii|i|iiiiiiiiiii liiiijlliiiii
iiiiiiiiiiiiiiiiiiiii iiiiiiiiiiiiii i i i i i i i|ii||iiiiiiiiiiiiiiiiiiiiiiiii iiiiiiiiiiiiiiiilii Giliii iiiii ii iiiii i iiiic iD|i laquoi|iiiiiiii iiiiitiiiiciiiiiiiiiiiii
Discharge levels calculated by multiplying AWQC by a dilution factor based on a 100 gpm treatment discharge rate and a Neponset River 7Q10 of 2020 gpm
U = Undetected at specified detection limit
J = Estimated value due to validation criteria
NC = No criteria exists for the compound
P = Proposed MCL
S = Secondary MCL
n n o TABLE 1-17 COMPARISON OF INORGANIC FULL-SCALE TREATABILITY STUDY RESULTS TO MCLS AND DISCHARGE LEVELS
DISCHARGE TO MEADOW BROOK
[isjiiiiiiiiiiiiiiii-ii |iiiiiiiiiiiiiiiiiiiiiiiiiiiiiiiiiiiiiiiiiiiiiii iiiiiiiiiiiiiiiiiiiiiiiiiiiiii iiiiiiiiiiiiiiiiiiiiiiii- iiiiiiiiiiiiiiiiiiiiiiiiiiiiiiiiii ^iiiiiiiiiiiiiiiiiiiiiiiiiiiiiiiiii bull immMmii^^ F- piiiipiiiiil i i i i i i i i i i i AcraUon and Caibon AdsorpUon iii iii iiii i i i i l l l i i i i i i ^ ^ i p t ^ sectffllM^ ^ ^
Ajumin iw u i 358 bull490 z ii 240 i--lJi iiiiiiiiiiiJ^3iiitJi i i iii i3 lliiiiiiiiii iiii|ii]^(Ciiiiiiiiiii-iii-iiiiiiii5iiiii-iiiiiiiiNC^ Antimony 2i ij NA 44 U i44 U 44 U 44 U 44 U 10 P 88 30 8600
Ariseiaic- iiiiiiiiiiiiiiiiiiiiii8iiiiiiiiiiiiiii iiiiiiiiii-iis- - iiiiiiiiii- 1 u 71 J i-iiiiiy3|ili-uj - i i i 9 l i j i iii--5Qiiiiiiiiiiiiii iiiiii NC- NC - iL | Barium 247 32 106 U 65 U 597 49 U 131 IJ 2006 NC NC NC
Blaquoay|Hiiraquosi-- bullbullbull--bull i-iiiii-iiiiii3iiiiiiliiiiiiii -iiiiiiiiiiiNAi-iiiiiii I u -- 1 U iiiiiiiiiliilliiiiii-ii|iyi- iiiii iiiiiiiiiiiiiiiiii ii|i|40 - 53-bullbull13|shyCadmium ( S i u bull bull bull bull bull bull bull bull bull N A 4 UJ 4 UJ bullr^^ 4UJ 4UJ 5 682 038 170 Cai lc turn i bull- iiiiii3PiOCfiii iiiiiiiiiiii iiiiiiiiii^iiiiiiiiiiiiii 9650 i 8360 iiii7886iiiiiiiiiiiiiiiiiiiiiiii^iiiiiiii-ii6^^ iiiiii5isNltiiiiiiiiiiiiiiiiiii iiiiiiNC NGi NC Chromium 315 NA 8 J 7 UJ 7 u j 7 uj 7 iirj 160 16 11 3206
CO i-iii-iiii 33iitiii-iiiiii ii-iiiii-i-Jfiiiiii--iiii - bull bull 4 U Z 4 U- iiiiiiiiiiiiiilii-uiiiiiiiiiiiiiiiiiiiiiii4iitjiii-iiiiiiiiiii4 iiiiii-ii Nltiiiiiiiiiiiiiiiiiiiiii i l i iNc-- -NCi^-NCi
P ^ i bull bull Copper 6 4 i NA 128 U 179 U bull64Uj 9 U --256--u-- 1300 48 36 NC
Jtaa- iiiiiiiiiiii ltJOlt iiiiiiiiiii isiiiiiiiJQiii-i - z 6AS U ii232U-^^ bulliiiiiiiiiiiiiiiiiiiiuiiiiiiiiiiiiiiiiiiiiiiiiiiiiiiiiiii2 ipit|iiiiii iiiiii3pQiiiiJiiiilii liiiNC- v 1000- bull- NCi head 253 5^U^ 35 U 46 U 21 U 12 U J 2^4 u 14 054 NCis |Magnlaquoaiuiai iiiiiiiiiiilaquo)6iiiiiiiiiiiii iiiiiiiiiiii|lS)6iiiiiiiiiiiiii 3700 7060i V^ bulliiiMiiiiiiiiiiiiiiiiiii3Jpiiiiiii7^0iiiii^^^ i iiigtKSiiiiiiiiiiiiiiii bulliii I N C bull N C Ncjii Manganese 4810 bull356 62 U 18 UJ 23 U 35 U 53 U 56 S NC NC 106
Wtercuryi iiiiiiiiiiiiiiiiiiiiiiiiyiiiMiiiiiii iiiiiiiiiiiiiiiiiNAiiiiiii i P-2 U bullbull 0 2 U-- iiiiiiiiiiiiiiiiOi|iiittiiiiiii|iiiii 6iiiiit|iiiiiiiiiiiiiQ|iit|iiiiii iiiii|i|iiiiiiiiiii iiii|iii24- -- oon --0i|i Nickel 281 isrA 181 UJ 244 UJ 269 uil 17 U 356 il 166 P 643 33 3800
Potraquoslaquolum -iiiiiiiiiii4liS0iiiiiiiiii iiiiiiiiiiiii PPQiiiiU i 2200 U i ii 2620 XT | |i |owiiyiiiiii | |(^iiiiiiiiiii^ iiiiiiiiiiiiiiiW|iiiiiiiiiiiiii iii iii|ip--i NC- bullbullbull-KCii Selenium 20 U NA 32 U 13 UJ 1 6 u 1 UJ i u 5 6 266 50 6800 Sflycri i-i- iiiiiiiiiiiiiiiiiiiiiiiiiiiiiiiiiiiiiii iiiiiiiiiiiiiiiiiii iiii- i-4U bull -^M- U iii bull i i i i | | i | | i i i i |-i i | i | l | i i i i | i i i i iiiii-i ^66iiiiiiiiiiiiiii i|iP37 -0i2iNi Sodium 1 2 3 6 6 6 9 5 5 6 6 99000 lOlOOO 99866 106066 74566 NC NC NC NC
I m iiiiiiiiiiiiiiiiiiiiii||jriiiiii||iii|i|iii|| | ii46Q ^40- -bull-3iThaUJiiiitt - iiiiiiiiiiiiiiiiiiiiiiiiiiliiiiiiiiii iiiiiiiiiiiiiiNAii- I UJ ^ iiiiiiiiiiiiiiiiii Vanadium 439 NA 5 U 83 UJ 5 U 5 IJ 0 IJJ NC NC NC NC
Ziiicii^ iiiiiiii-iiiii- 488iiiiiiiiiiiiii iiiiiiiiiiii6iiu 151 U 67 UJ iiiii iiiiiiiiiiiiiiiil52iU- iiiiiiiii2 liiiiiiiiiii iiJiOQ()ii- Siiiiiiii iiiiiiiiii|6 bull bull33 - N C i
Notes
Discharge levels are AWQC (10-5 risk) since the treatment discharge rate of 100 gpm is higher than the flowrate of Meadow Brook
U = Undetected at specified detection limit
J = Estimated value due to validation criteria
NC = No criteria eus ts for the compound
P = Proposed MCL
S = Secondary MCL
o n o TABLE 1-18 COMPARISON OF ORGANIC FULL-SCALE TREATABILITY STUDY RESULTS TO MCLS AND DISCHARGE LEVELS - DISCHARGE TO THE NEPONSET RIVER
||x|o | bull iiii||i||il|A iiiiii iiiiiiiiliiiiiiiiiiili ii5iiPo|laquo|o|i iii||l|i|i||ii||y E^ly1 C DoteslOO ii i^i|raquoiiipltii=(iiiii|iii iiii i i w i M w iiiiiiilliHiJLYiiii iiiiWiiiiii iiiiiiiiiiiiii ii iiiiiiiiiiiiiiiiiiii iiiiii iiii iiiiiiiiiii iiiiiiiiiiiiiiiiii iiiiiiiiiililiiiiiiiiiliiiiii bulliiiiii lagaiiiiiiiii iiiiiiiiiiiiiiiiiiiiiiiiiiiiiiiii (ugL) iiiiiiii^iiiiiiiiii iiiiiiiiiiiiipiiiii iiUiiiiiii^ WmnKiiiiiii i(iiiiiiii i iii iiiiiiiiiiMiiiiii VOLATILE ORGANICS
112-Trichlorocthane 5 J 25 U 1 u 1 u 1 U 1 u 1 u 5 NC NC 8904
1122-TetrachIororthane 16 J 25 U 1 u I u I U 1 u 1 u NC NC 50880 2332
Chloroform 4 J 25 U 1 u 1 u 1 U I u 1 u NC 612680 26288 3328
Vinyl Chloride 10 U 50 U I u 1 u 1 u 1 u 1 u 2 NC NC 111300
11-DichIoroethene 10 U 25 U 1 u 1 u 1 u I u 1 u 7 245920 0 403
12-Dichloroethene (total) 200 D 97 1 u 1 u 1 u 1 u 1 70 245920 NC 29680000
Trichloroethene 860 D 430 1 u I u 1 u 1 u 2 5 954000 464280 19504
Tetrachloroethene 5 J 25 U 1 u I u 1 u 1 u 1 u 5 111936 17808 1876
Xylenes (total) 1 J 25 U 1 u 1 u 01 J 1 u I u lOOOO NC NC NC
Chlorobenzene 5 J 25 U 1 u 1 u 1 u 1 u I U NC NC NC NC
SEMIVOLATILE ORGANICS
Pentachlorophenol 25 U ND 25 U 25 U 25 U 25 U 25 U I 424 276 NC
Chlorobenzenes(total) 5300 1060 NC
13-Dichlorobenzene 3 J 2 10 U 10 U 10 U 10 U 10 U 600 NC NC 55120
14-Dichlorobenzene 17 9 10 U 10 U 10 U 10 U 10 U 75 NC NC 55120
12-Dichlorobciizcne 7 J 5 10 U 10 U 10 U 10 U 10 U 600 NC NC 360400
124-Trichlorobenzene 2400 D 50 10 u 10 u 10 U 10 u 10 U 9 5300 1060 NC
PESTICIDESPCBS
Arocloi-1254 36 J 32 NA 01 u NA OI u NA 05 42 03 01
Heptachlor 0074 J NA NA NA NA NA NA 04 11 01 01
Aldrin 017 J NA NA NA NA NA NA NC 64 NC 002
Heptachlor Epoxide 0045 J NA NA NA NA NA NA 02 NC NC NC
gamma-Chlordane 0056 J NA NA NA NA NA NA 2 51 OI 01
Notes
Discharge levels calculated by multiplying AWQC (10-S risk) by a dilution factor based on a 100 gpm treatment discharge rate and a Neponset River 7Q10 of 2020 gpm
Compounds presented are only those detected in the untreated groundwater sample
NA = Not analyzed J = Estimated value due to validation criteria
NC = No criteria exists for the compound D = The reported value is from the diluted analysis
U = Undetected at specified detection limit P = Proposed MCL
o n o TABLE 1-19 COMPARISON OF ORGANIC FULL-SCALE TREATABILITY STUDY RESULTS TO MCLS AND DISCHARGE LEVELS - DISCHARGE TO MEADOW BROOK
i 1 liiiisisi i ii iii iii|i|i i l i 11 i |ii^^ i i i i i i i i iiiiiiiiiiiiiiiiii iiiiiiiiiiiiieiciidiiiiii iiiiiiiiiiiiii iiiiiliiiiiii^^iiiiii iiiiiiiiiiiiiiiiiiii iiliiiii i iiiiipiiiliiiiiiiliiii iiiiiiiiiiiiiiiiii iiiii|iii|i|i-iiiiii iiAVQiii|iiiii i ii-iiiiiiigt-iiii ^^
iiiiiiiiiiiiiiii iiiiiiiiiiiiiiiiiiiiiiiiiiiiii iiiiiiiiiiiiiiiiiiiiii I i i i i i i i i||i|i|||iiiiiiiiiiiiiiii|iiii iii-|iiilaquo|i3[i|ii |||^|ii^|i|^|iii i (3 i i ^ ^ l i i illjliii^jiii^ iieip|i(iii|i iiiiiiiiiiiiiiiiiiii i^|iii|(iiiijiii|)|r^ iiii-iiliiiiiiiiiiiii ||i |illlli|i i|li|i|ii iiiiiiiiiiiiiiiiii iiiiiiiiiii|tiiiiiiiiiiiiiiiiiii iiiiiiiiiiiifiiiiiiiiii iiiiiiiiiiiiiiiiilaquoiiiiiii iiiiiiiiiiilliiiiiiiiiiiiiiii i (laquoy^ iiiiiiiiiiiii(Wiiiiiiiii iiiiiiiii i lK^ iiiiiiiiliiiiiiiiiiiiiiiii (ugl)iii iiMiiiiiii VOLATILE ORGANICS
112-Trichloroethane 5 J 25 U 1 u 1 u 1 u 1 u 1 u 5 NC NC 420
1122-Tetrachloroethane 16 J 25 U 1 u 1 u 1 u 1 u 1 u NC NC 2400 110
Chloroform 4 J 25 U 1 u 1 u 1 u I u 1 u NC 28900 1240 157
Vinyl Chloride 10 u 50 U 1 u 1 u 1 u 1 u I u 2 NC NC 5250
11-Dichloroethene 10 u 25 U 1 u 1 u 1 u I u 1 u 7 11600 NC 19
12-Dichlorocthene (total) 200 D 97 1 u I u 1 u 1 u 1 70 11600 NC 1400000
Trichloroethene 860 D 430 1 u 1 u 1 u I u 2 5 45000 21900 920
Tetrachloroethene 5 J 25 U 1 u 1 u 1 u 1 u 1 U 5 5280 840 89
Xylenes (total) 1 J 25 U 1 u 1 u 01 J I u I U 10000 NC NC NC
Chlorobenzene 5 J 25 U 1 u 1 u 1 u 1 u I u NC NC NC NC
SEMIVOLATILE ORGANICS
Pentachlorophenol 25 U ND 25 U 25 U 25 U 25 U 25 U 1 20 13 NC
Chlorobenzenes(total) 250 50 NC
13-Dichlorobcnzene 3 J 2 10 U 10 U 10 u 10 U 10 U 600 NC NC 2600
14-Dichlorobenzene 17 9 10 U 10 U 10 u 10 U 10 U 75 NC NC 2600
12-Dichlorobenzene 7 J 5 10 U 10 U 10 u 10 U 10 U 600 NC NC 17000
124-Trichlorobenzene 2400 D 50 10 u 10 u 10 u 10 u 10 U 9 250 50 NC
PESTICIDESPCBS
Aroclor-1254 36 J 32 01 u 01 u OI u OI u NA 05 20 0014 00045
Heptachlor 0074 J NA NA NA NA NA NA 04 052 00038 00029
Aldrin 017 J NA NA NA NA NA NA NC 3 NC 000079
Heptachlor Epoxide 0045 J NA NA NA NA NA NA 02 NC NC NC
gamma-Chlordane | 0056 J NA NA NA NA NA NA 2 24 00043 00048
Notes
Discharge levels are AWQC (10-5 risk) since the treatment discharge rate of 100 gpm is higher than the flowrate of Meadow Brook
Compounds presented are only those detected in the untreated groundwater sample
NA = Not analyzed J = Estimated value due to validation criteria
NC = No criteria exists for the compound D = The reported value is from the diluted analysis
U = Undetected at specified detection limit P = Proposed MCL
Table 1-17 shows a comparison of effluent to effluent discharge levels based on discharge to c Meadow Brook assuming a dilution factor on one If the treated groundwater was discharged
to Meadow Brook effluent discharge levels for arsenic would be exceeded Since arsenic is
a difficult compound to remove in a groundwater treatment plant it is concluded that
Meadow Brook may not be usable as a discharge point
Table 1-18 presents concentrations of organic contaminants in untreated groundwater from
MW-IA the precipitated and filtered effluent the effluent following both aeration and
carbon and the effluent from carbon adsorption only These values are compared to MCLs
and effluent discharge levels Only one carbon dose for the carbon only study the lowest
dose of 05 g carbon1000 ml groundwater is shown as a conservative example In both
cases using aeration and carbon and carbon alone organic contaminants were removed to
below MCLs and to below discharge levels Therefore aeration at an air-to-water ratio of
251 and a carbon dose of 05 g carbon1000 ml groundwater effectively removed volatile
organics semivolatile organics and PCBs from the groundwater
c It is expected that a maximum air-to-water ratio at 251 will be effective for an air stripper
onsite because full-scale air strippers are many times more efficient than the bench scale
models This is due to the greater surface area and turbulence found in the stripper The
off-gas from the air stripper will have to be treated to meet applicable standards either by a
catalytic oxidation unit or a vapor phase carbon adsorption system
Since no vinyl chloride was present in MW-IA and vinyl chloride is a difficult compound to
remove with carbon adsorption tests were performed with groundwater from ME-8 which
contained 210 xg1 vinyl chloride These results were presented in Table 1-13 which shows
that air stripping at an air-to-water ratio of 251 is effective in removing vinyl chloride In
order to reach the MCL of 2 figl for vinyl chloride an air stripper is required Carbon
adsorption alone would not remove vinyl chloride down to the MCL If the treated
groundwater is discharged to the Neponset River instead of being reinjected an air stripper
to remove vinyl chloride is not necessary since the discharge level is 111300 xg1
35 c
Table 1-19 shows a comparison between the organic concentrations in treatability study c effluents and effluent discharge levels based on discharge to Meadow Brook All volatile and
semivolatile organic compounds are removed to the effluent discharge levels It is
impossible to determine if PCBs were effectively removed since the most stringent discharge
level is 0014 xgL and the detection limit in the study is 01 xgL Discharge to Meadow
Brook may not be feasible due to 1) the treatability study cannot prove that PCBs are
removed to effluent discharge levels and 2) arsenic concentrations in the treated effluent
were higher than effluent discharge levels (based on a dilution factor of one)
The preliminary results of the sludge analysis indicate that the sludge is nonhazardous under
RCRA and TSCA Once the fiill scale groundwater treatment system is on line samples of
the sludge should be reanalyzed to confirm the preliminary results and to further assess the
disposal options
In summary the results of the treatability study indicate that groimdwater from the Norwood
PCB site can be treated effectively to allow discharge to either the Neponset River or r gtlaquo^ reinjection back into the aquifer If treated groundwater is reinjected the treatment plant
must include an air stripper to remove vinyl chloride If treated groundwater is discharged
to the Neponset River an air stripper is not necessary to meet discharge levels however the
use of Best Available Technology (BAT) may be required which would necessitate the
inclusion of an air stripper A cost comparison between an air stripper combined with
liquid-phase carbon versus liquid-phase carbon alone was performed and reported in the
Modeling Report The conclusion was there is not a significant difference in cost the
present worth assuming a discount factor of 8 and a 16-year period of perfonnance was
135 vs 102 million dollars (see Volume 2 Section 3) These costs will be evaluated
further during the design phase of the project The efficiracy at the full scale plant can be
optimized to ensure that at no time will the effluent from the plant exceed any applicable
groundwater or surface water standard
36 C
Section Two
c
c
20 ROCKS
21 Introduction and Objectives
There are several sources of rocks potentially contaminated with PCBs present on the Grant
Gear property portion of the Norwood PCB site Three different sources of rocks were
collected for analysis from the Grant Gear property The three rock sources included
overburden rocks from a trench west of the Grant Gear facility and below the interim
remedial cap crushed stone from the interim remedial cap west of the Grant Gear facility
and pea stone from the upper and lower roofs of the Grant Gear facility Throughout this
section rocks collected from on top of the interim remedial cap will be referred to as cap
rocks and overburden rocks wUl be referred to as trench rocks The rock collected from the
roof were analyzed under Work Plan 1 and are discussed in the Building Investigation
Report
The objective of this portion of the predesign work was threefold
bull To determine the PCB contamination if any on the different sources of rocks
bull To assess the feasibility of dry tumbling as a remedial altemative for the rocks
bull To assess the feasibility of water washing as a remedial altemative for the rocks
The dry tumblingwater washing was conducted on rocks that were reported to be too large
to be remediated with overburden soils by the solvent extraction technique
22 Description of Work
Samples of the three sources of rocks were collected by Metcalf amp Eddy personnel on
January 8-10 1992 Refer to Figure 1-1 for the locations of the trench and the cap rock
37 c
sampling points The samples were delivered to ENSECO laboratory in Cambridge
c Massachusetts and stored in a refrigerator at 4degC prior to sample preparation and analysis
Metcalf amp Eddy performed the sample preparation portion of the PCB analysis Rock
samples were weighed and gently placed in precleaned two liter glass beakers A quality
control surrogate compound was then added to each sample or method blank for subsequent
percent recovery determination The rocks were then immersed in extraction solvent
consisting of 30 percent acetone and 70 percent hexane by volume iEach sample and blank
was heated to 50degC and intermittently swirled by hand for a thirty minute extraction time
The extracts were then dried using sodium sulfate concentrated to 10 milliliters final volume
and submitted to ENSECO for PCB analysis using EPA SW846 Method 8080
The trench rocks were divided into three size categories with average diameters of one inch
two inches and three inches The rock size is an important consideration for the solvent
extraction remediation technique
^s^^ The three trench rock sizes and six cap rock samples were analyzed initially to determine the
extent of PCB contamination As outlined in the Quality Assurance Project Plan a second
portion of the cap rock sample with the highest initial PCB concentration was subjected to
water washing remediation and analyzed for PCBs Separate portions of the trench rock
samples were subjected to dry tumbling for ten and thirty minute intervals and water washing
for ten and thirty minute intervals The remediated rocks were then analyzed for PCBs
The dry tumbling and water washing were performed using an electronic rotary device The
rock samples were placed in clean two liter plastic sampling containers with screw cap
closures Laboratory distilled deionized water was poured into the water wash test
containers while the dry tumble samples had only the rocks enclosed
38 c
c 23 RESULTS
The one-inch average diameter trench rocks were initially contaminated with 1800 mgkg of
Aroclor 1254 Because the one-inch trench rocks were above the 10 mgkg cleanup standard
sample portions of the rocks were processed step by step through each of the four
remediations Although an eighty five percent reduction in PCB contamination was achieved
between the initial and final remediation samples the final concentration of 270 mgkg is still
well above the cleanup standard The results however showed a trend with the highest
concentration of PCBs detected on the initial sample lower PCB concentrations with the
ten-minute remediation and the lowest PCB concentrations achieved with the longest
thirty-minute remediation as expected The results for the one-inch trench rocks are
presented in Table 2-1
The two-inch average diameter rocks showed results similar to those of the one inch size
The initial sample had a concentration of 2500 mgkg of Aroclor 1254 The best
remediation result obtained was 450 mgkg for the ten-minute water wash sample A thirty c minute water wash sample for the two-inch trench rocks was not conducted when it became
apparent that a 10 mgkg cleanup level could not be obtained Because the 10 mgkg cleanup
level was not achievable the thirty minute water washing of two-inch rocks was not
conducted to minimize the level of effort and analytical costs The PCB result for the
thirty-minute dry screened sample 1900 mgkg Aroclor 1254 was higher than expected
This result was counter to the trend that was expected and observed with the one-inch rocks
and it demonstrates the non-homogenous nature of the rock samples This trend breaking
analytical result caused by the heterogenous or nonuniform nature of the rock sample matrix
was not repeated because the cleanup level could not be achieved The results for the
two-inch trench rock samples are presented in Table 2-1
The three-inch average diameter trench rocks yielded markedly different analytical results
The initial sample prepared with minimal on- site screening had a PCB concentration of
75 mgkg below the cleanup standard of 10 mgkg Although the initial result was below
39 c
TABLE 2-1 TRENCH ROCK WASHING RESULTS
Trench Rocks 1 inch Average Diameter
PCB Concentration
Sample mgKg
Initial sample 1800
Ten minute dry screened 620
Ten minute water wash 880
Thirty minute dry screened 290
Thirty minute water wash 270
Trench Rocks 2 inch Average Diameter
PCB Concentration
Sample mgKg
Initial sample 2500
Ten minute dry screened 490
Ten minute water wash 450
Thirty minute dry screened 1900
Trench Rocks 3 inch Average Diameter
PCB Concentration Sample mgKg
Initial sample 750
Ten min dry screened 210
Ten min water wash 025 UJ
Aroclor 1254 was the only PCB detected UJ - The sample was nondetect for PCBs to the estimated detection limit
of 025 mgKg
40
the cleanup standard it was close enough to warrant the first ten minute dry tumble c remediation step The first remediation step with a PCB concentration of 21 mgkg
confirmed that the three-inch trench rocks are less contaminated than their smaller
counterparts The three-inch ten-minute water washed sample was not submitted for fiill
quality control PCB analysis in an effort to minimize analytical costs The ten-minute water
washed sample result is from a partial quality control PCB screening analysis and is reported
as estimated Because of the lag time in tumaround of analytical results this sample had
been prepared extracted and screened and the information was available therefore it is
presented herein The results for the three inch average diameter rocks are presented in
Table 2-1
Six samples of cap rocks were collected and analyzed for PCBs AU of the results were less
than 02 mgkg or 200 xgkg For these cap rock samples an action level of 50 xgkg was
established in the Quality Assurance Project Plan The 50 xgkg value is an action level
established by EPA for this study only and is not a cleanup level identified in the ROD The
action if the results exceeded 50 igkg was to water wash the most highly PCB contaminated c sample Water washing was performed on cap rock sample number two The initial result
for this sample was 150 xgkg while the ten minute water washed sample yielded 24 igkg
Aroclor 1254 The cap rock results showed fairly consistent PCB concentrations in the range
of 50 to 150 igkg Aroclor 1254 The results are presented in Table 2-2
24 CONCLUSIONS
The cap rock samples were all determined to have PCB concentrations approximately one
hundred times less than the cleanup level of 10 mgkg Water washing conducted on the
most contaminated cap rock sample removed approximately eighty five percent of the PCBs
initially present These cap rock samples contained some fine soil like material which was
perhaps windblown carried on tmck tires or created by friction This material contributed
to the measured PCB concentrations for the cap rock samples
41 c
c TABLE 2-2 INTERIM REMEDIAL CAP ROCKS ANALYTICAL RESULTS
LOCAiSifi iiiiiiiiiiiiiii--iiiiiiiiiiiiiiiiiiiiidiiiiiiliiiiiiiii^ 10 minute Water Wash iiiii|ijii|iiii|iii^ PCB Concentration (ligKg)
1 120 NA
2 150 24
3 110 NA
4 31 U NA
5 86 NA
6 71 NA
Notes Aroclor 1254 was the only PCB detected U - Sample was nondetect for PCBs to the reported
detection limit - The highest initial PCB concentration cap rock sample was
subjected to a ten minute water wash remediation
42
C
The results of the rock tumbling and water washing demonstrate that this form of remediation r will not achieve the cleanup level of 10 mgkg for the one-inch and two-inch average
diameter overburden rocks The three inch rocks are below the cleanup level without
remediation It should be noted that these overburden rock samples were coUected from one
of the most highly contaminated areas at the site based on the remedial investigation results
These samples therefore represent worst case conditions
The dry tumbling remediation steps did not remove aU of the adhered soU particles as
anticipated This adhered highly PCB contaminated soU contributed to the measured rock
surface PCB concentration because the PCBs were extracted from the soU as weU as the rock
surface during sample preparation
The water wash remediation was effective in removing aU of the adhered soU The results
indicate that the rock surface and near surfaces have been contaminated with PCBs which
cannot be removed by water washing but are extractable with acetonehexane
c During the trench rock coUection ample one-inch and two-inch average diameter rocks were
avaUable at shaUow depths The trench had to be dug deeper to obtain the three inch size
rocks Because of the relative immobiUty of PCBs in soU the PCB concentration decreases
with depth as reported in the remedial investigation This decrease in PCB concentration
with depth is part of the explanation as to why the three inch rocks showed less
contamination than the smaUer sizes Also a factor is the surface area to mass ratio As the
mass of the rock increases the surface area to mass ratio decreases Since the PCBs are on
the surface or near surface of the rocks as the relative surface area decreases with size or
mass the reported concentration wiU decrease correspondingly
During the trench excavation and overburden rock coUection a two- to three-inch lens of
dark oUy appearing materials was observed This material was analyzed with a PCB field
screening kit and found to contain in excess of 10000 mgkg PCBs Some of the one and
two-inch diameter rocks sampled appeared dark in color Because it was not known whether
43 c
c
the dark rocks were naturaUy colored or from the tarry lens and to keep the study unbiased
these dark rocks were sampled randomly with the remaining rocks The dark appearing
rocks were estimated to comprise approximately five percent of the one and two-inch rock
sizes Inclusion of highly contaminated rocks in the samples would boost the reported PCB
concentrations
Altemative remedial measures other than rock tumbUng and water washing include detergent
and water washing organic solvent washing or steam cleaning Although preUminary
indications from the solvent extraction vendors are that only up to one inch size rocks can be
handled the possibiUty of designing a treatment system to handle larger rocks wiU be
explored during the design phase of this project If the size of the rocks precludes them
from remediation by solvent extraction along with contaminated soUds a rock cmsher wiU be
employed to reduce the contaminated rocks to a size that can be handled Although other
altematives for rock remediation might work solvent extraction with contaminated soUs or
rock cmshing foUowed by solvent extraction appear to be the easiest most cost effective
means to achieve the cleanup standards Whichever remedial altemative is selected rock
washing would only be necessary on rocks with average diameters between one and two
inches coUected from soU highly contaminated with PCBs A very rough estimate of rocks
onsite between one- and two-inch diameters is approximately 5000 tons No remediation of
the rocks is necessary if the solvent extraction technology can handle two-inch size rocks
44 c
c
EPA Contract No 68-W9-0036 EPA Work Assignment No 19-In51
Phaie I RI umpling conducted in May 1988 Phaae II RI lampling conducted in April 1989
NC bull No criteria cxitta for thia compound
(1) Inaufficient Data to Develop Criteria Value preaented ia LOEL shy Loweit Obierved Effect Level
(2) Value preaented for carelnogeiia ia the 10-5 level
(3) Value preaented ia for dichloroethenea
(4) Value preieoted ia for trana 12-dichloroetliene
(5) pH dependent criteria (78 pH uted)
(6) Value preaented ia for chlorinated benzenea
(7) Value presented ia for total PCBa
(8) Effluent DiKhaige Limit based upon an effluent discharge of 5 gpm to the Neponset River during the 7-day low flow lOyr recurrence (2O20gpm)
USGS Pleasant Street Oauging Station on the Neponset River
(9) Dilution factor =[(5gpm+2020gpm)5gpml= 405
(lO)Concentration exceeds effluent discharge limit contaminant must be removed by Groundwater Treatment Plant before discharge to surface water [D=DAILY MAX A=AVG MONTHLY F=FISH]
-
-
-
- - -
-
-
-
-
-
o n o TABLE 1-3 COMPARISON OF METAL CONTAMINATION IN GROUNDWATER WFTH EFFLUENT DISCHARGE LEVELS - DISCHARGE TO THE NEPONSET RIVER
bull bull bull bull bull bull bull bull bull bull bull bull - bull bull bull bull gt gt bull gt bull bull bull bull bull - bull bulliii|vO|| iS iggJMLnei i iaD s-UNFILTEREDgssHis M-B33nsRmmMMM D A I L Y iiiiiiiiiiiiiAVGiiiiii |i mmmmMmmm Xy lira^li P H A S E I WtiiMM liwiAiiiii iiiiimiii iii-pHiwiiliiiii WampMM P H A S E I ilii iiwgiiiiiiiiiiiiiiiii|iiiii iiiiiiiiiiiiiiiiiiiili|i| iiii iiiiii iiiiiiiiiiiiiiiiiiii M A X I M U M iiiiipifriiii^iiii iiiiiiiiiiiiifiiii iiiiiiiiiiiiiiiii
555^gt5^5V555^^^^ i i i ilaquoiij S U R F A C E m m m Wtm^itM B E D R O C K bull bull gt f t bullbullbull B E D R O C K iiiFRiiliiiiiiiiiiiii iiiiiiijsiiiiiriiiiiiiiiiiiiiiii iiii|iiiiiiliiiiiiii E F F L U E N T E F F L U E N T E F F L U E N T iiiiiiiiiiiiiiiiii wmmm |||ii||li| |i IliAiiiiil WliampiMM liiiiltiilii^isiiii liiiiifctAXliii iiiAiiiiiiiiiiiiiiiii i^i^iibhreiiiiiiiiiiliiiiiiii liiiiiii iiHiiiiiiiiiiiiii- D I S C H A R O E D I S C H A R O E D I S C H A R O E iiiii imm^mi mmmn WmMm WBrnB
PARAlt4ETER W iMmm iiiiiiiii iiitjiiiii Wi^MMM iiii iiiiiiiiilii iiiaraquoliiii W-imMMi iiiiiiaiiiii mMmmmm iCSiiMAiiiiii O O N S U M P iiiiiiiVEitiiii liiiiisyifeEiiiiiiiii iiiiiiiiiitiiiiL iiii cii^i iiiiiifl|5iili iiiiiiili (UOW iiiiiiii (oon) iiiiult3piili (UOL) lzMcii0m (UGL) iipiiiiiiiiiiiiiiiiiiiiii ii|^(Siliiiiiiiiii|iiiiii (UOL) (2) (UOL) (6)C7) (IKJL) (6)C7) (UOn) (6) C7) i^iipi
M E T A L S
A h m i n u m 154000 390000 119 352 12500 43900 74 77 NA NA NA NC NC NC
fMgtimi-^ztm zmisectmi iMiMM wmmi M^iiiiampii iiJiiM 189 iiiiiiiiiisiiiiiilaquo3iii iiiiiiiiiiiiiiiiiiiiiifii iiiiiiiiiiiliiiii^-iiiii isiiiiiiiiiiisiiiii CJiiiiiijiii iiiiiiiiiiiiiStCiiiiiii iiiiiiiiiiiiiiiiiiiiiiiiiiiiM bullsiiiii iiiiiiili5 iiiiiiiiiiiiiii|iiiiiiiiiigtireii iiiiiiii-shy bull bull bull bull bull bull bull bull bull iiiiiiliiiiiiWiii bull bull laquo raquo - iiiiiiiiiililiiiiiiiilifii iiiiiiiiiiii iii|iiiiiiiiiiiiiiii l i i i i i i i i i i^ i l l l i s i i iiiiii i-iiiiiiiSiiiiiiisiiii iiiiiiiiiiiiiiiiii|fltii- 405000 iiiiiiiiiiilliiiiiiiiwii iiiiAiiishymBmmm imampmm WmMM Wimm iiiiillili iiiiiiiiliiiiiii
Lead 43 i t3 21 168 l i 37 30 168 14 (3) 054 p) NC 5670 219 NC
iiititlj^iusibiii^j iilllJii^ -M-W^M iiiiiiii^^i^ ii-|7laquo- L5W iiiiiiiiiiiiiilliiifii iiiiiiiiiiiiiiiltiiiiiiiiiiiiliiiiii ii5iiiiiiie iiiiiiiiiiii bullbull bull l t raquo iiiiiiiiiiiiiiiNC iiiiiiii isci i i i | | i i i | | i p i i II0M^I iiiiiliiiiiiiiilii WM^MmM ilillilflil i | | | l il |o| | l i i l i P liiiiiiiiii iiiiiiiiiiiiip8iii bullbull ( U si i l i l i iiiiii- iiii-li|i5 iiiiiiiiiiiiiiiiiiii iiiiiiiiiiipiiiiiiii-iiiiiiiiiiii -i- o-iil bull iiiiiiiiiiiiiiiiiiiiiiiiiiiM iiiiiiiiiiiiii iiiii iiiiii iiii iiiiii laquoiii
|i|||ii Iliii illl|iillSI |illliSl^| illillaquoii iiiiiiiiiiiiiiiiiiii iiiiiiiiiliiltiii laquo raquo iiiiiiiiiiiii||i||| iiiiiiiiiiiiii iii|i|ltoigttiiiiiiiiiiiiiiii i iiliiiiilii iiiiiiiiiiiii bull^bull i l iNc| i-|iiiii -i-iii ii gti5 i iiiiiiiili^^ iiiiiiiiiiii Oiiiiiiii|i bulliiiiiiii Sodium 14100 28900 12500 26raquo00 16320 33200 16300 68000 N c NC NC Nc NC Nc Thal l ium 10 10 58 10 1400 (1) 40 (1) 32 567000 16200 1296
igtPiiiilli MmmmiM liilililil iiliiiiisii iii|ii| bulliiii iiiiiisiiilii iiiiiiiiiiiii|i ii^|i iiiiiiiiiil iiiiiii iiiiiiii ii^iliiiiiiiNiilliiiiiiiji- bulli|iiiiiflaquoSiiiiiiiiiiiiiiiiii iii|lNe-|i-ii iiiiiiiiiisiiiiiiiiiiiiiiii Nc iiiiiii liiNCii iiiiiii iiiiiiiilifiei iiiii iiiiiii iilaquo|||il| mmmmi m m m i M iiiiiiiili iiiiiiiiiiiiiiiiisil i iiiisiiiiilllii iiiiliiiiiiiiliiiiiiiiiitii iiiiiiiiiiiiiiiiiiiiiiiiiiifiii iiiiiiliili-|s4ii iiilliiiiiiii ssiiiiiiiiiiiiii iiiiiiii^^iii-iiiii iiiiiiiiiiiiiiiiiiiiiiiliii i iiiiiiiiiiiiiiliiiiiiii 13365 iiiiiiiliiiiiiiiiiiiip^ P b a i e I RI sampling conducted in M a y 1988 Phase II RI samplmg conducted in Apri l 1989
N C = N o cri teria exiata for th is compotmd
N A = N o t Available
(1) Insufficient Data to Develop Cri ter ia Value presented is L O E L - Lowest Observed Effect Level
(2) Value preaented for careinogena ia the 10-S level
(3) Hardness dependent c r i te r ia (25 mgA C A C 0 3 uaed)
(4) Value presented is for Ihe m o r e toxic hexavalent form
(5) Value presented is proposed (more conservat ive)
(6) Effluent Discharge L imi t dilution factor based upon an effluent discbarge of 5 gpm to the Neponse t River during the 7 - d a y low flow lOyr recurrence (2020gpm)
USOS Pleasant Street Oaug ing atation on the Neponset River
(7) Dilut ion factor =[(Sgpm+2020gpm)Sgpm]= 405
(lO)Concentration exceeds effluent discharge limit contaminant must be removed by Groundwate r Treatment Plant before discharge to Ihe Neponset River [ D = D A I L Y M A X A = A V O M O N T H L Y F=FISH]
c and 1-3 for effluent (Uscharge limits for organic and inorganic compounds An acute toxicity
test showed that no toxic effect was observed for the interim treatment discharge
114 Conclusions
Based on the results of the Phase I bench scale treatabUity study the combined unit
operations of fUtration foUowed by carbon adsorption were effective in treating the
contaminated groundwater coUected during the pumping tests for temporary discharge to the
Neponset River A sample of the discharge was coUected during the groundwater treatment
and it was found to contain less than the quantitation limit of 05 xgL of PCB The metals
concentrations were aU determined to be below the discharge criteria A sample was also
coUected and submitted for an acute toxicity determination The resuUs showed that no toxic
effect was observed The bench scale treatability results and the on-line discharge analyses
demonstrate that the filtration and carbon adsorption unit operations were effective temporary
treatment techniques
^ 12 FULL SCALE STUDY
A groundwater treatability study was conducted to evaluate the performance of four different
treatment processes on contaminated groundwater obtained from the Norwood PCB site The
contaminants present in the groundwater were determined during previous studies conducted
in May 1988 and AprU 1989 by EBASCO Chapter 1 of the Final FeasibUity Study
(EBASCO 1989c) contains an overview of the results obtained during these investigations
Based on the resuUs of the May 1988 and AprU 1989 field investigations EPA concluded
that the overburden and bedrock aquifers beneath the site were contaminated with
polychlorinated biphenyls (PCBs) and volatUe and semivolatile organic compounds (VOCs
and SVOCs) It was determined that surficial and subsurface soUs dredge pUes of sediments
taken from Meadow Brook sediments in Meadow Brook and sediments in the drainage
system of the buUding operated by Grant Gear were the sources of the contamination In
r
c September 1989 EPA released the Record of Decision (ROD) for the Norwood PCB site In
the ROD EPA directed that groundwater be treated with a system including activated carbon
air stripping with vapor controls and precipitationfiltration iEPA also directed that
treatability studies or pUot studies be conducted to aid in the overaU design of the system
In accordance with the ROD a bench scale treatabUity study was conducted at the ENSECO
Laboratory Facility in Cambridge Massachusetts by Metcalf amp Eddy personnel between
January 14 and February 16 1992 This report presents a description of the work
completed resuUs and conclusions of the study
121 Objectives
The fuU-scale groundwater treatability study was conducted to determine if treatment
consisting of precipitation fUtration air stripping and carbon adsorption would effectively
remove the contamination present in the groundwater at the Norwood PCB site to appUcable
standards Information on the percent reduction of organic and inorganic compounds in the
groundwater volume type of residual and byproducts produced by each component were
also investigated A schematic detailing the treatability study and the sampling and analysis
conducted is presented in Figure 1-1
122 Description of Work
The treatability study was performed in accordance with Pre-Design Work Plan 3 and the
QuaUty Assurance Project Plan for the Phase n Bench-Scale TreatabiUty Study (Work
Plan 3)
Groundwater samples were coUected from the Norwood PCB site for use in this
investigation Interim sampling was performed on effluent streams generated from each
bench-scale process for analysis according to Table 1-4 Influent and final effluent samples
generated during the groundwater treatabiUty were coUected and analyzed through the CLP
^
o JAR TESTING SAMPLE ID
o
POLYMER TESTING
RAW GROUNDWATER
VOL 1 SVOL I p PCB f ^ ^ METALS
mdash SST
T
T
T
SS - Choose Polymer T ar)d Dose Estimate pH pf i After Coagu lant
Jar Test 1 PH10 bull
Lime wCoag wPdymer - SS T Metals
Ume wCoag wo Polymer - SS T Metals
- NaOH wCoag wPolymer - SS T Metals
NaOH wCoag wo Polymer - SS T Metals
Jar Test 2 pH9
Jar Test 3 pH8
bull
Lime w C oag wPdymer - SS T Metals
- Lime wCoag wo Polymer - SS T Metals
- NaOH wCoag wPolymer - SS T Metals
NaOH wCoag wo Polymer - SS T Metals
- Lime wCoag wPolymer - SS T Metals
- Lime wCoag wo Polymer - SS T Metals
- NaOH wCoag wPolymer - SS T Metals
- NaOH wCoag wo Polymer - SS T Metals
JT1 -1 shy
j r i -2 shy
JT1 -3 shy
JTI-4
j r 2 - 1
JT2-2 shy
JT2-3
j r2-4 bull
JT3-1 shy
JT3-2shy
JT3-3 bull
JT3-4 shy
HLTRATION TESTING
RIter Paper 1 - SS T Time mdash |
RIter Paper 2 - SS T Time-
Rlter Paper 3 - SS T Time -
CtHXise Filter Paper or Particle Retention Size
Sample Well Using Bailer
VOL SVOL PCB CLPMETALS (PPF-1)
Precipitate and Filter Using Optimized Polymer pH Coagulant and Filter
system for volatUes semivolatUes PCBs and metals AU interim samples were analyzed at
ENSECO in Cambridge Massachusetts AU data was vaUdated by MampE according to the
QAPP
1221 Groundwater Sample CoUection Groundwater for this study was coUected from
weUs MW-IA and ME-8 as shown on Figure 1-2 iMW-lA was chosen as a sampling
location because it was determined to be one of the most contaminated weUs on-site based
on previous investigations During the course of the treatabiUty study a decision was made
to obtain samples from ME-8 because results of the most recent sampling effort conducted by
ICF indicated that groundwater from this weU contained approximately 200 xgL vinyl
chloride whereas groundwater from MW-IA no longer contained any quantifiable amount
Removal of vinyl chloride by aeration needed to be demonstrated during this investigation
because vinyl chloride is not effectively removed by carbon adsorption
Groundwater samples were obtained on four separate occasions during the study as shown in
Table 1-5 On each occasion the groundwater was coUected in accordance with the Field
Sampling Plan Three weU volumes of water were purged from the weU using a centrifiigal
pump before any samples were coUected The pH temperature and conductivity of the
purge water was measured after each weU volume untU the measured values differed by less
than 10 for three consecutive samples to ensure the sample drawn was representative of the
water in the aquifer Samples for the metals precipitation and filtration study were coUected
using a centrifugal pump Samples for the air stripping and carbon adsorption study were
coUected with a teflon baUer to minimize aeration and possible loss of volatUes during
sample coUection
The samples were coUected in one gallon amber glass bottles and stored at 4degC Each
sample bottle wasfiUed to exclude a headspace in the bottle
e 10
200 200
SCALE IN FEET
D CAP ROCK SAMPLE LOCATION
bull WELLS
nOURE 1-2 GROUNDWATER AND TRENCH AND CAP
ROCK SAMPLING LOCATIONS
11
E T C A L F a EDDY
c TABLE 1-5 GROUNDWATER SAMPLING SUMMARY
Mode of Date WeU Amount Sampled pH Temp degC Conductivity SampUng
11392 MW-IA 10 gallons 62 8deg 220 umhocm pump
12792 MW-IA 16 gaUons 62 8deg 220 umhocm baUer
20392 MW-IA 16 gallons 62 8deg 220 umhocm baUer
20592 ME-8 2 gallons 64 8deg 230 umhocm baUer
1222 Precipitation Testing
General Chemical precipitation for the removal of metals was evaluated at three pH values
and three polymer dosages to determine the effectiveness of the treatment A preliminary
evaluation of different coagulants and polymers was conducted at three pH values by
r Metcalf amp Eddy personnel and a leading polymer vendor to determine which chemicals could
potentiaUy be used to precipitate groundwater Based on the results from the preliminary
evaluation jar tests were conducted by Metcalf amp Eddy personnel to aid in the determination
of the chemical dosages required to optimize the effectiveness of precipitation
Polymer and Coagulent Testing Polymer testing was performed by Metcalf amp Eddy and a
leading polymer vendor at the ENSECO laboratory faciUty in Cambridge Massachusetts
The effectiveness of anionic cationic and nonioiuc polymer was evaluated at three pH
values The best polymer was determined to be Drewfloc 2270 a low charge anionic high
molecular weight polymer This polymer was used in jar tests 1 through 5 The best
coagulent was determined to be Charge Pack 12 (CP-12) a higher charge cationic low
molecular weight coagulent The CP-12 coagulent was used in jar tests 1 through 5
described under jar testing
12 c
InitiaUy the effects of varying the pH of the groundwater sample was investigated Tests c were conducted at pH values of 80 90 and 100 with sodium hydroxide which had the best
settling characteristics based on visual observation and turbidity measurement Each polymer
was then tested at pH = 100 to evaluate Us effectiveness under optimum pH conditions
A formula of polymer and coagulant addition was developed based on visual observations
suspended soUds and turbidity analyses performed on each sample generated during the
investigation The anionic polymer effectively flocculated the existing smaU suspended
particles and the addkion of cationic coagulant removed iron and color when the pH was
raised to 100
Jar Testing Five jar tests were performed using the polymer and coagulants determined to
be effective during preliminary testing Jar tests 1 and 4 were conducted as dupUcates at
ph 10 Jar test 2 was conducted at pH 9 jar test 3 was conducted at pH 8 and jar test 5 was
conducted at pH 10 On each occasion prior to beginning the jar test the raw groundwater
was brought tol5deg-17degCina warm water bath The temperature was held constant to c eliminate the effects of temperature on reaction rates and solubUity
The foUowing is a description of activities conducted during the jar tests fti through 4 See
Figure 1-1 for details Four samples were evaluated during each jar test For each jar test
four 15 Uter beakers were fiUed with 1 Uter of raw groundwater The beakers were placed
on the stirrer platform and the paddles were lowered into the sample The jar stirrer was
operated at 80 revolutions per minute (rpm) The pH was then adjusted to the desired value
(pH = 10 9 8 10 for Tests 1 2 3 4) with a lime slurry in two samples and with a
sodium hydroxide solution (25) in the remaining two samples Lime was added to
investigate its effects on the precipitate and to evaluate its effectiveness in pH adjustment
The cationic coagulant was then added to each sample untU the concentration in solution was
30 mgL The solution was stirred at 80 rpm for 2 minutes to ensure complete mixing The
polymer was then added to one sample pH adjusted with sodium hydroxide and one sample
pH adjusted with lime Mixing continued for two minutes Next the solution was stirred
13 c
slowly orflocculated for five minutes at 20 rpm FinaUy the solutions were aUowed to
c settle for 10 minutes Visual observations were recorded and samples were submitted for
suspended soUds turbidity and metals analyses
Jar test 5 was performed to assess the removal of manganese and aluminum by preaeration
and permanganate additions (see Figure 1-1) Because no significant benefit was observed in
the previous tests when lime was used instead of sodium hydroxide sodium hydroxide was
used to adjust the pH in aU four samples to a pH of 100 in jar test 5 Only sodium
hydroxide was added to the groundwater in the first jar to determine the removal of
manganese and aluminum attributable to the formation of an insoluble salt at high pH
Sodium hydroxide and polymer were added to the second jar to evaluate the effectiveness of
the polymer Sodium hydroxide polymer and coagulant were added to sample 4 The
supemate from sample 4 was then fUtered This was performed to determine if the required
removal efficiencies could be achieved by chemical precipitation and filtration
Permanganate was added to sample 3 in addition to sodium hydroxide coagulant and
polymer to determine if the manganese and aluminum present could be chemicaUy oxidized c to a less soluble state which would enhance the efficiency of fUtration The supemate was
then siphoned off using clean tygon tubing and a syringe into the sample containers
Samples were submitted for metals suspended soUds and turbidity as illustrated on
Figure 1-1
1223 Filtration Testing A bench-scale filtration study was perfonned to determine the
optimum pore size of filter media that could effectively remove the suspended soUds in the
precipitated groundwater The determination of the removal efficiency for each filter was
based on the concentration of suspended soUds and turbidity of the filtered water The time
required to filter the groundwater was also evaluated
Prior to filtration the metals in the groundwater were precipitated and coagulent and polymer
were added using the optimum conditions developed during the precipitation study The
optimum conditions consisted of pH adjustment to 10 with sodium hydroxide addition of
14 c
coagulent CP-12 to a concentration of one percent and addition of Drewfloc 2270 polymer to
c a concentration of 10 mgl Three grades (10 xm 5 xm and 1 xm pore sizes) of filter
paper were used with a Buchner ftmnel to filter aUquots of the precipitated groundwater
Samples of the filtered water were submitted to ENSECO for suspended soUds and turbidity
analysis
A sample of the metal hydroxide sludge was coUected during the treatability study The
sludge sample was submitted to the CLP system for PCB and metals analysis so that a
characterization of the sludge could be made and disposal options could be evaluated
1224 Air Stripping Testing Precipitated fUtered groundwater was aerated at three
different air to water ratios to determine the most effective stripping ratio To ensure that
worst case volatUe organic compound concentrations were present in the samples for this
study some modifications were made in how the sample was coUected and treated First
the groundwater was coUected with a baUer to prevent the loss of volatUes AdditionaUy the
water was fUtered under positive pressure foUowing the precipitation step to minimize the c loss of volatUes that would result if the water was filtered using a vacuum pump
An aquarium pump tygon tubing and aeration stone with a glass-fiber fUter cartridge was
used to aerate 1-Uter aUquots of precipitated and filtered groundwater The aeration flow
rate was caUbrated by filling a graduated cylinder with air that had been filled with tap water
and inverted in a water bath The air was diffused at 375 missec into 1-Uter aUquots of
groundwater and the time measured as iUustrated in Table 1-6 The aerated groundwater was
submitted to ENSECO for volatUe organics analysis
1225 Carbon Adsorption Testing The effectiveness of activated carbon for the removal
of organic compounds in the groundwater at the site was evaluated The carbon used was
the powdered activated 325 mesh carbon suppUed by Calgon Corporation The groundwater
samples used for this investigation were obtained and filtered as described in the air stripping
15 c
c
c
TABLE 1-6 AERATION TEST OPERATIONS
Air to Water Ratio Volume Volume of by Volume of Water Air Reqd Min of Aeration
251 1000 ml 25000 ml 111 501 1000 ml 50000 ml 222 751 1000 ml 75000 ml 333
section of this report to minimize the loss of volatUes A total of twelve samples were mn
during this investigation The necessity of air stripping was investigated by comparing the
resuUs from four samples that were air stripped to seven samples that were treated identicaUy
with the exception of air stripping AU samples for the air stripping comparison went
through the precipitation filtration and carbon adsorption processes AdditionaUy one
sample was prepared with no carbon added to serve as an untreated sample The samples are
summarized in Table 1-7 Each groundwater sample was prepared and mixed with a
predetermined dose of Calgon powdered 325 mesh activated carbon and placed m an open
Erlenmyer flask on a shaker table for a two-hour time period at 180 rpm A rotary shaker
table capable of accommodating twelve (12)-1000 ml Erlenmyer flasks was used Effluent
was fUtered with a barrel filter using a glass-fiber pre-fUter and a Whatman 45 micron
membrane The effluent clear and odorless in aU cases was added to sample containers
preserved and packed for shipment to CLP laboratories Since the shaker table could
accommodate 12 flasks a total of approximately 4 gaUons of effluent was generated during
each mn Several mns were performed to generate adequate quantities of sample for
analysis accordmg to Table 1-7 Groundwater was simUarly prepared for submittal to
Aquatec Lab in Burlington Vermont for chronic toxicity testing Three (3) shipments of
approximately 2 gaUons each were made
r 16
C) o o TABLE 1-7 CLP TREATABILITY STUDY SAMPLING SUMMARY
Dose g of Carbon Required of mis in gs Carbon
Sample ID 1000 ml of GW Analysis Volume mis Flasks Flasks in each
Precipitation Filtration Aeration amp Carbon
AC-1 05 V SV MET 3400 3 1067 054 AC-2 20 V SV PCB 4400 4 1100 22 AC-3 50 V SV MET 3400 3 1133 57 AC-4 100 V SV PCB 4400 4 1100 110 AC-5 Trip Blank 0 V
Precipitation Filtration amp Carbon
C-0 0 V 500 1 500 0
C-1 05 V SV MET 3200 3 1067 053
c-2 10 V PCB 2200 2 1100 11
C-3 20 V SV CT 29000 24 1250 25
C-4 50 V SV PCB 4400 4 1100 55
C-17 70 V MET 1200 1 1200 70
C-18 100 V SV 2200 2 1100 110
C-13 Treatability Blank 0 V PCB 2200 0 0 0
C-20 Trip Blank 0 V 0
C-10 Duplicate of C-1 05 SV 2000 2 1000 05
C-1 05 (MSMSD) 500 1 500 025
C-11 Duplicate of C-1 05 MET 1000 1 1000 05
C-20 Duplicate of C-2 10 V PCB (MSMSD)
4400 4 1100 11
C-16 Duplicate of C-4 50 PCB 2000 2 1000 50
C-6 0 PCB 2000 2 1000 0
17
o o n TABLE 1-7 (Continued) CLP TREATABILITY STUDY SAMPLING SUMMARY
Dose g of Carbon Required of mis in gs Carbon
Sample ID 1000 ml of GW Analysis Volume mis Flasks Flasks in each
Precipitation amp Filtration
PPF-1 V SV MET PCB 2000 2 1000 0
Sludge
Sludge-1 0 MET PCB 0
V = VolatUe organics SV = Semivolatile organics MET = Metals PCB = Polychlorinated biphenyls CT = Chronic toxicity MSMSD = Matrix spikematrix spike dup D = DupUcate TB = Trip blank PPF = Precipitated and pressure filtered
(to minimize volatUes loss as opposed to vacuum filtration)
18
c
c
123 Results
1231 Precipitation Testing
Polymer Testing Preliminary polymer and coagulant testing was conducted to determine
the type of polymer and coagulant that could be employed to treat groundwater from the site
The Drewfloc polymer and the Drew CP-12 cationic coagulant were chosen as the most
effective types InitiaUy the effect of varying the pH of the groundwater sample was
investigated The resuUs of tests conducted at pH values of 80 90 and 100 are presented
on Table 1-8 As the pH value was raised the quaUty of the floe improved The sample
raised to a pH level of 100 with sodium hydroxide exhibited the best settling characteristics
based on the color turbidity soUds and the quaUty of the floe
The effects of varying the polymer dose was then investigated at pH=100 The cationic
coagulant added to a concentration of 30 ppm after pH adjustment and prior to polymer
addition produced the clearest supemate based on color turbidity and suspended soUds
results Table 1-8 also summarizes the results from this investigation
Jar Testing Four jar tests were performed to evaluate the effectiveness of chemical
precipitation for the removal of metals in groundwater from weU MW-IA The analytical
results from the jar test are presented in Table 1-9 The greatest metal reductions occurred
when the pH was 100 Samples for which the pH was adjusted with lime showed better
removal of barium manganese and sodium concentrations than those samples for which the
pH was adjusted with sodium hydroxide Samples for which the pH was adjusted with
sodium hydroxide showed greater declines in the concentrations of calcium and magnesium
No significant effect was observed on the removal of cobalt iron lead aluminum potassium
and zinc when lime or sodium hydroxide was used to raise the pH The observation that
samples for which the pH was adjusted with sodium hydroxide had elevated concentrations of
19 c
c TABLE 1-8 PRELIMINARY POLYMER TESTING RESULTS
Description of Supemate
Procedure pH ColorSoUds
mgl Turbidity
NTU Floe SettleabUity
Varymg pH
Raw Groundwater pH adjustedNaOH pH adjustedNaOH pH adjustedNaOH
62 80 90 100
YeUowbrownYeUowbrownYeUowbrownYeUowbrown
450 gt50 gt gt 5 0 gt gt50
58 SUght mst pin floe medium
gt medium
None Slow Faster Fastest
Varying polymer dose pH adjustment wNaOH
pH adjustedno polymer
100 YeUowbrown gt gt50 gt medium Fast
Above wpolymerat 1 ppm
100 Light yeUow lt 10 35 large 18 Fast
c Polymer at 5 ppm 100
Polymer at 1 ppm 100 wcoag 30 ppm
Light yeUow
Very Ught
lt 10
lt 10 yeUow
32
30
Large 18
Targe 18
Fast
Fast
n 20
o o n TABLE 1-9 F U L L - S C A L E TREATABILITY STUDY JAR T E S T R E S U L T S
Results in mgL
SAMPLE ID iiiiiiiiiiiiiiiiiiiiMW JAiSiiii iiiJTililiiiiiiiiiiii iiiJTil^iiiiiii iiiiiiiiiiTIi3iiiiiiiii iiiii^ii^li^iiiiiiiiiiiiii^iiri^iiiiisiiiiiiiiiiiiimii iiiiiJT4^iiiiiiiiiiiiiinP4i4iiiiiiiiiii iiiiiJT2iiliiiiiiiiiiiiT2^iiiiiii |i|S^ iiiiiiiiiiiiiiiiiiiiiiiiiiiiilM ii iiiiiiiiiiiiiiiiiiiiJlt iiiiiiiiii iiiiiiiiii-iiiiiiii iiiiiiiii=iiiiiiiiiiiiiliiiiii iiiiiiiiiiiiiiiiiiiiiiliiiiiiiiiiiiiiiiiiiiiiiiiiliiiiiiiiiiiiiM ii^iiiiiiiiiiiii6iiiiiiiiiiiiiiiiiiijqiiiiii mmsectlsectMimamp0^
Zinc 0488 002 U 002 U 002 U 002 U 002 U 002 U 002 U 002 U 002 U 002 U
E S A M P L E ID iiiiiiiiiiiiiiiiiiiiJT2i3iiiiiiiiiiiiiiiii ^T2-4iiiiiiiii iiiiiiiiJ^alliiiiiiiiiiiii iii^Ta^iiiiiiiiiiii iiiiiiiiit3|3iiiiiiiiiiiii iiilT3Tr4iiiiiiiiiiiiiii rrs-i iiiiiiiiiiiiiiJTSl iiiiiiiiiiiiiii iiiiiitJiJiiiiiiiiiii iiiiiiWs-4iiiiiiiiiiiii iiiiiiiJT5r-5ii|iiiiiiii
iiiiiiiiliiiiiiiiiiiiiiiiiBSsiii iiiiiiiiiiiiiiiiiiiiiilgtHiiiiiiiiiiii iiiiiiNaOHiiiiiiii iiiiiiiiiiii)iliimiiiiiiiii iiiiiiiiSiiriiiisiiiiiiiiii iiiiiiiiNiliiiiiiiiii iiiii iNapHiiiiiiiiiiiii iiiiiiiiiiiiiiiifloiiiiiiiii iiii^iiiiiiiiiii iiiiiiii NiitQHiiiiiiiii iiiiiiiiiWftOHiiiiiiii wmm iii^iiiiiiiisiiiiiiiAli|ilii iiiiiiiiiiixiiiiiEal3i iltgtoi PolyCoag C o a g u l a n t PolyCoag Coagulant iiiiiiii iiiiiii iiiiiii)|sihyii^iiiiiiii PolyCoag PolyCoag iiiPoij^iii^il ANALYTES Aerated KMn04
Barium 0073 0072 010 010 010 010 NA NA NA NA NA Calcium 247 247 571 574 273 277 NA NA NA NA NA Cobalt 001 U 001 U 0017 0018 0017 0019 NA NA NA NA NA Iron 01 U Ol U 016 023 016 043 NA NA NA NA NA Lead 0005 U 0005 U 0005 U 0005 U 0005 U 0005 U NA NA NA NA NA Magnesium 44 44 50 51 50 50 NA NA NA NA NA Manganese 35 33 43 43 44 44 063 086 099 094 14 Potassium 5 U 5 U 5 U 5 U 5 U 5 U NA NA NA NA NA Sodium 423 477 170 169 502 508 NA NA NA NA NA Zinc 002 U 002 U 0082 011 015 016 NA NA NA NA NA
Notes Only metals detected in untreated groundwater from MWIA are presented NA = Not Analyzed
U = undetected at specified detection limit JTI = Jar Test 1
c
c
sodium in the treated water was expected This is because sodium is a component of sodium
hydroxide Similarly the elevated concentrations of calcium observed in samples for
whichthe pH was adjusted wUh lime are due to the calcium component in lime Jar test 5
was conducted to assess the effect that precipitation and chemical oxidation had on the
removal of manganese and aluminum The results of this investigation are also presented in
Table 1-9 The results indicate that greater reductions of aluminum and manganese cannot
be achieved with aeration or by the addition of a chemical oxidant such as permanganate
A sample of the metal hydroxide sludge a residual that wiU be generated during the
groundwater treatment was analyzed for metals and PCBs This sample of sludge was
generated by treating contaminated groundwater with precipitation and filtration using the
optimum treatment parameters The metals results indicate that the sludge would not be
considered hazardous under RCRA using the toxicity characteristic leaching procedure
(TCLP) A TCLP was not performed on the sludge however based on 1) the concentration
of the metals in the sludge 2) assuming a 100 leachability and 3) incoiporating a 20-fold
dUution for a soUd matrix analyzed by TCLP this sludge would not be considered hazardous
under RCRA The PCB analysis of the sludge showed that Aroclor 1254 was the only
detected PCB at a concentration of 31 mgkg The TSCA limit for PCBs in waste is
50 mgkg indicating that this sludge would not be hazardous under TSCA The results for
this sludge represent a preliminary characterization and once the fuU scale treatment system
is on line the sludge analysis wiU need further testing to confirm these preliminary results
and to make a further assessment of the disposal options The analytical resuUs for the
sludge are presented in Table 1-10
1232 FUtration Testing A bench-scale filtration study was performed to determine the
optimum particle retention grade or mesh of filter media that could effectively remove the
suspended soUds in the precipitated groundwater The results of the analysis on the fUtrate
are presented in Table 1-11
n 22
c
c
TABLE 1-10 PRECIPITATED METAL HYDROXIDE SLUDGE RESULTS Results in mgkg
i||ipiiiii|iiiiiiiiiiiiiiiii^^iiiili|ii^^^ TCLP or TSCA L i n i l t s i Tfesi-iiiiiiiiiiiiiiisiiiiii^iiiiiiSvHiij^ in Solid Matrices ii iiiiS WM3KT2S
METALS
Aluminum Antimony Arsemc Barium Beryllium
Cadmium Calcium Chromium Cobalt Copper Iron Lead Magnesium Manganese Mercury Nickel Selenium Silver Sodium Thallium Vanadium Zinc
PCBs
Aroclor 1254
41100 231 195 346 5767
9120 338
25 114
39000 694 5260 2730
03313
04
8960 08
561446
31
U U
U
J
U U U R
U U J
J
NC NC 100
2000 NC 20
NC 100 NC NC NC 100 NC NC
4 NC 20
100 NC NC NC NC
50
Notes = TCLP Limits incorporated a 1 to 20 dilution factor for solid matrices Aroclor 1254 was the only PCB detected The remaining six Aroclors
were nondetect at a quantitation limit of 36 mgkg NC = No criteria exists for this compound U = Undetected at speciiied detection limit
L J = Estimated value due to validation criteria R = The result is rejected
23
c
c
TABLE 1-11 FILTRATION STUDY RESULTS
Media Rating Speed Suspended SoUds Turbidity
Raw 45 mgl 578 Course 10 um 200 mls5 sec lt5 mgl 16 NTU Medium 5 um 200 mls7 sec lt5 mgl 19 NTU Fine 1 um 200 mls23 sec lt5 mgl 18 NTU
Since there was virtuaUy no difference in the quaUty of effluents but substantial increase in
time to filter with the fine filter paper the medium 5 micron paper was chosen to prepare
sample for ftirther study
1233 Air Stripping Precipitated fUtered groundwater was aerated at 3 different air to
water ratios to evaluate the effectiveness of air stripping for the removal of volatUe organic
compounds in the groundwater Tables 1-12 and 1-13 shows the analytical results for
groundwater samples obtained from weUs MW-IA and ME-8 respectively No volatUe
organic compounds were detected in samples that were aerated at a 501 air to water ratio
Aeration of precipitated filtered groundwater obtained from weU ME-8 removed aU of the
vinyl chloride at an air to water ratio of 251
1234 Carbon Adsorption The effectiveness of carbon adsorption for the removal of
organic compounds in the groundwater was evaluated The analytical results are presented in
Table 1-14 At the lowest carbon dosage only 1 xg1 of cis-12-dichloroethene and
2 xg1 of trichloroethene remained No site-related volatUe organic compounds were detected
in samples which were treated with higher doses of carbon Toluene and
dibromochloromethane were detected in sample C-4 however these two compounds were
not detected in the raw groundwater and must therefore be a result of lab contamination
24 c
c TABLE 1-12 FULL SCALE TREATABILITY STUDY AIR STRIPPING RESULTS IN ugL FOR WELL MWIA
Methylene Chloride 10 u 4 U 5 U 5 U 4 U 4 U 2 U 4 U
cis-12-Dichloroethene 200 D 1 U 1 06 J 06 J 1 U 1 U 1 U
Chloroform 4 J 1 U 1 U 1 U 1 U 12 J 1 U 1 U
12-Dichloroethane 10 U 2 1 u 1 U 1 U 1 U 1 U 03 J
Carbon Tetrachloride 10 u 1 U 1 u 1 U 1 U 1 U 1 U 01 J
Trichloroethene 860 D 1 U 2 06 J 06 J 02 J 1 U 1 U
Toluene 10 U 020 J 1 U 1 U 1 U 007 J 25 1 U
Dibromochloromethane 10 U 1 U 1 U 1 U 1 U 1 U 14 1 U
Chlorobenzene 5 J 1 U 1 U 1 U 1 U 1 U 1 U 1 U
Ethylbenzene 10 U 1 U 1 U 1 U 1 U 1 U 1 U 1 U
Total Xylenes 1 J 1 U 1 U 1 U I U 1 U 1 U 1 U
Styrene 10 U 1 U 1 u 1 U 1 U 1 U 09 J 1 U
124-Trichloroben2ene 2400 D 4 1 u 1 U 1 U 1 U 1 U 1 U
123-Trichloroben2ene NA 5 1 u 1 U 1 U 1 U 1 U 1 U ^
SEMIVOLATILE ORG ANICS
Diethylphthalate 10 U 2 J 10 u 10 U 10 u Di-n-butylphthalate 10 U 1 J 10 u 10 U 10 u
Bis(2-ethylhexyl)phthal ate 10 U 10 U 10 u 4 J 2 J
Notes
Only volatile and semivolatile organics detected in any sample are included
No PCBs were detected in any effluent sample at a detection limit of 01 ugL influent was 36 J ugL
C-ID = Duplicate of C-1
U = Undetected at specified detection limit
J = Estimated value due to validation criteria
D = Duplicate
NA = Not Analyzed
= Value is for total 12-Dichlorocthene
i| f|iiiiiiiiiiiiiii^ti8ili| WSk
3 U 2 u 8 U
1 U 1 u 1 U
1 U 1 u 1 U
04 J 1 U 1 U
1 U 1 u 1 U
03 J 008 J 1 U
1 U 1 u 1 U
1 U 1 u 1 U
02 J 1 U 1 U
005 J 1 U 1 U
02 J OI J 1 u 1 U 1 U 1 u 1 U 1 U 1 u 1 U 1 U 1 u
10 U
10 u
2 J
27
c
The effectiveness of combining aeration and carbon adsorption to remove organic c contaminants was also investigated These results are also summarized in Table 1-15 No
organic compounds were detected m any of the samples generated during this investigation
124 Conclusions The results of the groundwater treatability study demonstrate that
treatment consisting of precipitation fUtration air stripping with vapor phase controls and
carbon adsorption appear able to meet cleanup levels estabUshed for the site Figure 1-3 is a
schematic representation of the proposed system The ROD stipulates that treated
groundwater wUl be reinjected to the aquifer onsite in this case MCLs are the cleanup
levels An altemative to be evaluated is discharging the treated groundwater to a surface
water body either Meadow Brook or the Neponset River In this case cleanup levels are
estabUshed as effluent discharge levels Effluent discharge levels are calculated by
multiplying the ambient water quaUty criteria (AWQC) values for each compound by a
dUution factor The dUution factor for the Neponset River is based on a 100-gpm treatment
discharge rate and a Neponset River 7010 of 2020 gpm The dUution factor for Meadow
Brook is 1 since the treatment discharge rate is greater than the flow of the brook therefore
effluent discharge levels for Meadow Brook are set at AWQC
Tables 1-16 through 1-19 compare effluent discharge levels for both the Neponset River and
Meadow Brook to carbon adsorption effluent from the groundwater treatability study
Table 1-16 summarizes the concentration of metals in untreated groundwater the metals
concentrations remaining foUowing precipitation and filtration the metals concentration
foUowing aeration and carbon adsorption the metals concentrations foUowing caition
adsorption only the MCLs and the effluent discharge levels based on discharge to the
Neponset River The only metal effluent concentration which exceeds the MCLs is
aluminum the MCL for aluminum however is a secondary MCL which is nonenforceable
No metals concentrations in the effluent exceed any of the effluent discharge levels
n 28
c TABLE 1-15 FULL-SCALE TREATABILITY STUDY AERATION AND CARBON ADSORPTION RESULTS Results in ugL
iiiiii|Mpt-HiiDiiii-iiiiii^iiiiiiiiiiii iii bullbullbull^(6-^1 iiiiii-iiiiiiiii iiiiiiiiii^g-2iiiiiiiiiii|i
l | | | ibyNigtii i i i i | i i i i i i i | ivi
VOLATILE ORGANICS
Mediylene Chloride 6 U 4 U Carbon Tetrachloride 1 U 01 J Toluene 02 J 1 u Total Xylenes 1 U 1 u Acetone 5 U 5 U 2-Butanone 5 U 5 U 2-Hexanone 5 U 5 U 4-Methy 1-2-pentanone 5 U 5 U Carbon Disulfide 1 U 1 U
c Notes Only volatile organics detected in any sample are included U = undetected at specified detection limit J = value is estimated due to validation criteria
iiiiiA61iiiiiiiiiiiii
3 U 1 U
02 J 01 J
5 U 5 J 5 U
5 U 1 U
i|AGii[ijiiifii
3 U U
01 J 1 U 5 U 5 U 5 U 5 U 1 U
i^^^iiiiiic|ii[|ili
10
1 u 1 u 1 u 5 U 5 J
5 U 5 U 1 U
29
c
o o o
o
Gas Phase GAC or Catalytic Oxidation
To ^ Ambient
Air
To Groundwater Recharge or
Raw Treated ) Neponset River Groundwater Groundwater Influent Holding Tank J
Solids for Offsite Disposal
(NOTE Air stripper not necessary if discharge to Neponset)
FIGURE 1-3 PROPOSED GROUNDWATER TREATMENT SYSTEM SCHEMATIC
2483JP
o n o TABLE 1-16 COMPARISON OF INORGANIC FULL-SCALE TREATABILITY STUDY RESULTS TO MCLS AND DISCHARGE LEVELS
[i^i^^^^ iiiiiiijiMf|iilaquo4 Precipitation Aeration and Carbon AdsorpUoi iiiiiiiiiiiiiiiiiiiiiiritliiiiin
iiiii iiSiiii|iiiiiiiiiiiiiiiii and Filtration M^ Iiiiiiiiiiiiii iiiiiiiii|iiii|i|iiiiiiiiiii liiiijlliiiii
iiiiiiiiiiiiiiiiiiiii iiiiiiiiiiiiii i i i i i i i|ii||iiiiiiiiiiiiiiiiiiiiiiiii iiiiiiiiiiiiiiiilii Giliii iiiii ii iiiii i iiiic iD|i laquoi|iiiiiiii iiiiitiiiiciiiiiiiiiiiii
Discharge levels calculated by multiplying AWQC by a dilution factor based on a 100 gpm treatment discharge rate and a Neponset River 7Q10 of 2020 gpm
U = Undetected at specified detection limit
J = Estimated value due to validation criteria
NC = No criteria exists for the compound
P = Proposed MCL
S = Secondary MCL
n n o TABLE 1-17 COMPARISON OF INORGANIC FULL-SCALE TREATABILITY STUDY RESULTS TO MCLS AND DISCHARGE LEVELS
DISCHARGE TO MEADOW BROOK
[isjiiiiiiiiiiiiiiii-ii |iiiiiiiiiiiiiiiiiiiiiiiiiiiiiiiiiiiiiiiiiiiiiii iiiiiiiiiiiiiiiiiiiiiiiiiiiiii iiiiiiiiiiiiiiiiiiiiiiii- iiiiiiiiiiiiiiiiiiiiiiiiiiiiiiiiii ^iiiiiiiiiiiiiiiiiiiiiiiiiiiiiiiiii bull immMmii^^ F- piiiipiiiiil i i i i i i i i i i i AcraUon and Caibon AdsorpUon iii iii iiii i i i i l l l i i i i i i ^ ^ i p t ^ sectffllM^ ^ ^
Ajumin iw u i 358 bull490 z ii 240 i--lJi iiiiiiiiiiiJ^3iiitJi i i iii i3 lliiiiiiiiii iiii|ii]^(Ciiiiiiiiiii-iii-iiiiiiii5iiiii-iiiiiiiiNC^ Antimony 2i ij NA 44 U i44 U 44 U 44 U 44 U 10 P 88 30 8600
Ariseiaic- iiiiiiiiiiiiiiiiiiiiii8iiiiiiiiiiiiiii iiiiiiiiii-iis- - iiiiiiiiii- 1 u 71 J i-iiiiiy3|ili-uj - i i i 9 l i j i iii--5Qiiiiiiiiiiiiii iiiiii NC- NC - iL | Barium 247 32 106 U 65 U 597 49 U 131 IJ 2006 NC NC NC
Blaquoay|Hiiraquosi-- bullbullbull--bull i-iiiii-iiiiii3iiiiiiliiiiiiii -iiiiiiiiiiiNAi-iiiiiii I u -- 1 U iiiiiiiiiliilliiiiii-ii|iyi- iiiii iiiiiiiiiiiiiiiiii ii|i|40 - 53-bullbull13|shyCadmium ( S i u bull bull bull bull bull bull bull bull bull N A 4 UJ 4 UJ bullr^^ 4UJ 4UJ 5 682 038 170 Cai lc turn i bull- iiiiii3PiOCfiii iiiiiiiiiiii iiiiiiiiii^iiiiiiiiiiiiii 9650 i 8360 iiii7886iiiiiiiiiiiiiiiiiiiiiiii^iiiiiiii-ii6^^ iiiiii5isNltiiiiiiiiiiiiiiiiiii iiiiiiNC NGi NC Chromium 315 NA 8 J 7 UJ 7 u j 7 uj 7 iirj 160 16 11 3206
CO i-iii-iiii 33iitiii-iiiiii ii-iiiii-i-Jfiiiiii--iiii - bull bull 4 U Z 4 U- iiiiiiiiiiiiiilii-uiiiiiiiiiiiiiiiiiiiiiii4iitjiii-iiiiiiiiiii4 iiiiii-ii Nltiiiiiiiiiiiiiiiiiiiiii i l i iNc-- -NCi^-NCi
P ^ i bull bull Copper 6 4 i NA 128 U 179 U bull64Uj 9 U --256--u-- 1300 48 36 NC
Jtaa- iiiiiiiiiiii ltJOlt iiiiiiiiiii isiiiiiiiJQiii-i - z 6AS U ii232U-^^ bulliiiiiiiiiiiiiiiiiiiiuiiiiiiiiiiiiiiiiiiiiiiiiiiiiiiiiiii2 ipit|iiiiii iiiiii3pQiiiiJiiiilii liiiNC- v 1000- bull- NCi head 253 5^U^ 35 U 46 U 21 U 12 U J 2^4 u 14 054 NCis |Magnlaquoaiuiai iiiiiiiiiiilaquo)6iiiiiiiiiiiii iiiiiiiiiiii|lS)6iiiiiiiiiiiiii 3700 7060i V^ bulliiiMiiiiiiiiiiiiiiiiiii3Jpiiiiiii7^0iiiii^^^ i iiigtKSiiiiiiiiiiiiiiii bulliii I N C bull N C Ncjii Manganese 4810 bull356 62 U 18 UJ 23 U 35 U 53 U 56 S NC NC 106
Wtercuryi iiiiiiiiiiiiiiiiiiiiiiiiyiiiMiiiiiii iiiiiiiiiiiiiiiiiNAiiiiiii i P-2 U bullbull 0 2 U-- iiiiiiiiiiiiiiiiOi|iiittiiiiiii|iiiii 6iiiiit|iiiiiiiiiiiiiQ|iit|iiiiii iiiii|i|iiiiiiiiiii iiii|iii24- -- oon --0i|i Nickel 281 isrA 181 UJ 244 UJ 269 uil 17 U 356 il 166 P 643 33 3800
Potraquoslaquolum -iiiiiiiiiii4liS0iiiiiiiiii iiiiiiiiiiiii PPQiiiiU i 2200 U i ii 2620 XT | |i |owiiyiiiiii | |(^iiiiiiiiiii^ iiiiiiiiiiiiiiiW|iiiiiiiiiiiiii iii iii|ip--i NC- bullbullbull-KCii Selenium 20 U NA 32 U 13 UJ 1 6 u 1 UJ i u 5 6 266 50 6800 Sflycri i-i- iiiiiiiiiiiiiiiiiiiiiiiiiiiiiiiiiiiiiii iiiiiiiiiiiiiiiiiii iiii- i-4U bull -^M- U iii bull i i i i | | i | | i i i i |-i i | i | l | i i i i | i i i i iiiii-i ^66iiiiiiiiiiiiiii i|iP37 -0i2iNi Sodium 1 2 3 6 6 6 9 5 5 6 6 99000 lOlOOO 99866 106066 74566 NC NC NC NC
I m iiiiiiiiiiiiiiiiiiiiii||jriiiiii||iii|i|iii|| | ii46Q ^40- -bull-3iThaUJiiiitt - iiiiiiiiiiiiiiiiiiiiiiiiiiliiiiiiiiii iiiiiiiiiiiiiiNAii- I UJ ^ iiiiiiiiiiiiiiiiii Vanadium 439 NA 5 U 83 UJ 5 U 5 IJ 0 IJJ NC NC NC NC
Ziiicii^ iiiiiiii-iiiii- 488iiiiiiiiiiiiii iiiiiiiiiiii6iiu 151 U 67 UJ iiiii iiiiiiiiiiiiiiiil52iU- iiiiiiiii2 liiiiiiiiiii iiJiOQ()ii- Siiiiiiii iiiiiiiiii|6 bull bull33 - N C i
Notes
Discharge levels are AWQC (10-5 risk) since the treatment discharge rate of 100 gpm is higher than the flowrate of Meadow Brook
U = Undetected at specified detection limit
J = Estimated value due to validation criteria
NC = No criteria eus ts for the compound
P = Proposed MCL
S = Secondary MCL
o n o TABLE 1-18 COMPARISON OF ORGANIC FULL-SCALE TREATABILITY STUDY RESULTS TO MCLS AND DISCHARGE LEVELS - DISCHARGE TO THE NEPONSET RIVER
||x|o | bull iiii||i||il|A iiiiii iiiiiiiiliiiiiiiiiiili ii5iiPo|laquo|o|i iii||l|i|i||ii||y E^ly1 C DoteslOO ii i^i|raquoiiipltii=(iiiii|iii iiii i i w i M w iiiiiiilliHiJLYiiii iiiiWiiiiii iiiiiiiiiiiiii ii iiiiiiiiiiiiiiiiiiii iiiiii iiii iiiiiiiiiii iiiiiiiiiiiiiiiiii iiiiiiiiiililiiiiiiiiiliiiiii bulliiiiii lagaiiiiiiiii iiiiiiiiiiiiiiiiiiiiiiiiiiiiiiiii (ugL) iiiiiiii^iiiiiiiiii iiiiiiiiiiiiipiiiii iiUiiiiiii^ WmnKiiiiiii i(iiiiiiii i iii iiiiiiiiiiMiiiiii VOLATILE ORGANICS
112-Trichlorocthane 5 J 25 U 1 u 1 u 1 U 1 u 1 u 5 NC NC 8904
1122-TetrachIororthane 16 J 25 U 1 u I u I U 1 u 1 u NC NC 50880 2332
Chloroform 4 J 25 U 1 u 1 u 1 U I u 1 u NC 612680 26288 3328
Vinyl Chloride 10 U 50 U I u 1 u 1 u 1 u 1 u 2 NC NC 111300
11-DichIoroethene 10 U 25 U 1 u 1 u 1 u I u 1 u 7 245920 0 403
12-Dichloroethene (total) 200 D 97 1 u 1 u 1 u 1 u 1 70 245920 NC 29680000
Trichloroethene 860 D 430 1 u I u 1 u 1 u 2 5 954000 464280 19504
Tetrachloroethene 5 J 25 U 1 u I u 1 u 1 u 1 u 5 111936 17808 1876
Xylenes (total) 1 J 25 U 1 u 1 u 01 J 1 u I u lOOOO NC NC NC
Chlorobenzene 5 J 25 U 1 u 1 u 1 u 1 u I U NC NC NC NC
SEMIVOLATILE ORGANICS
Pentachlorophenol 25 U ND 25 U 25 U 25 U 25 U 25 U I 424 276 NC
Chlorobenzenes(total) 5300 1060 NC
13-Dichlorobenzene 3 J 2 10 U 10 U 10 U 10 U 10 U 600 NC NC 55120
14-Dichlorobenzene 17 9 10 U 10 U 10 U 10 U 10 U 75 NC NC 55120
12-Dichlorobciizcne 7 J 5 10 U 10 U 10 U 10 U 10 U 600 NC NC 360400
124-Trichlorobenzene 2400 D 50 10 u 10 u 10 U 10 u 10 U 9 5300 1060 NC
PESTICIDESPCBS
Arocloi-1254 36 J 32 NA 01 u NA OI u NA 05 42 03 01
Heptachlor 0074 J NA NA NA NA NA NA 04 11 01 01
Aldrin 017 J NA NA NA NA NA NA NC 64 NC 002
Heptachlor Epoxide 0045 J NA NA NA NA NA NA 02 NC NC NC
gamma-Chlordane 0056 J NA NA NA NA NA NA 2 51 OI 01
Notes
Discharge levels calculated by multiplying AWQC (10-S risk) by a dilution factor based on a 100 gpm treatment discharge rate and a Neponset River 7Q10 of 2020 gpm
Compounds presented are only those detected in the untreated groundwater sample
NA = Not analyzed J = Estimated value due to validation criteria
NC = No criteria exists for the compound D = The reported value is from the diluted analysis
U = Undetected at specified detection limit P = Proposed MCL
o n o TABLE 1-19 COMPARISON OF ORGANIC FULL-SCALE TREATABILITY STUDY RESULTS TO MCLS AND DISCHARGE LEVELS - DISCHARGE TO MEADOW BROOK
i 1 liiiisisi i ii iii iii|i|i i l i 11 i |ii^^ i i i i i i i i iiiiiiiiiiiiiiiiii iiiiiiiiiiiiieiciidiiiiii iiiiiiiiiiiiii iiiiiliiiiiii^^iiiiii iiiiiiiiiiiiiiiiiiii iiliiiii i iiiiipiiiliiiiiiiliiii iiiiiiiiiiiiiiiiii iiiii|iii|i|i-iiiiii iiAVQiii|iiiii i ii-iiiiiiigt-iiii ^^
iiiiiiiiiiiiiiii iiiiiiiiiiiiiiiiiiiiiiiiiiiiii iiiiiiiiiiiiiiiiiiiiii I i i i i i i i i||i|i|||iiiiiiiiiiiiiiii|iiii iii-|iiilaquo|i3[i|ii |||^|ii^|i|^|iii i (3 i i ^ ^ l i i illjliii^jiii^ iieip|i(iii|i iiiiiiiiiiiiiiiiiiii i^|iii|(iiiijiii|)|r^ iiii-iiliiiiiiiiiiiii ||i |illlli|i i|li|i|ii iiiiiiiiiiiiiiiiii iiiiiiiiiii|tiiiiiiiiiiiiiiiiiii iiiiiiiiiiiifiiiiiiiiii iiiiiiiiiiiiiiiiilaquoiiiiiii iiiiiiiiiiilliiiiiiiiiiiiiiii i (laquoy^ iiiiiiiiiiiii(Wiiiiiiiii iiiiiiiii i lK^ iiiiiiiiliiiiiiiiiiiiiiiii (ugl)iii iiMiiiiiii VOLATILE ORGANICS
112-Trichloroethane 5 J 25 U 1 u 1 u 1 u 1 u 1 u 5 NC NC 420
1122-Tetrachloroethane 16 J 25 U 1 u 1 u 1 u 1 u 1 u NC NC 2400 110
Chloroform 4 J 25 U 1 u 1 u 1 u I u 1 u NC 28900 1240 157
Vinyl Chloride 10 u 50 U 1 u 1 u 1 u 1 u I u 2 NC NC 5250
11-Dichloroethene 10 u 25 U 1 u 1 u 1 u I u 1 u 7 11600 NC 19
12-Dichlorocthene (total) 200 D 97 1 u I u 1 u 1 u 1 70 11600 NC 1400000
Trichloroethene 860 D 430 1 u 1 u 1 u I u 2 5 45000 21900 920
Tetrachloroethene 5 J 25 U 1 u 1 u 1 u 1 u 1 U 5 5280 840 89
Xylenes (total) 1 J 25 U 1 u 1 u 01 J I u I U 10000 NC NC NC
Chlorobenzene 5 J 25 U 1 u 1 u 1 u 1 u I u NC NC NC NC
SEMIVOLATILE ORGANICS
Pentachlorophenol 25 U ND 25 U 25 U 25 U 25 U 25 U 1 20 13 NC
Chlorobenzenes(total) 250 50 NC
13-Dichlorobcnzene 3 J 2 10 U 10 U 10 u 10 U 10 U 600 NC NC 2600
14-Dichlorobenzene 17 9 10 U 10 U 10 u 10 U 10 U 75 NC NC 2600
12-Dichlorobenzene 7 J 5 10 U 10 U 10 u 10 U 10 U 600 NC NC 17000
124-Trichlorobenzene 2400 D 50 10 u 10 u 10 u 10 u 10 U 9 250 50 NC
PESTICIDESPCBS
Aroclor-1254 36 J 32 01 u 01 u OI u OI u NA 05 20 0014 00045
Heptachlor 0074 J NA NA NA NA NA NA 04 052 00038 00029
Aldrin 017 J NA NA NA NA NA NA NC 3 NC 000079
Heptachlor Epoxide 0045 J NA NA NA NA NA NA 02 NC NC NC
gamma-Chlordane | 0056 J NA NA NA NA NA NA 2 24 00043 00048
Notes
Discharge levels are AWQC (10-5 risk) since the treatment discharge rate of 100 gpm is higher than the flowrate of Meadow Brook
Compounds presented are only those detected in the untreated groundwater sample
NA = Not analyzed J = Estimated value due to validation criteria
NC = No criteria exists for the compound D = The reported value is from the diluted analysis
U = Undetected at specified detection limit P = Proposed MCL
Table 1-17 shows a comparison of effluent to effluent discharge levels based on discharge to c Meadow Brook assuming a dilution factor on one If the treated groundwater was discharged
to Meadow Brook effluent discharge levels for arsenic would be exceeded Since arsenic is
a difficult compound to remove in a groundwater treatment plant it is concluded that
Meadow Brook may not be usable as a discharge point
Table 1-18 presents concentrations of organic contaminants in untreated groundwater from
MW-IA the precipitated and filtered effluent the effluent following both aeration and
carbon and the effluent from carbon adsorption only These values are compared to MCLs
and effluent discharge levels Only one carbon dose for the carbon only study the lowest
dose of 05 g carbon1000 ml groundwater is shown as a conservative example In both
cases using aeration and carbon and carbon alone organic contaminants were removed to
below MCLs and to below discharge levels Therefore aeration at an air-to-water ratio of
251 and a carbon dose of 05 g carbon1000 ml groundwater effectively removed volatile
organics semivolatile organics and PCBs from the groundwater
c It is expected that a maximum air-to-water ratio at 251 will be effective for an air stripper
onsite because full-scale air strippers are many times more efficient than the bench scale
models This is due to the greater surface area and turbulence found in the stripper The
off-gas from the air stripper will have to be treated to meet applicable standards either by a
catalytic oxidation unit or a vapor phase carbon adsorption system
Since no vinyl chloride was present in MW-IA and vinyl chloride is a difficult compound to
remove with carbon adsorption tests were performed with groundwater from ME-8 which
contained 210 xg1 vinyl chloride These results were presented in Table 1-13 which shows
that air stripping at an air-to-water ratio of 251 is effective in removing vinyl chloride In
order to reach the MCL of 2 figl for vinyl chloride an air stripper is required Carbon
adsorption alone would not remove vinyl chloride down to the MCL If the treated
groundwater is discharged to the Neponset River instead of being reinjected an air stripper
to remove vinyl chloride is not necessary since the discharge level is 111300 xg1
35 c
Table 1-19 shows a comparison between the organic concentrations in treatability study c effluents and effluent discharge levels based on discharge to Meadow Brook All volatile and
semivolatile organic compounds are removed to the effluent discharge levels It is
impossible to determine if PCBs were effectively removed since the most stringent discharge
level is 0014 xgL and the detection limit in the study is 01 xgL Discharge to Meadow
Brook may not be feasible due to 1) the treatability study cannot prove that PCBs are
removed to effluent discharge levels and 2) arsenic concentrations in the treated effluent
were higher than effluent discharge levels (based on a dilution factor of one)
The preliminary results of the sludge analysis indicate that the sludge is nonhazardous under
RCRA and TSCA Once the fiill scale groundwater treatment system is on line samples of
the sludge should be reanalyzed to confirm the preliminary results and to further assess the
disposal options
In summary the results of the treatability study indicate that groimdwater from the Norwood
PCB site can be treated effectively to allow discharge to either the Neponset River or r gtlaquo^ reinjection back into the aquifer If treated groundwater is reinjected the treatment plant
must include an air stripper to remove vinyl chloride If treated groundwater is discharged
to the Neponset River an air stripper is not necessary to meet discharge levels however the
use of Best Available Technology (BAT) may be required which would necessitate the
inclusion of an air stripper A cost comparison between an air stripper combined with
liquid-phase carbon versus liquid-phase carbon alone was performed and reported in the
Modeling Report The conclusion was there is not a significant difference in cost the
present worth assuming a discount factor of 8 and a 16-year period of perfonnance was
135 vs 102 million dollars (see Volume 2 Section 3) These costs will be evaluated
further during the design phase of the project The efficiracy at the full scale plant can be
optimized to ensure that at no time will the effluent from the plant exceed any applicable
groundwater or surface water standard
36 C
Section Two
c
c
20 ROCKS
21 Introduction and Objectives
There are several sources of rocks potentially contaminated with PCBs present on the Grant
Gear property portion of the Norwood PCB site Three different sources of rocks were
collected for analysis from the Grant Gear property The three rock sources included
overburden rocks from a trench west of the Grant Gear facility and below the interim
remedial cap crushed stone from the interim remedial cap west of the Grant Gear facility
and pea stone from the upper and lower roofs of the Grant Gear facility Throughout this
section rocks collected from on top of the interim remedial cap will be referred to as cap
rocks and overburden rocks wUl be referred to as trench rocks The rock collected from the
roof were analyzed under Work Plan 1 and are discussed in the Building Investigation
Report
The objective of this portion of the predesign work was threefold
bull To determine the PCB contamination if any on the different sources of rocks
bull To assess the feasibility of dry tumbling as a remedial altemative for the rocks
bull To assess the feasibility of water washing as a remedial altemative for the rocks
The dry tumblingwater washing was conducted on rocks that were reported to be too large
to be remediated with overburden soils by the solvent extraction technique
22 Description of Work
Samples of the three sources of rocks were collected by Metcalf amp Eddy personnel on
January 8-10 1992 Refer to Figure 1-1 for the locations of the trench and the cap rock
37 c
sampling points The samples were delivered to ENSECO laboratory in Cambridge
c Massachusetts and stored in a refrigerator at 4degC prior to sample preparation and analysis
Metcalf amp Eddy performed the sample preparation portion of the PCB analysis Rock
samples were weighed and gently placed in precleaned two liter glass beakers A quality
control surrogate compound was then added to each sample or method blank for subsequent
percent recovery determination The rocks were then immersed in extraction solvent
consisting of 30 percent acetone and 70 percent hexane by volume iEach sample and blank
was heated to 50degC and intermittently swirled by hand for a thirty minute extraction time
The extracts were then dried using sodium sulfate concentrated to 10 milliliters final volume
and submitted to ENSECO for PCB analysis using EPA SW846 Method 8080
The trench rocks were divided into three size categories with average diameters of one inch
two inches and three inches The rock size is an important consideration for the solvent
extraction remediation technique
^s^^ The three trench rock sizes and six cap rock samples were analyzed initially to determine the
extent of PCB contamination As outlined in the Quality Assurance Project Plan a second
portion of the cap rock sample with the highest initial PCB concentration was subjected to
water washing remediation and analyzed for PCBs Separate portions of the trench rock
samples were subjected to dry tumbling for ten and thirty minute intervals and water washing
for ten and thirty minute intervals The remediated rocks were then analyzed for PCBs
The dry tumbling and water washing were performed using an electronic rotary device The
rock samples were placed in clean two liter plastic sampling containers with screw cap
closures Laboratory distilled deionized water was poured into the water wash test
containers while the dry tumble samples had only the rocks enclosed
38 c
c 23 RESULTS
The one-inch average diameter trench rocks were initially contaminated with 1800 mgkg of
Aroclor 1254 Because the one-inch trench rocks were above the 10 mgkg cleanup standard
sample portions of the rocks were processed step by step through each of the four
remediations Although an eighty five percent reduction in PCB contamination was achieved
between the initial and final remediation samples the final concentration of 270 mgkg is still
well above the cleanup standard The results however showed a trend with the highest
concentration of PCBs detected on the initial sample lower PCB concentrations with the
ten-minute remediation and the lowest PCB concentrations achieved with the longest
thirty-minute remediation as expected The results for the one-inch trench rocks are
presented in Table 2-1
The two-inch average diameter rocks showed results similar to those of the one inch size
The initial sample had a concentration of 2500 mgkg of Aroclor 1254 The best
remediation result obtained was 450 mgkg for the ten-minute water wash sample A thirty c minute water wash sample for the two-inch trench rocks was not conducted when it became
apparent that a 10 mgkg cleanup level could not be obtained Because the 10 mgkg cleanup
level was not achievable the thirty minute water washing of two-inch rocks was not
conducted to minimize the level of effort and analytical costs The PCB result for the
thirty-minute dry screened sample 1900 mgkg Aroclor 1254 was higher than expected
This result was counter to the trend that was expected and observed with the one-inch rocks
and it demonstrates the non-homogenous nature of the rock samples This trend breaking
analytical result caused by the heterogenous or nonuniform nature of the rock sample matrix
was not repeated because the cleanup level could not be achieved The results for the
two-inch trench rock samples are presented in Table 2-1
The three-inch average diameter trench rocks yielded markedly different analytical results
The initial sample prepared with minimal on- site screening had a PCB concentration of
75 mgkg below the cleanup standard of 10 mgkg Although the initial result was below
39 c
TABLE 2-1 TRENCH ROCK WASHING RESULTS
Trench Rocks 1 inch Average Diameter
PCB Concentration
Sample mgKg
Initial sample 1800
Ten minute dry screened 620
Ten minute water wash 880
Thirty minute dry screened 290
Thirty minute water wash 270
Trench Rocks 2 inch Average Diameter
PCB Concentration
Sample mgKg
Initial sample 2500
Ten minute dry screened 490
Ten minute water wash 450
Thirty minute dry screened 1900
Trench Rocks 3 inch Average Diameter
PCB Concentration Sample mgKg
Initial sample 750
Ten min dry screened 210
Ten min water wash 025 UJ
Aroclor 1254 was the only PCB detected UJ - The sample was nondetect for PCBs to the estimated detection limit
of 025 mgKg
40
the cleanup standard it was close enough to warrant the first ten minute dry tumble c remediation step The first remediation step with a PCB concentration of 21 mgkg
confirmed that the three-inch trench rocks are less contaminated than their smaller
counterparts The three-inch ten-minute water washed sample was not submitted for fiill
quality control PCB analysis in an effort to minimize analytical costs The ten-minute water
washed sample result is from a partial quality control PCB screening analysis and is reported
as estimated Because of the lag time in tumaround of analytical results this sample had
been prepared extracted and screened and the information was available therefore it is
presented herein The results for the three inch average diameter rocks are presented in
Table 2-1
Six samples of cap rocks were collected and analyzed for PCBs AU of the results were less
than 02 mgkg or 200 xgkg For these cap rock samples an action level of 50 xgkg was
established in the Quality Assurance Project Plan The 50 xgkg value is an action level
established by EPA for this study only and is not a cleanup level identified in the ROD The
action if the results exceeded 50 igkg was to water wash the most highly PCB contaminated c sample Water washing was performed on cap rock sample number two The initial result
for this sample was 150 xgkg while the ten minute water washed sample yielded 24 igkg
Aroclor 1254 The cap rock results showed fairly consistent PCB concentrations in the range
of 50 to 150 igkg Aroclor 1254 The results are presented in Table 2-2
24 CONCLUSIONS
The cap rock samples were all determined to have PCB concentrations approximately one
hundred times less than the cleanup level of 10 mgkg Water washing conducted on the
most contaminated cap rock sample removed approximately eighty five percent of the PCBs
initially present These cap rock samples contained some fine soil like material which was
perhaps windblown carried on tmck tires or created by friction This material contributed
to the measured PCB concentrations for the cap rock samples
41 c
c TABLE 2-2 INTERIM REMEDIAL CAP ROCKS ANALYTICAL RESULTS
LOCAiSifi iiiiiiiiiiiiiii--iiiiiiiiiiiiiiiiiiiiidiiiiiiliiiiiiiii^ 10 minute Water Wash iiiii|ijii|iiii|iii^ PCB Concentration (ligKg)
1 120 NA
2 150 24
3 110 NA
4 31 U NA
5 86 NA
6 71 NA
Notes Aroclor 1254 was the only PCB detected U - Sample was nondetect for PCBs to the reported
detection limit - The highest initial PCB concentration cap rock sample was
subjected to a ten minute water wash remediation
42
C
The results of the rock tumbling and water washing demonstrate that this form of remediation r will not achieve the cleanup level of 10 mgkg for the one-inch and two-inch average
diameter overburden rocks The three inch rocks are below the cleanup level without
remediation It should be noted that these overburden rock samples were coUected from one
of the most highly contaminated areas at the site based on the remedial investigation results
These samples therefore represent worst case conditions
The dry tumbling remediation steps did not remove aU of the adhered soU particles as
anticipated This adhered highly PCB contaminated soU contributed to the measured rock
surface PCB concentration because the PCBs were extracted from the soU as weU as the rock
surface during sample preparation
The water wash remediation was effective in removing aU of the adhered soU The results
indicate that the rock surface and near surfaces have been contaminated with PCBs which
cannot be removed by water washing but are extractable with acetonehexane
c During the trench rock coUection ample one-inch and two-inch average diameter rocks were
avaUable at shaUow depths The trench had to be dug deeper to obtain the three inch size
rocks Because of the relative immobiUty of PCBs in soU the PCB concentration decreases
with depth as reported in the remedial investigation This decrease in PCB concentration
with depth is part of the explanation as to why the three inch rocks showed less
contamination than the smaUer sizes Also a factor is the surface area to mass ratio As the
mass of the rock increases the surface area to mass ratio decreases Since the PCBs are on
the surface or near surface of the rocks as the relative surface area decreases with size or
mass the reported concentration wiU decrease correspondingly
During the trench excavation and overburden rock coUection a two- to three-inch lens of
dark oUy appearing materials was observed This material was analyzed with a PCB field
screening kit and found to contain in excess of 10000 mgkg PCBs Some of the one and
two-inch diameter rocks sampled appeared dark in color Because it was not known whether
43 c
c
the dark rocks were naturaUy colored or from the tarry lens and to keep the study unbiased
these dark rocks were sampled randomly with the remaining rocks The dark appearing
rocks were estimated to comprise approximately five percent of the one and two-inch rock
sizes Inclusion of highly contaminated rocks in the samples would boost the reported PCB
concentrations
Altemative remedial measures other than rock tumbUng and water washing include detergent
and water washing organic solvent washing or steam cleaning Although preUminary
indications from the solvent extraction vendors are that only up to one inch size rocks can be
handled the possibiUty of designing a treatment system to handle larger rocks wiU be
explored during the design phase of this project If the size of the rocks precludes them
from remediation by solvent extraction along with contaminated soUds a rock cmsher wiU be
employed to reduce the contaminated rocks to a size that can be handled Although other
altematives for rock remediation might work solvent extraction with contaminated soUs or
rock cmshing foUowed by solvent extraction appear to be the easiest most cost effective
means to achieve the cleanup standards Whichever remedial altemative is selected rock
washing would only be necessary on rocks with average diameters between one and two
inches coUected from soU highly contaminated with PCBs A very rough estimate of rocks
onsite between one- and two-inch diameters is approximately 5000 tons No remediation of
the rocks is necessary if the solvent extraction technology can handle two-inch size rocks
44 c
c
TABLE OF CONTENTS
10 GROUNDWATER
11 Interim Study111 Introduction and Objectives112 Description of Work113 Results114 Conclusions
12 Full Scale Study121 Objectives122 Description of Work
Phaie I RI umpling conducted in May 1988 Phaae II RI lampling conducted in April 1989
NC bull No criteria cxitta for thia compound
(1) Inaufficient Data to Develop Criteria Value preaented ia LOEL shy Loweit Obierved Effect Level
(2) Value preaented for carelnogeiia ia the 10-5 level
(3) Value preaented ia for dichloroethenea
(4) Value preieoted ia for trana 12-dichloroetliene
(5) pH dependent criteria (78 pH uted)
(6) Value preaented ia for chlorinated benzenea
(7) Value presented ia for total PCBa
(8) Effluent DiKhaige Limit based upon an effluent discharge of 5 gpm to the Neponset River during the 7-day low flow lOyr recurrence (2O20gpm)
USGS Pleasant Street Oauging Station on the Neponset River
(9) Dilution factor =[(5gpm+2020gpm)5gpml= 405
(lO)Concentration exceeds effluent discharge limit contaminant must be removed by Groundwater Treatment Plant before discharge to surface water [D=DAILY MAX A=AVG MONTHLY F=FISH]
-
-
-
- - -
-
-
-
-
-
o n o TABLE 1-3 COMPARISON OF METAL CONTAMINATION IN GROUNDWATER WFTH EFFLUENT DISCHARGE LEVELS - DISCHARGE TO THE NEPONSET RIVER
bull bull bull bull bull bull bull bull bull bull bull bull - bull bull bull bull gt gt bull gt bull bull bull bull bull - bull bulliii|vO|| iS iggJMLnei i iaD s-UNFILTEREDgssHis M-B33nsRmmMMM D A I L Y iiiiiiiiiiiiiAVGiiiiii |i mmmmMmmm Xy lira^li P H A S E I WtiiMM liwiAiiiii iiiiimiii iii-pHiwiiliiiii WampMM P H A S E I ilii iiwgiiiiiiiiiiiiiiiii|iiiii iiiiiiiiiiiiiiiiiiiili|i| iiii iiiiii iiiiiiiiiiiiiiiiiiii M A X I M U M iiiiipifriiii^iiii iiiiiiiiiiiiifiiii iiiiiiiiiiiiiiiii
555^gt5^5V555^^^^ i i i ilaquoiij S U R F A C E m m m Wtm^itM B E D R O C K bull bull gt f t bullbullbull B E D R O C K iiiFRiiliiiiiiiiiiiii iiiiiiijsiiiiiriiiiiiiiiiiiiiiii iiii|iiiiiiliiiiiiii E F F L U E N T E F F L U E N T E F F L U E N T iiiiiiiiiiiiiiiiii wmmm |||ii||li| |i IliAiiiiil WliampiMM liiiiltiilii^isiiii liiiiifctAXliii iiiAiiiiiiiiiiiiiiiii i^i^iibhreiiiiiiiiiiliiiiiiii liiiiiii iiHiiiiiiiiiiiiii- D I S C H A R O E D I S C H A R O E D I S C H A R O E iiiii imm^mi mmmn WmMm WBrnB
PARAlt4ETER W iMmm iiiiiiiii iiitjiiiii Wi^MMM iiii iiiiiiiiilii iiiaraquoliiii W-imMMi iiiiiiaiiiii mMmmmm iCSiiMAiiiiii O O N S U M P iiiiiiiVEitiiii liiiiisyifeEiiiiiiiii iiiiiiiiiitiiiiL iiii cii^i iiiiiifl|5iili iiiiiiili (UOW iiiiiiii (oon) iiiiult3piili (UOL) lzMcii0m (UGL) iipiiiiiiiiiiiiiiiiiiiiii ii|^(Siliiiiiiiiii|iiiiii (UOL) (2) (UOL) (6)C7) (IKJL) (6)C7) (UOn) (6) C7) i^iipi
M E T A L S
A h m i n u m 154000 390000 119 352 12500 43900 74 77 NA NA NA NC NC NC
fMgtimi-^ztm zmisectmi iMiMM wmmi M^iiiiampii iiJiiM 189 iiiiiiiiiisiiiiiilaquo3iii iiiiiiiiiiiiiiiiiiiiiifii iiiiiiiiiiiliiiii^-iiiii isiiiiiiiiiiisiiiii CJiiiiiijiii iiiiiiiiiiiiiStCiiiiiii iiiiiiiiiiiiiiiiiiiiiiiiiiiiM bullsiiiii iiiiiiili5 iiiiiiiiiiiiiii|iiiiiiiiiigtireii iiiiiiii-shy bull bull bull bull bull bull bull bull bull iiiiiiliiiiiiWiii bull bull laquo raquo - iiiiiiiiiililiiiiiiiilifii iiiiiiiiiiii iii|iiiiiiiiiiiiiiii l i i i i i i i i i i^ i l l l i s i i iiiiii i-iiiiiiiSiiiiiiisiiii iiiiiiiiiiiiiiiiii|fltii- 405000 iiiiiiiiiiilliiiiiiiiwii iiiiAiiishymBmmm imampmm WmMM Wimm iiiiillili iiiiiiiiliiiiiii
Lead 43 i t3 21 168 l i 37 30 168 14 (3) 054 p) NC 5670 219 NC
iiititlj^iusibiii^j iilllJii^ -M-W^M iiiiiiii^^i^ ii-|7laquo- L5W iiiiiiiiiiiiiilliiifii iiiiiiiiiiiiiiiltiiiiiiiiiiiiliiiiii ii5iiiiiiie iiiiiiiiiiii bullbull bull l t raquo iiiiiiiiiiiiiiiNC iiiiiiii isci i i i | | i i i | | i p i i II0M^I iiiiiliiiiiiiiilii WM^MmM ilillilflil i | | | l il |o| | l i i l i P liiiiiiiiii iiiiiiiiiiiiip8iii bullbull ( U si i l i l i iiiiii- iiii-li|i5 iiiiiiiiiiiiiiiiiiii iiiiiiiiiiipiiiiiiii-iiiiiiiiiiii -i- o-iil bull iiiiiiiiiiiiiiiiiiiiiiiiiiiM iiiiiiiiiiiiii iiiii iiiiii iiii iiiiii laquoiii
|i|||ii Iliii illl|iillSI |illliSl^| illillaquoii iiiiiiiiiiiiiiiiiiii iiiiiiiiiliiltiii laquo raquo iiiiiiiiiiiii||i||| iiiiiiiiiiiiii iii|i|ltoigttiiiiiiiiiiiiiiii i iiliiiiilii iiiiiiiiiiiii bull^bull i l iNc| i-|iiiii -i-iii ii gti5 i iiiiiiiili^^ iiiiiiiiiiii Oiiiiiiii|i bulliiiiiiii Sodium 14100 28900 12500 26raquo00 16320 33200 16300 68000 N c NC NC Nc NC Nc Thal l ium 10 10 58 10 1400 (1) 40 (1) 32 567000 16200 1296
igtPiiiilli MmmmiM liilililil iiliiiiisii iii|ii| bulliiii iiiiiisiiilii iiiiiiiiiiiii|i ii^|i iiiiiiiiiil iiiiiii iiiiiiii ii^iliiiiiiiNiilliiiiiiiji- bulli|iiiiiflaquoSiiiiiiiiiiiiiiiiii iii|lNe-|i-ii iiiiiiiiiisiiiiiiiiiiiiiiii Nc iiiiiii liiNCii iiiiiii iiiiiiiilifiei iiiii iiiiiii iilaquo|||il| mmmmi m m m i M iiiiiiiili iiiiiiiiiiiiiiiiisil i iiiisiiiiilllii iiiiliiiiiiiiliiiiiiiiiitii iiiiiiiiiiiiiiiiiiiiiiiiiiifiii iiiiiiliili-|s4ii iiilliiiiiiii ssiiiiiiiiiiiiii iiiiiiii^^iii-iiiii iiiiiiiiiiiiiiiiiiiiiiiliii i iiiiiiiiiiiiiiliiiiiiii 13365 iiiiiiiliiiiiiiiiiiiip^ P b a i e I RI sampling conducted in M a y 1988 Phase II RI samplmg conducted in Apri l 1989
N C = N o cri teria exiata for th is compotmd
N A = N o t Available
(1) Insufficient Data to Develop Cri ter ia Value presented is L O E L - Lowest Observed Effect Level
(2) Value preaented for careinogena ia the 10-S level
(3) Hardness dependent c r i te r ia (25 mgA C A C 0 3 uaed)
(4) Value presented is for Ihe m o r e toxic hexavalent form
(5) Value presented is proposed (more conservat ive)
(6) Effluent Discharge L imi t dilution factor based upon an effluent discbarge of 5 gpm to the Neponse t River during the 7 - d a y low flow lOyr recurrence (2020gpm)
USOS Pleasant Street Oaug ing atation on the Neponset River
(7) Dilut ion factor =[(Sgpm+2020gpm)Sgpm]= 405
(lO)Concentration exceeds effluent discharge limit contaminant must be removed by Groundwate r Treatment Plant before discharge to Ihe Neponset River [ D = D A I L Y M A X A = A V O M O N T H L Y F=FISH]
c and 1-3 for effluent (Uscharge limits for organic and inorganic compounds An acute toxicity
test showed that no toxic effect was observed for the interim treatment discharge
114 Conclusions
Based on the results of the Phase I bench scale treatabUity study the combined unit
operations of fUtration foUowed by carbon adsorption were effective in treating the
contaminated groundwater coUected during the pumping tests for temporary discharge to the
Neponset River A sample of the discharge was coUected during the groundwater treatment
and it was found to contain less than the quantitation limit of 05 xgL of PCB The metals
concentrations were aU determined to be below the discharge criteria A sample was also
coUected and submitted for an acute toxicity determination The resuUs showed that no toxic
effect was observed The bench scale treatability results and the on-line discharge analyses
demonstrate that the filtration and carbon adsorption unit operations were effective temporary
treatment techniques
^ 12 FULL SCALE STUDY
A groundwater treatability study was conducted to evaluate the performance of four different
treatment processes on contaminated groundwater obtained from the Norwood PCB site The
contaminants present in the groundwater were determined during previous studies conducted
in May 1988 and AprU 1989 by EBASCO Chapter 1 of the Final FeasibUity Study
(EBASCO 1989c) contains an overview of the results obtained during these investigations
Based on the resuUs of the May 1988 and AprU 1989 field investigations EPA concluded
that the overburden and bedrock aquifers beneath the site were contaminated with
polychlorinated biphenyls (PCBs) and volatUe and semivolatile organic compounds (VOCs
and SVOCs) It was determined that surficial and subsurface soUs dredge pUes of sediments
taken from Meadow Brook sediments in Meadow Brook and sediments in the drainage
system of the buUding operated by Grant Gear were the sources of the contamination In
r
c September 1989 EPA released the Record of Decision (ROD) for the Norwood PCB site In
the ROD EPA directed that groundwater be treated with a system including activated carbon
air stripping with vapor controls and precipitationfiltration iEPA also directed that
treatability studies or pUot studies be conducted to aid in the overaU design of the system
In accordance with the ROD a bench scale treatabUity study was conducted at the ENSECO
Laboratory Facility in Cambridge Massachusetts by Metcalf amp Eddy personnel between
January 14 and February 16 1992 This report presents a description of the work
completed resuUs and conclusions of the study
121 Objectives
The fuU-scale groundwater treatability study was conducted to determine if treatment
consisting of precipitation fUtration air stripping and carbon adsorption would effectively
remove the contamination present in the groundwater at the Norwood PCB site to appUcable
standards Information on the percent reduction of organic and inorganic compounds in the
groundwater volume type of residual and byproducts produced by each component were
also investigated A schematic detailing the treatability study and the sampling and analysis
conducted is presented in Figure 1-1
122 Description of Work
The treatability study was performed in accordance with Pre-Design Work Plan 3 and the
QuaUty Assurance Project Plan for the Phase n Bench-Scale TreatabiUty Study (Work
Plan 3)
Groundwater samples were coUected from the Norwood PCB site for use in this
investigation Interim sampling was performed on effluent streams generated from each
bench-scale process for analysis according to Table 1-4 Influent and final effluent samples
generated during the groundwater treatabiUty were coUected and analyzed through the CLP
^
o JAR TESTING SAMPLE ID
o
POLYMER TESTING
RAW GROUNDWATER
VOL 1 SVOL I p PCB f ^ ^ METALS
mdash SST
T
T
T
SS - Choose Polymer T ar)d Dose Estimate pH pf i After Coagu lant
Jar Test 1 PH10 bull
Lime wCoag wPdymer - SS T Metals
Ume wCoag wo Polymer - SS T Metals
- NaOH wCoag wPolymer - SS T Metals
NaOH wCoag wo Polymer - SS T Metals
Jar Test 2 pH9
Jar Test 3 pH8
bull
Lime w C oag wPdymer - SS T Metals
- Lime wCoag wo Polymer - SS T Metals
- NaOH wCoag wPolymer - SS T Metals
NaOH wCoag wo Polymer - SS T Metals
- Lime wCoag wPolymer - SS T Metals
- Lime wCoag wo Polymer - SS T Metals
- NaOH wCoag wPolymer - SS T Metals
- NaOH wCoag wo Polymer - SS T Metals
JT1 -1 shy
j r i -2 shy
JT1 -3 shy
JTI-4
j r 2 - 1
JT2-2 shy
JT2-3
j r2-4 bull
JT3-1 shy
JT3-2shy
JT3-3 bull
JT3-4 shy
HLTRATION TESTING
RIter Paper 1 - SS T Time mdash |
RIter Paper 2 - SS T Time-
Rlter Paper 3 - SS T Time -
CtHXise Filter Paper or Particle Retention Size
Sample Well Using Bailer
VOL SVOL PCB CLPMETALS (PPF-1)
Precipitate and Filter Using Optimized Polymer pH Coagulant and Filter
system for volatUes semivolatUes PCBs and metals AU interim samples were analyzed at
ENSECO in Cambridge Massachusetts AU data was vaUdated by MampE according to the
QAPP
1221 Groundwater Sample CoUection Groundwater for this study was coUected from
weUs MW-IA and ME-8 as shown on Figure 1-2 iMW-lA was chosen as a sampling
location because it was determined to be one of the most contaminated weUs on-site based
on previous investigations During the course of the treatabiUty study a decision was made
to obtain samples from ME-8 because results of the most recent sampling effort conducted by
ICF indicated that groundwater from this weU contained approximately 200 xgL vinyl
chloride whereas groundwater from MW-IA no longer contained any quantifiable amount
Removal of vinyl chloride by aeration needed to be demonstrated during this investigation
because vinyl chloride is not effectively removed by carbon adsorption
Groundwater samples were obtained on four separate occasions during the study as shown in
Table 1-5 On each occasion the groundwater was coUected in accordance with the Field
Sampling Plan Three weU volumes of water were purged from the weU using a centrifiigal
pump before any samples were coUected The pH temperature and conductivity of the
purge water was measured after each weU volume untU the measured values differed by less
than 10 for three consecutive samples to ensure the sample drawn was representative of the
water in the aquifer Samples for the metals precipitation and filtration study were coUected
using a centrifugal pump Samples for the air stripping and carbon adsorption study were
coUected with a teflon baUer to minimize aeration and possible loss of volatUes during
sample coUection
The samples were coUected in one gallon amber glass bottles and stored at 4degC Each
sample bottle wasfiUed to exclude a headspace in the bottle
e 10
200 200
SCALE IN FEET
D CAP ROCK SAMPLE LOCATION
bull WELLS
nOURE 1-2 GROUNDWATER AND TRENCH AND CAP
ROCK SAMPLING LOCATIONS
11
E T C A L F a EDDY
c TABLE 1-5 GROUNDWATER SAMPLING SUMMARY
Mode of Date WeU Amount Sampled pH Temp degC Conductivity SampUng
11392 MW-IA 10 gallons 62 8deg 220 umhocm pump
12792 MW-IA 16 gaUons 62 8deg 220 umhocm baUer
20392 MW-IA 16 gallons 62 8deg 220 umhocm baUer
20592 ME-8 2 gallons 64 8deg 230 umhocm baUer
1222 Precipitation Testing
General Chemical precipitation for the removal of metals was evaluated at three pH values
and three polymer dosages to determine the effectiveness of the treatment A preliminary
evaluation of different coagulants and polymers was conducted at three pH values by
r Metcalf amp Eddy personnel and a leading polymer vendor to determine which chemicals could
potentiaUy be used to precipitate groundwater Based on the results from the preliminary
evaluation jar tests were conducted by Metcalf amp Eddy personnel to aid in the determination
of the chemical dosages required to optimize the effectiveness of precipitation
Polymer and Coagulent Testing Polymer testing was performed by Metcalf amp Eddy and a
leading polymer vendor at the ENSECO laboratory faciUty in Cambridge Massachusetts
The effectiveness of anionic cationic and nonioiuc polymer was evaluated at three pH
values The best polymer was determined to be Drewfloc 2270 a low charge anionic high
molecular weight polymer This polymer was used in jar tests 1 through 5 The best
coagulent was determined to be Charge Pack 12 (CP-12) a higher charge cationic low
molecular weight coagulent The CP-12 coagulent was used in jar tests 1 through 5
described under jar testing
12 c
InitiaUy the effects of varying the pH of the groundwater sample was investigated Tests c were conducted at pH values of 80 90 and 100 with sodium hydroxide which had the best
settling characteristics based on visual observation and turbidity measurement Each polymer
was then tested at pH = 100 to evaluate Us effectiveness under optimum pH conditions
A formula of polymer and coagulant addition was developed based on visual observations
suspended soUds and turbidity analyses performed on each sample generated during the
investigation The anionic polymer effectively flocculated the existing smaU suspended
particles and the addkion of cationic coagulant removed iron and color when the pH was
raised to 100
Jar Testing Five jar tests were performed using the polymer and coagulants determined to
be effective during preliminary testing Jar tests 1 and 4 were conducted as dupUcates at
ph 10 Jar test 2 was conducted at pH 9 jar test 3 was conducted at pH 8 and jar test 5 was
conducted at pH 10 On each occasion prior to beginning the jar test the raw groundwater
was brought tol5deg-17degCina warm water bath The temperature was held constant to c eliminate the effects of temperature on reaction rates and solubUity
The foUowing is a description of activities conducted during the jar tests fti through 4 See
Figure 1-1 for details Four samples were evaluated during each jar test For each jar test
four 15 Uter beakers were fiUed with 1 Uter of raw groundwater The beakers were placed
on the stirrer platform and the paddles were lowered into the sample The jar stirrer was
operated at 80 revolutions per minute (rpm) The pH was then adjusted to the desired value
(pH = 10 9 8 10 for Tests 1 2 3 4) with a lime slurry in two samples and with a
sodium hydroxide solution (25) in the remaining two samples Lime was added to
investigate its effects on the precipitate and to evaluate its effectiveness in pH adjustment
The cationic coagulant was then added to each sample untU the concentration in solution was
30 mgL The solution was stirred at 80 rpm for 2 minutes to ensure complete mixing The
polymer was then added to one sample pH adjusted with sodium hydroxide and one sample
pH adjusted with lime Mixing continued for two minutes Next the solution was stirred
13 c
slowly orflocculated for five minutes at 20 rpm FinaUy the solutions were aUowed to
c settle for 10 minutes Visual observations were recorded and samples were submitted for
suspended soUds turbidity and metals analyses
Jar test 5 was performed to assess the removal of manganese and aluminum by preaeration
and permanganate additions (see Figure 1-1) Because no significant benefit was observed in
the previous tests when lime was used instead of sodium hydroxide sodium hydroxide was
used to adjust the pH in aU four samples to a pH of 100 in jar test 5 Only sodium
hydroxide was added to the groundwater in the first jar to determine the removal of
manganese and aluminum attributable to the formation of an insoluble salt at high pH
Sodium hydroxide and polymer were added to the second jar to evaluate the effectiveness of
the polymer Sodium hydroxide polymer and coagulant were added to sample 4 The
supemate from sample 4 was then fUtered This was performed to determine if the required
removal efficiencies could be achieved by chemical precipitation and filtration
Permanganate was added to sample 3 in addition to sodium hydroxide coagulant and
polymer to determine if the manganese and aluminum present could be chemicaUy oxidized c to a less soluble state which would enhance the efficiency of fUtration The supemate was
then siphoned off using clean tygon tubing and a syringe into the sample containers
Samples were submitted for metals suspended soUds and turbidity as illustrated on
Figure 1-1
1223 Filtration Testing A bench-scale filtration study was perfonned to determine the
optimum pore size of filter media that could effectively remove the suspended soUds in the
precipitated groundwater The determination of the removal efficiency for each filter was
based on the concentration of suspended soUds and turbidity of the filtered water The time
required to filter the groundwater was also evaluated
Prior to filtration the metals in the groundwater were precipitated and coagulent and polymer
were added using the optimum conditions developed during the precipitation study The
optimum conditions consisted of pH adjustment to 10 with sodium hydroxide addition of
14 c
coagulent CP-12 to a concentration of one percent and addition of Drewfloc 2270 polymer to
c a concentration of 10 mgl Three grades (10 xm 5 xm and 1 xm pore sizes) of filter
paper were used with a Buchner ftmnel to filter aUquots of the precipitated groundwater
Samples of the filtered water were submitted to ENSECO for suspended soUds and turbidity
analysis
A sample of the metal hydroxide sludge was coUected during the treatability study The
sludge sample was submitted to the CLP system for PCB and metals analysis so that a
characterization of the sludge could be made and disposal options could be evaluated
1224 Air Stripping Testing Precipitated fUtered groundwater was aerated at three
different air to water ratios to determine the most effective stripping ratio To ensure that
worst case volatUe organic compound concentrations were present in the samples for this
study some modifications were made in how the sample was coUected and treated First
the groundwater was coUected with a baUer to prevent the loss of volatUes AdditionaUy the
water was fUtered under positive pressure foUowing the precipitation step to minimize the c loss of volatUes that would result if the water was filtered using a vacuum pump
An aquarium pump tygon tubing and aeration stone with a glass-fiber fUter cartridge was
used to aerate 1-Uter aUquots of precipitated and filtered groundwater The aeration flow
rate was caUbrated by filling a graduated cylinder with air that had been filled with tap water
and inverted in a water bath The air was diffused at 375 missec into 1-Uter aUquots of
groundwater and the time measured as iUustrated in Table 1-6 The aerated groundwater was
submitted to ENSECO for volatUe organics analysis
1225 Carbon Adsorption Testing The effectiveness of activated carbon for the removal
of organic compounds in the groundwater at the site was evaluated The carbon used was
the powdered activated 325 mesh carbon suppUed by Calgon Corporation The groundwater
samples used for this investigation were obtained and filtered as described in the air stripping
15 c
c
c
TABLE 1-6 AERATION TEST OPERATIONS
Air to Water Ratio Volume Volume of by Volume of Water Air Reqd Min of Aeration
251 1000 ml 25000 ml 111 501 1000 ml 50000 ml 222 751 1000 ml 75000 ml 333
section of this report to minimize the loss of volatUes A total of twelve samples were mn
during this investigation The necessity of air stripping was investigated by comparing the
resuUs from four samples that were air stripped to seven samples that were treated identicaUy
with the exception of air stripping AU samples for the air stripping comparison went
through the precipitation filtration and carbon adsorption processes AdditionaUy one
sample was prepared with no carbon added to serve as an untreated sample The samples are
summarized in Table 1-7 Each groundwater sample was prepared and mixed with a
predetermined dose of Calgon powdered 325 mesh activated carbon and placed m an open
Erlenmyer flask on a shaker table for a two-hour time period at 180 rpm A rotary shaker
table capable of accommodating twelve (12)-1000 ml Erlenmyer flasks was used Effluent
was fUtered with a barrel filter using a glass-fiber pre-fUter and a Whatman 45 micron
membrane The effluent clear and odorless in aU cases was added to sample containers
preserved and packed for shipment to CLP laboratories Since the shaker table could
accommodate 12 flasks a total of approximately 4 gaUons of effluent was generated during
each mn Several mns were performed to generate adequate quantities of sample for
analysis accordmg to Table 1-7 Groundwater was simUarly prepared for submittal to
Aquatec Lab in Burlington Vermont for chronic toxicity testing Three (3) shipments of
approximately 2 gaUons each were made
r 16
C) o o TABLE 1-7 CLP TREATABILITY STUDY SAMPLING SUMMARY
Dose g of Carbon Required of mis in gs Carbon
Sample ID 1000 ml of GW Analysis Volume mis Flasks Flasks in each
Precipitation Filtration Aeration amp Carbon
AC-1 05 V SV MET 3400 3 1067 054 AC-2 20 V SV PCB 4400 4 1100 22 AC-3 50 V SV MET 3400 3 1133 57 AC-4 100 V SV PCB 4400 4 1100 110 AC-5 Trip Blank 0 V
Precipitation Filtration amp Carbon
C-0 0 V 500 1 500 0
C-1 05 V SV MET 3200 3 1067 053
c-2 10 V PCB 2200 2 1100 11
C-3 20 V SV CT 29000 24 1250 25
C-4 50 V SV PCB 4400 4 1100 55
C-17 70 V MET 1200 1 1200 70
C-18 100 V SV 2200 2 1100 110
C-13 Treatability Blank 0 V PCB 2200 0 0 0
C-20 Trip Blank 0 V 0
C-10 Duplicate of C-1 05 SV 2000 2 1000 05
C-1 05 (MSMSD) 500 1 500 025
C-11 Duplicate of C-1 05 MET 1000 1 1000 05
C-20 Duplicate of C-2 10 V PCB (MSMSD)
4400 4 1100 11
C-16 Duplicate of C-4 50 PCB 2000 2 1000 50
C-6 0 PCB 2000 2 1000 0
17
o o n TABLE 1-7 (Continued) CLP TREATABILITY STUDY SAMPLING SUMMARY
Dose g of Carbon Required of mis in gs Carbon
Sample ID 1000 ml of GW Analysis Volume mis Flasks Flasks in each
Precipitation amp Filtration
PPF-1 V SV MET PCB 2000 2 1000 0
Sludge
Sludge-1 0 MET PCB 0
V = VolatUe organics SV = Semivolatile organics MET = Metals PCB = Polychlorinated biphenyls CT = Chronic toxicity MSMSD = Matrix spikematrix spike dup D = DupUcate TB = Trip blank PPF = Precipitated and pressure filtered
(to minimize volatUes loss as opposed to vacuum filtration)
18
c
c
123 Results
1231 Precipitation Testing
Polymer Testing Preliminary polymer and coagulant testing was conducted to determine
the type of polymer and coagulant that could be employed to treat groundwater from the site
The Drewfloc polymer and the Drew CP-12 cationic coagulant were chosen as the most
effective types InitiaUy the effect of varying the pH of the groundwater sample was
investigated The resuUs of tests conducted at pH values of 80 90 and 100 are presented
on Table 1-8 As the pH value was raised the quaUty of the floe improved The sample
raised to a pH level of 100 with sodium hydroxide exhibited the best settling characteristics
based on the color turbidity soUds and the quaUty of the floe
The effects of varying the polymer dose was then investigated at pH=100 The cationic
coagulant added to a concentration of 30 ppm after pH adjustment and prior to polymer
addition produced the clearest supemate based on color turbidity and suspended soUds
results Table 1-8 also summarizes the results from this investigation
Jar Testing Four jar tests were performed to evaluate the effectiveness of chemical
precipitation for the removal of metals in groundwater from weU MW-IA The analytical
results from the jar test are presented in Table 1-9 The greatest metal reductions occurred
when the pH was 100 Samples for which the pH was adjusted with lime showed better
removal of barium manganese and sodium concentrations than those samples for which the
pH was adjusted with sodium hydroxide Samples for which the pH was adjusted with
sodium hydroxide showed greater declines in the concentrations of calcium and magnesium
No significant effect was observed on the removal of cobalt iron lead aluminum potassium
and zinc when lime or sodium hydroxide was used to raise the pH The observation that
samples for which the pH was adjusted with sodium hydroxide had elevated concentrations of
19 c
c TABLE 1-8 PRELIMINARY POLYMER TESTING RESULTS
Description of Supemate
Procedure pH ColorSoUds
mgl Turbidity
NTU Floe SettleabUity
Varymg pH
Raw Groundwater pH adjustedNaOH pH adjustedNaOH pH adjustedNaOH
62 80 90 100
YeUowbrownYeUowbrownYeUowbrownYeUowbrown
450 gt50 gt gt 5 0 gt gt50
58 SUght mst pin floe medium
gt medium
None Slow Faster Fastest
Varying polymer dose pH adjustment wNaOH
pH adjustedno polymer
100 YeUowbrown gt gt50 gt medium Fast
Above wpolymerat 1 ppm
100 Light yeUow lt 10 35 large 18 Fast
c Polymer at 5 ppm 100
Polymer at 1 ppm 100 wcoag 30 ppm
Light yeUow
Very Ught
lt 10
lt 10 yeUow
32
30
Large 18
Targe 18
Fast
Fast
n 20
o o n TABLE 1-9 F U L L - S C A L E TREATABILITY STUDY JAR T E S T R E S U L T S
Results in mgL
SAMPLE ID iiiiiiiiiiiiiiiiiiiiMW JAiSiiii iiiJTililiiiiiiiiiiii iiiJTil^iiiiiii iiiiiiiiiiTIi3iiiiiiiii iiiii^ii^li^iiiiiiiiiiiiii^iiri^iiiiisiiiiiiiiiiiiimii iiiiiJT4^iiiiiiiiiiiiiinP4i4iiiiiiiiiii iiiiiJT2iiliiiiiiiiiiiiT2^iiiiiii |i|S^ iiiiiiiiiiiiiiiiiiiiiiiiiiiiilM ii iiiiiiiiiiiiiiiiiiiiJlt iiiiiiiiii iiiiiiiiii-iiiiiiii iiiiiiiii=iiiiiiiiiiiiiliiiiii iiiiiiiiiiiiiiiiiiiiiiliiiiiiiiiiiiiiiiiiiiiiiiiiliiiiiiiiiiiiiM ii^iiiiiiiiiiiii6iiiiiiiiiiiiiiiiiiijqiiiiii mmsectlsectMimamp0^
Zinc 0488 002 U 002 U 002 U 002 U 002 U 002 U 002 U 002 U 002 U 002 U
E S A M P L E ID iiiiiiiiiiiiiiiiiiiiJT2i3iiiiiiiiiiiiiiiii ^T2-4iiiiiiiii iiiiiiiiJ^alliiiiiiiiiiiii iii^Ta^iiiiiiiiiiii iiiiiiiiit3|3iiiiiiiiiiiii iiilT3Tr4iiiiiiiiiiiiiii rrs-i iiiiiiiiiiiiiiJTSl iiiiiiiiiiiiiii iiiiiitJiJiiiiiiiiiii iiiiiiWs-4iiiiiiiiiiiii iiiiiiiJT5r-5ii|iiiiiiii
iiiiiiiiliiiiiiiiiiiiiiiiiBSsiii iiiiiiiiiiiiiiiiiiiiiilgtHiiiiiiiiiiii iiiiiiNaOHiiiiiiii iiiiiiiiiiii)iliimiiiiiiiii iiiiiiiiSiiriiiisiiiiiiiiii iiiiiiiiNiliiiiiiiiii iiiii iNapHiiiiiiiiiiiii iiiiiiiiiiiiiiiifloiiiiiiiii iiii^iiiiiiiiiii iiiiiiii NiitQHiiiiiiiii iiiiiiiiiWftOHiiiiiiii wmm iii^iiiiiiiisiiiiiiiAli|ilii iiiiiiiiiiixiiiiiEal3i iltgtoi PolyCoag C o a g u l a n t PolyCoag Coagulant iiiiiiii iiiiiii iiiiiii)|sihyii^iiiiiiii PolyCoag PolyCoag iiiPoij^iii^il ANALYTES Aerated KMn04
Barium 0073 0072 010 010 010 010 NA NA NA NA NA Calcium 247 247 571 574 273 277 NA NA NA NA NA Cobalt 001 U 001 U 0017 0018 0017 0019 NA NA NA NA NA Iron 01 U Ol U 016 023 016 043 NA NA NA NA NA Lead 0005 U 0005 U 0005 U 0005 U 0005 U 0005 U NA NA NA NA NA Magnesium 44 44 50 51 50 50 NA NA NA NA NA Manganese 35 33 43 43 44 44 063 086 099 094 14 Potassium 5 U 5 U 5 U 5 U 5 U 5 U NA NA NA NA NA Sodium 423 477 170 169 502 508 NA NA NA NA NA Zinc 002 U 002 U 0082 011 015 016 NA NA NA NA NA
Notes Only metals detected in untreated groundwater from MWIA are presented NA = Not Analyzed
U = undetected at specified detection limit JTI = Jar Test 1
c
c
sodium in the treated water was expected This is because sodium is a component of sodium
hydroxide Similarly the elevated concentrations of calcium observed in samples for
whichthe pH was adjusted wUh lime are due to the calcium component in lime Jar test 5
was conducted to assess the effect that precipitation and chemical oxidation had on the
removal of manganese and aluminum The results of this investigation are also presented in
Table 1-9 The results indicate that greater reductions of aluminum and manganese cannot
be achieved with aeration or by the addition of a chemical oxidant such as permanganate
A sample of the metal hydroxide sludge a residual that wiU be generated during the
groundwater treatment was analyzed for metals and PCBs This sample of sludge was
generated by treating contaminated groundwater with precipitation and filtration using the
optimum treatment parameters The metals results indicate that the sludge would not be
considered hazardous under RCRA using the toxicity characteristic leaching procedure
(TCLP) A TCLP was not performed on the sludge however based on 1) the concentration
of the metals in the sludge 2) assuming a 100 leachability and 3) incoiporating a 20-fold
dUution for a soUd matrix analyzed by TCLP this sludge would not be considered hazardous
under RCRA The PCB analysis of the sludge showed that Aroclor 1254 was the only
detected PCB at a concentration of 31 mgkg The TSCA limit for PCBs in waste is
50 mgkg indicating that this sludge would not be hazardous under TSCA The results for
this sludge represent a preliminary characterization and once the fuU scale treatment system
is on line the sludge analysis wiU need further testing to confirm these preliminary results
and to make a further assessment of the disposal options The analytical resuUs for the
sludge are presented in Table 1-10
1232 FUtration Testing A bench-scale filtration study was performed to determine the
optimum particle retention grade or mesh of filter media that could effectively remove the
suspended soUds in the precipitated groundwater The results of the analysis on the fUtrate
are presented in Table 1-11
n 22
c
c
TABLE 1-10 PRECIPITATED METAL HYDROXIDE SLUDGE RESULTS Results in mgkg
i||ipiiiii|iiiiiiiiiiiiiiiii^^iiiili|ii^^^ TCLP or TSCA L i n i l t s i Tfesi-iiiiiiiiiiiiiiisiiiiii^iiiiiiSvHiij^ in Solid Matrices ii iiiiS WM3KT2S
METALS
Aluminum Antimony Arsemc Barium Beryllium
Cadmium Calcium Chromium Cobalt Copper Iron Lead Magnesium Manganese Mercury Nickel Selenium Silver Sodium Thallium Vanadium Zinc
PCBs
Aroclor 1254
41100 231 195 346 5767
9120 338
25 114
39000 694 5260 2730
03313
04
8960 08
561446
31
U U
U
J
U U U R
U U J
J
NC NC 100
2000 NC 20
NC 100 NC NC NC 100 NC NC
4 NC 20
100 NC NC NC NC
50
Notes = TCLP Limits incorporated a 1 to 20 dilution factor for solid matrices Aroclor 1254 was the only PCB detected The remaining six Aroclors
were nondetect at a quantitation limit of 36 mgkg NC = No criteria exists for this compound U = Undetected at speciiied detection limit
L J = Estimated value due to validation criteria R = The result is rejected
23
c
c
TABLE 1-11 FILTRATION STUDY RESULTS
Media Rating Speed Suspended SoUds Turbidity
Raw 45 mgl 578 Course 10 um 200 mls5 sec lt5 mgl 16 NTU Medium 5 um 200 mls7 sec lt5 mgl 19 NTU Fine 1 um 200 mls23 sec lt5 mgl 18 NTU
Since there was virtuaUy no difference in the quaUty of effluents but substantial increase in
time to filter with the fine filter paper the medium 5 micron paper was chosen to prepare
sample for ftirther study
1233 Air Stripping Precipitated fUtered groundwater was aerated at 3 different air to
water ratios to evaluate the effectiveness of air stripping for the removal of volatUe organic
compounds in the groundwater Tables 1-12 and 1-13 shows the analytical results for
groundwater samples obtained from weUs MW-IA and ME-8 respectively No volatUe
organic compounds were detected in samples that were aerated at a 501 air to water ratio
Aeration of precipitated filtered groundwater obtained from weU ME-8 removed aU of the
vinyl chloride at an air to water ratio of 251
1234 Carbon Adsorption The effectiveness of carbon adsorption for the removal of
organic compounds in the groundwater was evaluated The analytical results are presented in
Table 1-14 At the lowest carbon dosage only 1 xg1 of cis-12-dichloroethene and
2 xg1 of trichloroethene remained No site-related volatUe organic compounds were detected
in samples which were treated with higher doses of carbon Toluene and
dibromochloromethane were detected in sample C-4 however these two compounds were
not detected in the raw groundwater and must therefore be a result of lab contamination
24 c
c TABLE 1-12 FULL SCALE TREATABILITY STUDY AIR STRIPPING RESULTS IN ugL FOR WELL MWIA
Methylene Chloride 10 u 4 U 5 U 5 U 4 U 4 U 2 U 4 U
cis-12-Dichloroethene 200 D 1 U 1 06 J 06 J 1 U 1 U 1 U
Chloroform 4 J 1 U 1 U 1 U 1 U 12 J 1 U 1 U
12-Dichloroethane 10 U 2 1 u 1 U 1 U 1 U 1 U 03 J
Carbon Tetrachloride 10 u 1 U 1 u 1 U 1 U 1 U 1 U 01 J
Trichloroethene 860 D 1 U 2 06 J 06 J 02 J 1 U 1 U
Toluene 10 U 020 J 1 U 1 U 1 U 007 J 25 1 U
Dibromochloromethane 10 U 1 U 1 U 1 U 1 U 1 U 14 1 U
Chlorobenzene 5 J 1 U 1 U 1 U 1 U 1 U 1 U 1 U
Ethylbenzene 10 U 1 U 1 U 1 U 1 U 1 U 1 U 1 U
Total Xylenes 1 J 1 U 1 U 1 U I U 1 U 1 U 1 U
Styrene 10 U 1 U 1 u 1 U 1 U 1 U 09 J 1 U
124-Trichloroben2ene 2400 D 4 1 u 1 U 1 U 1 U 1 U 1 U
123-Trichloroben2ene NA 5 1 u 1 U 1 U 1 U 1 U 1 U ^
SEMIVOLATILE ORG ANICS
Diethylphthalate 10 U 2 J 10 u 10 U 10 u Di-n-butylphthalate 10 U 1 J 10 u 10 U 10 u
Bis(2-ethylhexyl)phthal ate 10 U 10 U 10 u 4 J 2 J
Notes
Only volatile and semivolatile organics detected in any sample are included
No PCBs were detected in any effluent sample at a detection limit of 01 ugL influent was 36 J ugL
C-ID = Duplicate of C-1
U = Undetected at specified detection limit
J = Estimated value due to validation criteria
D = Duplicate
NA = Not Analyzed
= Value is for total 12-Dichlorocthene
i| f|iiiiiiiiiiiiiii^ti8ili| WSk
3 U 2 u 8 U
1 U 1 u 1 U
1 U 1 u 1 U
04 J 1 U 1 U
1 U 1 u 1 U
03 J 008 J 1 U
1 U 1 u 1 U
1 U 1 u 1 U
02 J 1 U 1 U
005 J 1 U 1 U
02 J OI J 1 u 1 U 1 U 1 u 1 U 1 U 1 u 1 U 1 U 1 u
10 U
10 u
2 J
27
c
The effectiveness of combining aeration and carbon adsorption to remove organic c contaminants was also investigated These results are also summarized in Table 1-15 No
organic compounds were detected m any of the samples generated during this investigation
124 Conclusions The results of the groundwater treatability study demonstrate that
treatment consisting of precipitation fUtration air stripping with vapor phase controls and
carbon adsorption appear able to meet cleanup levels estabUshed for the site Figure 1-3 is a
schematic representation of the proposed system The ROD stipulates that treated
groundwater wUl be reinjected to the aquifer onsite in this case MCLs are the cleanup
levels An altemative to be evaluated is discharging the treated groundwater to a surface
water body either Meadow Brook or the Neponset River In this case cleanup levels are
estabUshed as effluent discharge levels Effluent discharge levels are calculated by
multiplying the ambient water quaUty criteria (AWQC) values for each compound by a
dUution factor The dUution factor for the Neponset River is based on a 100-gpm treatment
discharge rate and a Neponset River 7010 of 2020 gpm The dUution factor for Meadow
Brook is 1 since the treatment discharge rate is greater than the flow of the brook therefore
effluent discharge levels for Meadow Brook are set at AWQC
Tables 1-16 through 1-19 compare effluent discharge levels for both the Neponset River and
Meadow Brook to carbon adsorption effluent from the groundwater treatability study
Table 1-16 summarizes the concentration of metals in untreated groundwater the metals
concentrations remaining foUowing precipitation and filtration the metals concentration
foUowing aeration and carbon adsorption the metals concentrations foUowing caition
adsorption only the MCLs and the effluent discharge levels based on discharge to the
Neponset River The only metal effluent concentration which exceeds the MCLs is
aluminum the MCL for aluminum however is a secondary MCL which is nonenforceable
No metals concentrations in the effluent exceed any of the effluent discharge levels
n 28
c TABLE 1-15 FULL-SCALE TREATABILITY STUDY AERATION AND CARBON ADSORPTION RESULTS Results in ugL
iiiiii|Mpt-HiiDiiii-iiiiii^iiiiiiiiiiii iii bullbullbull^(6-^1 iiiiii-iiiiiiiii iiiiiiiiii^g-2iiiiiiiiiii|i
l | | | ibyNigtii i i i i | i i i i i i i | ivi
VOLATILE ORGANICS
Mediylene Chloride 6 U 4 U Carbon Tetrachloride 1 U 01 J Toluene 02 J 1 u Total Xylenes 1 U 1 u Acetone 5 U 5 U 2-Butanone 5 U 5 U 2-Hexanone 5 U 5 U 4-Methy 1-2-pentanone 5 U 5 U Carbon Disulfide 1 U 1 U
c Notes Only volatile organics detected in any sample are included U = undetected at specified detection limit J = value is estimated due to validation criteria
iiiiiA61iiiiiiiiiiiii
3 U 1 U
02 J 01 J
5 U 5 J 5 U
5 U 1 U
i|AGii[ijiiifii
3 U U
01 J 1 U 5 U 5 U 5 U 5 U 1 U
i^^^iiiiiic|ii[|ili
10
1 u 1 u 1 u 5 U 5 J
5 U 5 U 1 U
29
c
o o o
o
Gas Phase GAC or Catalytic Oxidation
To ^ Ambient
Air
To Groundwater Recharge or
Raw Treated ) Neponset River Groundwater Groundwater Influent Holding Tank J
Solids for Offsite Disposal
(NOTE Air stripper not necessary if discharge to Neponset)
FIGURE 1-3 PROPOSED GROUNDWATER TREATMENT SYSTEM SCHEMATIC
2483JP
o n o TABLE 1-16 COMPARISON OF INORGANIC FULL-SCALE TREATABILITY STUDY RESULTS TO MCLS AND DISCHARGE LEVELS
[i^i^^^^ iiiiiiijiMf|iilaquo4 Precipitation Aeration and Carbon AdsorpUoi iiiiiiiiiiiiiiiiiiiiiiritliiiiin
iiiii iiSiiii|iiiiiiiiiiiiiiiii and Filtration M^ Iiiiiiiiiiiiii iiiiiiiii|iiii|i|iiiiiiiiiii liiiijlliiiii
iiiiiiiiiiiiiiiiiiiii iiiiiiiiiiiiii i i i i i i i|ii||iiiiiiiiiiiiiiiiiiiiiiiii iiiiiiiiiiiiiiiilii Giliii iiiii ii iiiii i iiiic iD|i laquoi|iiiiiiii iiiiitiiiiciiiiiiiiiiiii
Discharge levels calculated by multiplying AWQC by a dilution factor based on a 100 gpm treatment discharge rate and a Neponset River 7Q10 of 2020 gpm
U = Undetected at specified detection limit
J = Estimated value due to validation criteria
NC = No criteria exists for the compound
P = Proposed MCL
S = Secondary MCL
n n o TABLE 1-17 COMPARISON OF INORGANIC FULL-SCALE TREATABILITY STUDY RESULTS TO MCLS AND DISCHARGE LEVELS
DISCHARGE TO MEADOW BROOK
[isjiiiiiiiiiiiiiiii-ii |iiiiiiiiiiiiiiiiiiiiiiiiiiiiiiiiiiiiiiiiiiiiiii iiiiiiiiiiiiiiiiiiiiiiiiiiiiii iiiiiiiiiiiiiiiiiiiiiiii- iiiiiiiiiiiiiiiiiiiiiiiiiiiiiiiiii ^iiiiiiiiiiiiiiiiiiiiiiiiiiiiiiiiii bull immMmii^^ F- piiiipiiiiil i i i i i i i i i i i AcraUon and Caibon AdsorpUon iii iii iiii i i i i l l l i i i i i i ^ ^ i p t ^ sectffllM^ ^ ^
Ajumin iw u i 358 bull490 z ii 240 i--lJi iiiiiiiiiiiJ^3iiitJi i i iii i3 lliiiiiiiiii iiii|ii]^(Ciiiiiiiiiii-iii-iiiiiiii5iiiii-iiiiiiiiNC^ Antimony 2i ij NA 44 U i44 U 44 U 44 U 44 U 10 P 88 30 8600
Ariseiaic- iiiiiiiiiiiiiiiiiiiiii8iiiiiiiiiiiiiii iiiiiiiiii-iis- - iiiiiiiiii- 1 u 71 J i-iiiiiy3|ili-uj - i i i 9 l i j i iii--5Qiiiiiiiiiiiiii iiiiii NC- NC - iL | Barium 247 32 106 U 65 U 597 49 U 131 IJ 2006 NC NC NC
Blaquoay|Hiiraquosi-- bullbullbull--bull i-iiiii-iiiiii3iiiiiiliiiiiiii -iiiiiiiiiiiNAi-iiiiiii I u -- 1 U iiiiiiiiiliilliiiiii-ii|iyi- iiiii iiiiiiiiiiiiiiiiii ii|i|40 - 53-bullbull13|shyCadmium ( S i u bull bull bull bull bull bull bull bull bull N A 4 UJ 4 UJ bullr^^ 4UJ 4UJ 5 682 038 170 Cai lc turn i bull- iiiiii3PiOCfiii iiiiiiiiiiii iiiiiiiiii^iiiiiiiiiiiiii 9650 i 8360 iiii7886iiiiiiiiiiiiiiiiiiiiiiii^iiiiiiii-ii6^^ iiiiii5isNltiiiiiiiiiiiiiiiiiii iiiiiiNC NGi NC Chromium 315 NA 8 J 7 UJ 7 u j 7 uj 7 iirj 160 16 11 3206
CO i-iii-iiii 33iitiii-iiiiii ii-iiiii-i-Jfiiiiii--iiii - bull bull 4 U Z 4 U- iiiiiiiiiiiiiilii-uiiiiiiiiiiiiiiiiiiiiiii4iitjiii-iiiiiiiiiii4 iiiiii-ii Nltiiiiiiiiiiiiiiiiiiiiii i l i iNc-- -NCi^-NCi
P ^ i bull bull Copper 6 4 i NA 128 U 179 U bull64Uj 9 U --256--u-- 1300 48 36 NC
Jtaa- iiiiiiiiiiii ltJOlt iiiiiiiiiii isiiiiiiiJQiii-i - z 6AS U ii232U-^^ bulliiiiiiiiiiiiiiiiiiiiuiiiiiiiiiiiiiiiiiiiiiiiiiiiiiiiiiii2 ipit|iiiiii iiiiii3pQiiiiJiiiilii liiiNC- v 1000- bull- NCi head 253 5^U^ 35 U 46 U 21 U 12 U J 2^4 u 14 054 NCis |Magnlaquoaiuiai iiiiiiiiiiilaquo)6iiiiiiiiiiiii iiiiiiiiiiii|lS)6iiiiiiiiiiiiii 3700 7060i V^ bulliiiMiiiiiiiiiiiiiiiiiii3Jpiiiiiii7^0iiiii^^^ i iiigtKSiiiiiiiiiiiiiiii bulliii I N C bull N C Ncjii Manganese 4810 bull356 62 U 18 UJ 23 U 35 U 53 U 56 S NC NC 106
Wtercuryi iiiiiiiiiiiiiiiiiiiiiiiiyiiiMiiiiiii iiiiiiiiiiiiiiiiiNAiiiiiii i P-2 U bullbull 0 2 U-- iiiiiiiiiiiiiiiiOi|iiittiiiiiii|iiiii 6iiiiit|iiiiiiiiiiiiiQ|iit|iiiiii iiiii|i|iiiiiiiiiii iiii|iii24- -- oon --0i|i Nickel 281 isrA 181 UJ 244 UJ 269 uil 17 U 356 il 166 P 643 33 3800
Potraquoslaquolum -iiiiiiiiiii4liS0iiiiiiiiii iiiiiiiiiiiii PPQiiiiU i 2200 U i ii 2620 XT | |i |owiiyiiiiii | |(^iiiiiiiiiii^ iiiiiiiiiiiiiiiW|iiiiiiiiiiiiii iii iii|ip--i NC- bullbullbull-KCii Selenium 20 U NA 32 U 13 UJ 1 6 u 1 UJ i u 5 6 266 50 6800 Sflycri i-i- iiiiiiiiiiiiiiiiiiiiiiiiiiiiiiiiiiiiiii iiiiiiiiiiiiiiiiiii iiii- i-4U bull -^M- U iii bull i i i i | | i | | i i i i |-i i | i | l | i i i i | i i i i iiiii-i ^66iiiiiiiiiiiiiii i|iP37 -0i2iNi Sodium 1 2 3 6 6 6 9 5 5 6 6 99000 lOlOOO 99866 106066 74566 NC NC NC NC
I m iiiiiiiiiiiiiiiiiiiiii||jriiiiii||iii|i|iii|| | ii46Q ^40- -bull-3iThaUJiiiitt - iiiiiiiiiiiiiiiiiiiiiiiiiiliiiiiiiiii iiiiiiiiiiiiiiNAii- I UJ ^ iiiiiiiiiiiiiiiiii Vanadium 439 NA 5 U 83 UJ 5 U 5 IJ 0 IJJ NC NC NC NC
Ziiicii^ iiiiiiii-iiiii- 488iiiiiiiiiiiiii iiiiiiiiiiii6iiu 151 U 67 UJ iiiii iiiiiiiiiiiiiiiil52iU- iiiiiiiii2 liiiiiiiiiii iiJiOQ()ii- Siiiiiiii iiiiiiiiii|6 bull bull33 - N C i
Notes
Discharge levels are AWQC (10-5 risk) since the treatment discharge rate of 100 gpm is higher than the flowrate of Meadow Brook
U = Undetected at specified detection limit
J = Estimated value due to validation criteria
NC = No criteria eus ts for the compound
P = Proposed MCL
S = Secondary MCL
o n o TABLE 1-18 COMPARISON OF ORGANIC FULL-SCALE TREATABILITY STUDY RESULTS TO MCLS AND DISCHARGE LEVELS - DISCHARGE TO THE NEPONSET RIVER
||x|o | bull iiii||i||il|A iiiiii iiiiiiiiliiiiiiiiiiili ii5iiPo|laquo|o|i iii||l|i|i||ii||y E^ly1 C DoteslOO ii i^i|raquoiiipltii=(iiiii|iii iiii i i w i M w iiiiiiilliHiJLYiiii iiiiWiiiiii iiiiiiiiiiiiii ii iiiiiiiiiiiiiiiiiiii iiiiii iiii iiiiiiiiiii iiiiiiiiiiiiiiiiii iiiiiiiiiililiiiiiiiiiliiiiii bulliiiiii lagaiiiiiiiii iiiiiiiiiiiiiiiiiiiiiiiiiiiiiiiii (ugL) iiiiiiii^iiiiiiiiii iiiiiiiiiiiiipiiiii iiUiiiiiii^ WmnKiiiiiii i(iiiiiiii i iii iiiiiiiiiiMiiiiii VOLATILE ORGANICS
112-Trichlorocthane 5 J 25 U 1 u 1 u 1 U 1 u 1 u 5 NC NC 8904
1122-TetrachIororthane 16 J 25 U 1 u I u I U 1 u 1 u NC NC 50880 2332
Chloroform 4 J 25 U 1 u 1 u 1 U I u 1 u NC 612680 26288 3328
Vinyl Chloride 10 U 50 U I u 1 u 1 u 1 u 1 u 2 NC NC 111300
11-DichIoroethene 10 U 25 U 1 u 1 u 1 u I u 1 u 7 245920 0 403
12-Dichloroethene (total) 200 D 97 1 u 1 u 1 u 1 u 1 70 245920 NC 29680000
Trichloroethene 860 D 430 1 u I u 1 u 1 u 2 5 954000 464280 19504
Tetrachloroethene 5 J 25 U 1 u I u 1 u 1 u 1 u 5 111936 17808 1876
Xylenes (total) 1 J 25 U 1 u 1 u 01 J 1 u I u lOOOO NC NC NC
Chlorobenzene 5 J 25 U 1 u 1 u 1 u 1 u I U NC NC NC NC
SEMIVOLATILE ORGANICS
Pentachlorophenol 25 U ND 25 U 25 U 25 U 25 U 25 U I 424 276 NC
Chlorobenzenes(total) 5300 1060 NC
13-Dichlorobenzene 3 J 2 10 U 10 U 10 U 10 U 10 U 600 NC NC 55120
14-Dichlorobenzene 17 9 10 U 10 U 10 U 10 U 10 U 75 NC NC 55120
12-Dichlorobciizcne 7 J 5 10 U 10 U 10 U 10 U 10 U 600 NC NC 360400
124-Trichlorobenzene 2400 D 50 10 u 10 u 10 U 10 u 10 U 9 5300 1060 NC
PESTICIDESPCBS
Arocloi-1254 36 J 32 NA 01 u NA OI u NA 05 42 03 01
Heptachlor 0074 J NA NA NA NA NA NA 04 11 01 01
Aldrin 017 J NA NA NA NA NA NA NC 64 NC 002
Heptachlor Epoxide 0045 J NA NA NA NA NA NA 02 NC NC NC
gamma-Chlordane 0056 J NA NA NA NA NA NA 2 51 OI 01
Notes
Discharge levels calculated by multiplying AWQC (10-S risk) by a dilution factor based on a 100 gpm treatment discharge rate and a Neponset River 7Q10 of 2020 gpm
Compounds presented are only those detected in the untreated groundwater sample
NA = Not analyzed J = Estimated value due to validation criteria
NC = No criteria exists for the compound D = The reported value is from the diluted analysis
U = Undetected at specified detection limit P = Proposed MCL
o n o TABLE 1-19 COMPARISON OF ORGANIC FULL-SCALE TREATABILITY STUDY RESULTS TO MCLS AND DISCHARGE LEVELS - DISCHARGE TO MEADOW BROOK
i 1 liiiisisi i ii iii iii|i|i i l i 11 i |ii^^ i i i i i i i i iiiiiiiiiiiiiiiiii iiiiiiiiiiiiieiciidiiiiii iiiiiiiiiiiiii iiiiiliiiiiii^^iiiiii iiiiiiiiiiiiiiiiiiii iiliiiii i iiiiipiiiliiiiiiiliiii iiiiiiiiiiiiiiiiii iiiii|iii|i|i-iiiiii iiAVQiii|iiiii i ii-iiiiiiigt-iiii ^^
iiiiiiiiiiiiiiii iiiiiiiiiiiiiiiiiiiiiiiiiiiiii iiiiiiiiiiiiiiiiiiiiii I i i i i i i i i||i|i|||iiiiiiiiiiiiiiii|iiii iii-|iiilaquo|i3[i|ii |||^|ii^|i|^|iii i (3 i i ^ ^ l i i illjliii^jiii^ iieip|i(iii|i iiiiiiiiiiiiiiiiiiii i^|iii|(iiiijiii|)|r^ iiii-iiliiiiiiiiiiiii ||i |illlli|i i|li|i|ii iiiiiiiiiiiiiiiiii iiiiiiiiiii|tiiiiiiiiiiiiiiiiiii iiiiiiiiiiiifiiiiiiiiii iiiiiiiiiiiiiiiiilaquoiiiiiii iiiiiiiiiiilliiiiiiiiiiiiiiii i (laquoy^ iiiiiiiiiiiii(Wiiiiiiiii iiiiiiiii i lK^ iiiiiiiiliiiiiiiiiiiiiiiii (ugl)iii iiMiiiiiii VOLATILE ORGANICS
112-Trichloroethane 5 J 25 U 1 u 1 u 1 u 1 u 1 u 5 NC NC 420
1122-Tetrachloroethane 16 J 25 U 1 u 1 u 1 u 1 u 1 u NC NC 2400 110
Chloroform 4 J 25 U 1 u 1 u 1 u I u 1 u NC 28900 1240 157
Vinyl Chloride 10 u 50 U 1 u 1 u 1 u 1 u I u 2 NC NC 5250
11-Dichloroethene 10 u 25 U 1 u 1 u 1 u I u 1 u 7 11600 NC 19
12-Dichlorocthene (total) 200 D 97 1 u I u 1 u 1 u 1 70 11600 NC 1400000
Trichloroethene 860 D 430 1 u 1 u 1 u I u 2 5 45000 21900 920
Tetrachloroethene 5 J 25 U 1 u 1 u 1 u 1 u 1 U 5 5280 840 89
Xylenes (total) 1 J 25 U 1 u 1 u 01 J I u I U 10000 NC NC NC
Chlorobenzene 5 J 25 U 1 u 1 u 1 u 1 u I u NC NC NC NC
SEMIVOLATILE ORGANICS
Pentachlorophenol 25 U ND 25 U 25 U 25 U 25 U 25 U 1 20 13 NC
Chlorobenzenes(total) 250 50 NC
13-Dichlorobcnzene 3 J 2 10 U 10 U 10 u 10 U 10 U 600 NC NC 2600
14-Dichlorobenzene 17 9 10 U 10 U 10 u 10 U 10 U 75 NC NC 2600
12-Dichlorobenzene 7 J 5 10 U 10 U 10 u 10 U 10 U 600 NC NC 17000
124-Trichlorobenzene 2400 D 50 10 u 10 u 10 u 10 u 10 U 9 250 50 NC
PESTICIDESPCBS
Aroclor-1254 36 J 32 01 u 01 u OI u OI u NA 05 20 0014 00045
Heptachlor 0074 J NA NA NA NA NA NA 04 052 00038 00029
Aldrin 017 J NA NA NA NA NA NA NC 3 NC 000079
Heptachlor Epoxide 0045 J NA NA NA NA NA NA 02 NC NC NC
gamma-Chlordane | 0056 J NA NA NA NA NA NA 2 24 00043 00048
Notes
Discharge levels are AWQC (10-5 risk) since the treatment discharge rate of 100 gpm is higher than the flowrate of Meadow Brook
Compounds presented are only those detected in the untreated groundwater sample
NA = Not analyzed J = Estimated value due to validation criteria
NC = No criteria exists for the compound D = The reported value is from the diluted analysis
U = Undetected at specified detection limit P = Proposed MCL
Table 1-17 shows a comparison of effluent to effluent discharge levels based on discharge to c Meadow Brook assuming a dilution factor on one If the treated groundwater was discharged
to Meadow Brook effluent discharge levels for arsenic would be exceeded Since arsenic is
a difficult compound to remove in a groundwater treatment plant it is concluded that
Meadow Brook may not be usable as a discharge point
Table 1-18 presents concentrations of organic contaminants in untreated groundwater from
MW-IA the precipitated and filtered effluent the effluent following both aeration and
carbon and the effluent from carbon adsorption only These values are compared to MCLs
and effluent discharge levels Only one carbon dose for the carbon only study the lowest
dose of 05 g carbon1000 ml groundwater is shown as a conservative example In both
cases using aeration and carbon and carbon alone organic contaminants were removed to
below MCLs and to below discharge levels Therefore aeration at an air-to-water ratio of
251 and a carbon dose of 05 g carbon1000 ml groundwater effectively removed volatile
organics semivolatile organics and PCBs from the groundwater
c It is expected that a maximum air-to-water ratio at 251 will be effective for an air stripper
onsite because full-scale air strippers are many times more efficient than the bench scale
models This is due to the greater surface area and turbulence found in the stripper The
off-gas from the air stripper will have to be treated to meet applicable standards either by a
catalytic oxidation unit or a vapor phase carbon adsorption system
Since no vinyl chloride was present in MW-IA and vinyl chloride is a difficult compound to
remove with carbon adsorption tests were performed with groundwater from ME-8 which
contained 210 xg1 vinyl chloride These results were presented in Table 1-13 which shows
that air stripping at an air-to-water ratio of 251 is effective in removing vinyl chloride In
order to reach the MCL of 2 figl for vinyl chloride an air stripper is required Carbon
adsorption alone would not remove vinyl chloride down to the MCL If the treated
groundwater is discharged to the Neponset River instead of being reinjected an air stripper
to remove vinyl chloride is not necessary since the discharge level is 111300 xg1
35 c
Table 1-19 shows a comparison between the organic concentrations in treatability study c effluents and effluent discharge levels based on discharge to Meadow Brook All volatile and
semivolatile organic compounds are removed to the effluent discharge levels It is
impossible to determine if PCBs were effectively removed since the most stringent discharge
level is 0014 xgL and the detection limit in the study is 01 xgL Discharge to Meadow
Brook may not be feasible due to 1) the treatability study cannot prove that PCBs are
removed to effluent discharge levels and 2) arsenic concentrations in the treated effluent
were higher than effluent discharge levels (based on a dilution factor of one)
The preliminary results of the sludge analysis indicate that the sludge is nonhazardous under
RCRA and TSCA Once the fiill scale groundwater treatment system is on line samples of
the sludge should be reanalyzed to confirm the preliminary results and to further assess the
disposal options
In summary the results of the treatability study indicate that groimdwater from the Norwood
PCB site can be treated effectively to allow discharge to either the Neponset River or r gtlaquo^ reinjection back into the aquifer If treated groundwater is reinjected the treatment plant
must include an air stripper to remove vinyl chloride If treated groundwater is discharged
to the Neponset River an air stripper is not necessary to meet discharge levels however the
use of Best Available Technology (BAT) may be required which would necessitate the
inclusion of an air stripper A cost comparison between an air stripper combined with
liquid-phase carbon versus liquid-phase carbon alone was performed and reported in the
Modeling Report The conclusion was there is not a significant difference in cost the
present worth assuming a discount factor of 8 and a 16-year period of perfonnance was
135 vs 102 million dollars (see Volume 2 Section 3) These costs will be evaluated
further during the design phase of the project The efficiracy at the full scale plant can be
optimized to ensure that at no time will the effluent from the plant exceed any applicable
groundwater or surface water standard
36 C
Section Two
c
c
20 ROCKS
21 Introduction and Objectives
There are several sources of rocks potentially contaminated with PCBs present on the Grant
Gear property portion of the Norwood PCB site Three different sources of rocks were
collected for analysis from the Grant Gear property The three rock sources included
overburden rocks from a trench west of the Grant Gear facility and below the interim
remedial cap crushed stone from the interim remedial cap west of the Grant Gear facility
and pea stone from the upper and lower roofs of the Grant Gear facility Throughout this
section rocks collected from on top of the interim remedial cap will be referred to as cap
rocks and overburden rocks wUl be referred to as trench rocks The rock collected from the
roof were analyzed under Work Plan 1 and are discussed in the Building Investigation
Report
The objective of this portion of the predesign work was threefold
bull To determine the PCB contamination if any on the different sources of rocks
bull To assess the feasibility of dry tumbling as a remedial altemative for the rocks
bull To assess the feasibility of water washing as a remedial altemative for the rocks
The dry tumblingwater washing was conducted on rocks that were reported to be too large
to be remediated with overburden soils by the solvent extraction technique
22 Description of Work
Samples of the three sources of rocks were collected by Metcalf amp Eddy personnel on
January 8-10 1992 Refer to Figure 1-1 for the locations of the trench and the cap rock
37 c
sampling points The samples were delivered to ENSECO laboratory in Cambridge
c Massachusetts and stored in a refrigerator at 4degC prior to sample preparation and analysis
Metcalf amp Eddy performed the sample preparation portion of the PCB analysis Rock
samples were weighed and gently placed in precleaned two liter glass beakers A quality
control surrogate compound was then added to each sample or method blank for subsequent
percent recovery determination The rocks were then immersed in extraction solvent
consisting of 30 percent acetone and 70 percent hexane by volume iEach sample and blank
was heated to 50degC and intermittently swirled by hand for a thirty minute extraction time
The extracts were then dried using sodium sulfate concentrated to 10 milliliters final volume
and submitted to ENSECO for PCB analysis using EPA SW846 Method 8080
The trench rocks were divided into three size categories with average diameters of one inch
two inches and three inches The rock size is an important consideration for the solvent
extraction remediation technique
^s^^ The three trench rock sizes and six cap rock samples were analyzed initially to determine the
extent of PCB contamination As outlined in the Quality Assurance Project Plan a second
portion of the cap rock sample with the highest initial PCB concentration was subjected to
water washing remediation and analyzed for PCBs Separate portions of the trench rock
samples were subjected to dry tumbling for ten and thirty minute intervals and water washing
for ten and thirty minute intervals The remediated rocks were then analyzed for PCBs
The dry tumbling and water washing were performed using an electronic rotary device The
rock samples were placed in clean two liter plastic sampling containers with screw cap
closures Laboratory distilled deionized water was poured into the water wash test
containers while the dry tumble samples had only the rocks enclosed
38 c
c 23 RESULTS
The one-inch average diameter trench rocks were initially contaminated with 1800 mgkg of
Aroclor 1254 Because the one-inch trench rocks were above the 10 mgkg cleanup standard
sample portions of the rocks were processed step by step through each of the four
remediations Although an eighty five percent reduction in PCB contamination was achieved
between the initial and final remediation samples the final concentration of 270 mgkg is still
well above the cleanup standard The results however showed a trend with the highest
concentration of PCBs detected on the initial sample lower PCB concentrations with the
ten-minute remediation and the lowest PCB concentrations achieved with the longest
thirty-minute remediation as expected The results for the one-inch trench rocks are
presented in Table 2-1
The two-inch average diameter rocks showed results similar to those of the one inch size
The initial sample had a concentration of 2500 mgkg of Aroclor 1254 The best
remediation result obtained was 450 mgkg for the ten-minute water wash sample A thirty c minute water wash sample for the two-inch trench rocks was not conducted when it became
apparent that a 10 mgkg cleanup level could not be obtained Because the 10 mgkg cleanup
level was not achievable the thirty minute water washing of two-inch rocks was not
conducted to minimize the level of effort and analytical costs The PCB result for the
thirty-minute dry screened sample 1900 mgkg Aroclor 1254 was higher than expected
This result was counter to the trend that was expected and observed with the one-inch rocks
and it demonstrates the non-homogenous nature of the rock samples This trend breaking
analytical result caused by the heterogenous or nonuniform nature of the rock sample matrix
was not repeated because the cleanup level could not be achieved The results for the
two-inch trench rock samples are presented in Table 2-1
The three-inch average diameter trench rocks yielded markedly different analytical results
The initial sample prepared with minimal on- site screening had a PCB concentration of
75 mgkg below the cleanup standard of 10 mgkg Although the initial result was below
39 c
TABLE 2-1 TRENCH ROCK WASHING RESULTS
Trench Rocks 1 inch Average Diameter
PCB Concentration
Sample mgKg
Initial sample 1800
Ten minute dry screened 620
Ten minute water wash 880
Thirty minute dry screened 290
Thirty minute water wash 270
Trench Rocks 2 inch Average Diameter
PCB Concentration
Sample mgKg
Initial sample 2500
Ten minute dry screened 490
Ten minute water wash 450
Thirty minute dry screened 1900
Trench Rocks 3 inch Average Diameter
PCB Concentration Sample mgKg
Initial sample 750
Ten min dry screened 210
Ten min water wash 025 UJ
Aroclor 1254 was the only PCB detected UJ - The sample was nondetect for PCBs to the estimated detection limit
of 025 mgKg
40
the cleanup standard it was close enough to warrant the first ten minute dry tumble c remediation step The first remediation step with a PCB concentration of 21 mgkg
confirmed that the three-inch trench rocks are less contaminated than their smaller
counterparts The three-inch ten-minute water washed sample was not submitted for fiill
quality control PCB analysis in an effort to minimize analytical costs The ten-minute water
washed sample result is from a partial quality control PCB screening analysis and is reported
as estimated Because of the lag time in tumaround of analytical results this sample had
been prepared extracted and screened and the information was available therefore it is
presented herein The results for the three inch average diameter rocks are presented in
Table 2-1
Six samples of cap rocks were collected and analyzed for PCBs AU of the results were less
than 02 mgkg or 200 xgkg For these cap rock samples an action level of 50 xgkg was
established in the Quality Assurance Project Plan The 50 xgkg value is an action level
established by EPA for this study only and is not a cleanup level identified in the ROD The
action if the results exceeded 50 igkg was to water wash the most highly PCB contaminated c sample Water washing was performed on cap rock sample number two The initial result
for this sample was 150 xgkg while the ten minute water washed sample yielded 24 igkg
Aroclor 1254 The cap rock results showed fairly consistent PCB concentrations in the range
of 50 to 150 igkg Aroclor 1254 The results are presented in Table 2-2
24 CONCLUSIONS
The cap rock samples were all determined to have PCB concentrations approximately one
hundred times less than the cleanup level of 10 mgkg Water washing conducted on the
most contaminated cap rock sample removed approximately eighty five percent of the PCBs
initially present These cap rock samples contained some fine soil like material which was
perhaps windblown carried on tmck tires or created by friction This material contributed
to the measured PCB concentrations for the cap rock samples
41 c
c TABLE 2-2 INTERIM REMEDIAL CAP ROCKS ANALYTICAL RESULTS
LOCAiSifi iiiiiiiiiiiiiii--iiiiiiiiiiiiiiiiiiiiidiiiiiiliiiiiiiii^ 10 minute Water Wash iiiii|ijii|iiii|iii^ PCB Concentration (ligKg)
1 120 NA
2 150 24
3 110 NA
4 31 U NA
5 86 NA
6 71 NA
Notes Aroclor 1254 was the only PCB detected U - Sample was nondetect for PCBs to the reported
detection limit - The highest initial PCB concentration cap rock sample was
subjected to a ten minute water wash remediation
42
C
The results of the rock tumbling and water washing demonstrate that this form of remediation r will not achieve the cleanup level of 10 mgkg for the one-inch and two-inch average
diameter overburden rocks The three inch rocks are below the cleanup level without
remediation It should be noted that these overburden rock samples were coUected from one
of the most highly contaminated areas at the site based on the remedial investigation results
These samples therefore represent worst case conditions
The dry tumbling remediation steps did not remove aU of the adhered soU particles as
anticipated This adhered highly PCB contaminated soU contributed to the measured rock
surface PCB concentration because the PCBs were extracted from the soU as weU as the rock
surface during sample preparation
The water wash remediation was effective in removing aU of the adhered soU The results
indicate that the rock surface and near surfaces have been contaminated with PCBs which
cannot be removed by water washing but are extractable with acetonehexane
c During the trench rock coUection ample one-inch and two-inch average diameter rocks were
avaUable at shaUow depths The trench had to be dug deeper to obtain the three inch size
rocks Because of the relative immobiUty of PCBs in soU the PCB concentration decreases
with depth as reported in the remedial investigation This decrease in PCB concentration
with depth is part of the explanation as to why the three inch rocks showed less
contamination than the smaUer sizes Also a factor is the surface area to mass ratio As the
mass of the rock increases the surface area to mass ratio decreases Since the PCBs are on
the surface or near surface of the rocks as the relative surface area decreases with size or
mass the reported concentration wiU decrease correspondingly
During the trench excavation and overburden rock coUection a two- to three-inch lens of
dark oUy appearing materials was observed This material was analyzed with a PCB field
screening kit and found to contain in excess of 10000 mgkg PCBs Some of the one and
two-inch diameter rocks sampled appeared dark in color Because it was not known whether
43 c
c
the dark rocks were naturaUy colored or from the tarry lens and to keep the study unbiased
these dark rocks were sampled randomly with the remaining rocks The dark appearing
rocks were estimated to comprise approximately five percent of the one and two-inch rock
sizes Inclusion of highly contaminated rocks in the samples would boost the reported PCB
concentrations
Altemative remedial measures other than rock tumbUng and water washing include detergent
and water washing organic solvent washing or steam cleaning Although preUminary
indications from the solvent extraction vendors are that only up to one inch size rocks can be
handled the possibiUty of designing a treatment system to handle larger rocks wiU be
explored during the design phase of this project If the size of the rocks precludes them
from remediation by solvent extraction along with contaminated soUds a rock cmsher wiU be
employed to reduce the contaminated rocks to a size that can be handled Although other
altematives for rock remediation might work solvent extraction with contaminated soUs or
rock cmshing foUowed by solvent extraction appear to be the easiest most cost effective
means to achieve the cleanup standards Whichever remedial altemative is selected rock
washing would only be necessary on rocks with average diameters between one and two
inches coUected from soU highly contaminated with PCBs A very rough estimate of rocks
onsite between one- and two-inch diameters is approximately 5000 tons No remediation of
the rocks is necessary if the solvent extraction technology can handle two-inch size rocks
44 c
c LIST OF FIGURES
Figure Page
I-l Treatability Study Sampling and Analysis Schematic 8
1-2 Groundwater and Trench and Cap Rock Sampling Locations 11
1-3 Proposed Groundwater Treatment System Schematic 30
c
c u
r LIST OF TABLES
Table Page
1-1 Summary of PCB Results for Phase I Treatability Study Samples 3
1-2 Comparison of Organic Contamination in Groundwater to Effluent Discharge Levels - Temporary Discharge to the Neponset River 4
1-3 Comparison of Metal Contamination in Groundwater to Effluent Discharge Levels - Temporary Discharge to the Neponset River 5
1-4 Treatability Study Sampling and Analysis Summary 9
1-5 Groundwater SampUng Summary 12
1-6 Aeration Test Operations 16 r 1-7 CLP Treatability Study Sampling Summary 17
1-8 Preliminary Polymer Testing Results 20
1-9 FuU-Scale TreatabUity Study Jar Test Results 21
1-10 Metal Hydroxide Sludge Resuhs 23
1-11 FUtration Study Results 24
1-12 FuU-Scale TreatabUity Study Air Stripping Results for WeU MW-IA 25
1-13 FuU-Scale Treatability Study Air Stripping Results for
WeU ME-8 26
1-14 FuU-Scale Treatability Study Carbon Adsorption ResuUs 27
1-15 FuU-Scale Treatability Study Aeration and Carbon Adsorption Results 29 c m
1-16 Comparison of Inorganic FuU-Scale Treatability Study ResuUs to MCLs and Discharge Levels - Discharge to c the Neponset River 31
1-17 Comparison of Inorganic FuU-Scale Treatability Study ResuUs to MCLs and Discharge Levels shyDischarge to Meadow Brook 32
1-18 Comparison of Organic FuU-Scale Treatability Study ResuUs to MCLs and Discharge Levels shyDischarge to the Neponset River 33
1-19 Comparison of Organic FuU-Scale Treatability Study Results to MCLs and Discharge Levels shyDischarge to Meadow Brook 34
2-1 Trench Rock Washing Results 40
2-2 Interim Remedial Cap Rock Analytical Results 42
( w
IV c
Section One
10 GROUNDWATER
11 INTERIM STUDY
111 Introduction and Objectives
Performance of the pumping test phase of the hydrogeologic investigation at the Norwood
PCB site resulted in the accumulation of approximately 25000 gaUons of contaminated
groundwater In order to properly dispose of this contaminated groundwater a Phase I bench
scale treatabUity study was undertaken The objective of the treatabiUty study was to
determine whether two unit operations filtration and carbon adsorption would be effective
in treating the contaminated groundwater so that it could be discharged to the Neponset River
under a temporary permit without any adverse effects to human health or the environment
112 Description of Work
c On August 28 1991 a sample of groundwater was coUected from the Norwood PCB site for
use in the Phase I bench-scale treatability study The sample was coUected from WeU
MW-IA one of the most contaminated weUs at the Norwood PCB site The Phase I
groundwater treatability study was conducted and sample analysis performed during
September 1991 at Hydrosample Laboratory in Northboro Massachusetts
The groundwater sampling and the generation of the treatability samples was conducted in
accordance with the Interim Pre-Design Work Plan No 3 Phase I for the temporary
groundwater treatment plant Three different pore size or particle retention grades of fUter
paper were evaluated for filtration rate and PCB removal The coarse Whatman filter had a
pore size of 10 microns the medium had a pore size of 5 microns and the fine had a pore
size of 1 micron These sizes were chosen because they are the smaUest commerciaUy
avaUable sizes The filtration unit operation was evaluated both as the only treatment
technique and as the initial operation in a filtration carbon adsorption treatment scheme
1 c
c
c
For an evaluation of the carbon adsorption unit operation samples of the three fUtrates were
percolated through a 1 glass column charged with Calgon brand activated carbon Calgons
powdered activated 325 mesh carbon was recommended by Calgon for use in the bench-
scale studies because it decreases the contact time required for adsorption and can be filtered
out of the groundwater with a 045 micron pore size filter Each fUtrate was subjected to the
same carbon treatment The flow rate through the carbon column was adjusted to simulate
the fuU scale onsite carbon adsorption flow rate
113 Results
The results of the Phase I treatability study showed that PCBs the contaminants of greatest
concem were not removed by the filtration unit operation when it was employed as the only
treatment technique This indicates that the PCBs were dissolved or adhered to suspended
material finer than the smaUest commerciaUy avaUable filter pore size and that filtration
alone carmot remove PCBs to the cleanup level Activated carbon is necessary to achieve
PCB cleanup levels
The PCB results from the filtered carbon adsorbed samples indicated that the carbon
removed aU of the PCBs to a concentration of less than 05 xgL The analytical data was
vaUdated using the Data QuaUty Objective (DQO) Level HI criteria outlined in the
Groundwater Bench-Scale Phase I treatability Study QuaUty Assurance Project Plan (QAPP)
All of the analytical data was determined to be vaUd The PCB analytical resuUs are
presented in Table 1-1
One sample of the treated groundwater discharge from the interim treatment operation was
coUected on November 25 1991 The sample was analyzed and found to contain less than
050 jugL PCBs This sample was also analyzed for the twenty three Target Analyte List
(TAL) metals All of the metals concentrations were below the discharge limits calculated
based on AWQC and the flow rate of the discharge and the Neponset River See Tables 1-2
c
c
c
TABLE 1-1 SUMMARY OF PCB RESULTS FOR PHASE I TREATABILITY SAMPLES
Phaie I RI umpling conducted in May 1988 Phaae II RI lampling conducted in April 1989
NC bull No criteria cxitta for thia compound
(1) Inaufficient Data to Develop Criteria Value preaented ia LOEL shy Loweit Obierved Effect Level
(2) Value preaented for carelnogeiia ia the 10-5 level
(3) Value preaented ia for dichloroethenea
(4) Value preieoted ia for trana 12-dichloroetliene
(5) pH dependent criteria (78 pH uted)
(6) Value preaented ia for chlorinated benzenea
(7) Value presented ia for total PCBa
(8) Effluent DiKhaige Limit based upon an effluent discharge of 5 gpm to the Neponset River during the 7-day low flow lOyr recurrence (2O20gpm)
USGS Pleasant Street Oauging Station on the Neponset River
(9) Dilution factor =[(5gpm+2020gpm)5gpml= 405
(lO)Concentration exceeds effluent discharge limit contaminant must be removed by Groundwater Treatment Plant before discharge to surface water [D=DAILY MAX A=AVG MONTHLY F=FISH]
-
-
-
- - -
-
-
-
-
-
o n o TABLE 1-3 COMPARISON OF METAL CONTAMINATION IN GROUNDWATER WFTH EFFLUENT DISCHARGE LEVELS - DISCHARGE TO THE NEPONSET RIVER
bull bull bull bull bull bull bull bull bull bull bull bull - bull bull bull bull gt gt bull gt bull bull bull bull bull - bull bulliii|vO|| iS iggJMLnei i iaD s-UNFILTEREDgssHis M-B33nsRmmMMM D A I L Y iiiiiiiiiiiiiAVGiiiiii |i mmmmMmmm Xy lira^li P H A S E I WtiiMM liwiAiiiii iiiiimiii iii-pHiwiiliiiii WampMM P H A S E I ilii iiwgiiiiiiiiiiiiiiiii|iiiii iiiiiiiiiiiiiiiiiiiili|i| iiii iiiiii iiiiiiiiiiiiiiiiiiii M A X I M U M iiiiipifriiii^iiii iiiiiiiiiiiiifiiii iiiiiiiiiiiiiiiii
555^gt5^5V555^^^^ i i i ilaquoiij S U R F A C E m m m Wtm^itM B E D R O C K bull bull gt f t bullbullbull B E D R O C K iiiFRiiliiiiiiiiiiiii iiiiiiijsiiiiiriiiiiiiiiiiiiiiii iiii|iiiiiiliiiiiiii E F F L U E N T E F F L U E N T E F F L U E N T iiiiiiiiiiiiiiiiii wmmm |||ii||li| |i IliAiiiiil WliampiMM liiiiltiilii^isiiii liiiiifctAXliii iiiAiiiiiiiiiiiiiiiii i^i^iibhreiiiiiiiiiiliiiiiiii liiiiiii iiHiiiiiiiiiiiiii- D I S C H A R O E D I S C H A R O E D I S C H A R O E iiiii imm^mi mmmn WmMm WBrnB
PARAlt4ETER W iMmm iiiiiiiii iiitjiiiii Wi^MMM iiii iiiiiiiiilii iiiaraquoliiii W-imMMi iiiiiiaiiiii mMmmmm iCSiiMAiiiiii O O N S U M P iiiiiiiVEitiiii liiiiisyifeEiiiiiiiii iiiiiiiiiitiiiiL iiii cii^i iiiiiifl|5iili iiiiiiili (UOW iiiiiiii (oon) iiiiult3piili (UOL) lzMcii0m (UGL) iipiiiiiiiiiiiiiiiiiiiiii ii|^(Siliiiiiiiiii|iiiiii (UOL) (2) (UOL) (6)C7) (IKJL) (6)C7) (UOn) (6) C7) i^iipi
M E T A L S
A h m i n u m 154000 390000 119 352 12500 43900 74 77 NA NA NA NC NC NC
fMgtimi-^ztm zmisectmi iMiMM wmmi M^iiiiampii iiJiiM 189 iiiiiiiiiisiiiiiilaquo3iii iiiiiiiiiiiiiiiiiiiiiifii iiiiiiiiiiiliiiii^-iiiii isiiiiiiiiiiisiiiii CJiiiiiijiii iiiiiiiiiiiiiStCiiiiiii iiiiiiiiiiiiiiiiiiiiiiiiiiiiM bullsiiiii iiiiiiili5 iiiiiiiiiiiiiii|iiiiiiiiiigtireii iiiiiiii-shy bull bull bull bull bull bull bull bull bull iiiiiiliiiiiiWiii bull bull laquo raquo - iiiiiiiiiililiiiiiiiilifii iiiiiiiiiiii iii|iiiiiiiiiiiiiiii l i i i i i i i i i i^ i l l l i s i i iiiiii i-iiiiiiiSiiiiiiisiiii iiiiiiiiiiiiiiiiii|fltii- 405000 iiiiiiiiiiilliiiiiiiiwii iiiiAiiishymBmmm imampmm WmMM Wimm iiiiillili iiiiiiiiliiiiiii
Lead 43 i t3 21 168 l i 37 30 168 14 (3) 054 p) NC 5670 219 NC
iiititlj^iusibiii^j iilllJii^ -M-W^M iiiiiiii^^i^ ii-|7laquo- L5W iiiiiiiiiiiiiilliiifii iiiiiiiiiiiiiiiltiiiiiiiiiiiiliiiiii ii5iiiiiiie iiiiiiiiiiii bullbull bull l t raquo iiiiiiiiiiiiiiiNC iiiiiiii isci i i i | | i i i | | i p i i II0M^I iiiiiliiiiiiiiilii WM^MmM ilillilflil i | | | l il |o| | l i i l i P liiiiiiiiii iiiiiiiiiiiiip8iii bullbull ( U si i l i l i iiiiii- iiii-li|i5 iiiiiiiiiiiiiiiiiiii iiiiiiiiiiipiiiiiiii-iiiiiiiiiiii -i- o-iil bull iiiiiiiiiiiiiiiiiiiiiiiiiiiM iiiiiiiiiiiiii iiiii iiiiii iiii iiiiii laquoiii
|i|||ii Iliii illl|iillSI |illliSl^| illillaquoii iiiiiiiiiiiiiiiiiiii iiiiiiiiiliiltiii laquo raquo iiiiiiiiiiiii||i||| iiiiiiiiiiiiii iii|i|ltoigttiiiiiiiiiiiiiiii i iiliiiiilii iiiiiiiiiiiii bull^bull i l iNc| i-|iiiii -i-iii ii gti5 i iiiiiiiili^^ iiiiiiiiiiii Oiiiiiiii|i bulliiiiiiii Sodium 14100 28900 12500 26raquo00 16320 33200 16300 68000 N c NC NC Nc NC Nc Thal l ium 10 10 58 10 1400 (1) 40 (1) 32 567000 16200 1296
igtPiiiilli MmmmiM liilililil iiliiiiisii iii|ii| bulliiii iiiiiisiiilii iiiiiiiiiiiii|i ii^|i iiiiiiiiiil iiiiiii iiiiiiii ii^iliiiiiiiNiilliiiiiiiji- bulli|iiiiiflaquoSiiiiiiiiiiiiiiiiii iii|lNe-|i-ii iiiiiiiiiisiiiiiiiiiiiiiiii Nc iiiiiii liiNCii iiiiiii iiiiiiiilifiei iiiii iiiiiii iilaquo|||il| mmmmi m m m i M iiiiiiiili iiiiiiiiiiiiiiiiisil i iiiisiiiiilllii iiiiliiiiiiiiliiiiiiiiiitii iiiiiiiiiiiiiiiiiiiiiiiiiiifiii iiiiiiliili-|s4ii iiilliiiiiiii ssiiiiiiiiiiiiii iiiiiiii^^iii-iiiii iiiiiiiiiiiiiiiiiiiiiiiliii i iiiiiiiiiiiiiiliiiiiiii 13365 iiiiiiiliiiiiiiiiiiiip^ P b a i e I RI sampling conducted in M a y 1988 Phase II RI samplmg conducted in Apri l 1989
N C = N o cri teria exiata for th is compotmd
N A = N o t Available
(1) Insufficient Data to Develop Cri ter ia Value presented is L O E L - Lowest Observed Effect Level
(2) Value preaented for careinogena ia the 10-S level
(3) Hardness dependent c r i te r ia (25 mgA C A C 0 3 uaed)
(4) Value presented is for Ihe m o r e toxic hexavalent form
(5) Value presented is proposed (more conservat ive)
(6) Effluent Discharge L imi t dilution factor based upon an effluent discbarge of 5 gpm to the Neponse t River during the 7 - d a y low flow lOyr recurrence (2020gpm)
USOS Pleasant Street Oaug ing atation on the Neponset River
(7) Dilut ion factor =[(Sgpm+2020gpm)Sgpm]= 405
(lO)Concentration exceeds effluent discharge limit contaminant must be removed by Groundwate r Treatment Plant before discharge to Ihe Neponset River [ D = D A I L Y M A X A = A V O M O N T H L Y F=FISH]
c and 1-3 for effluent (Uscharge limits for organic and inorganic compounds An acute toxicity
test showed that no toxic effect was observed for the interim treatment discharge
114 Conclusions
Based on the results of the Phase I bench scale treatabUity study the combined unit
operations of fUtration foUowed by carbon adsorption were effective in treating the
contaminated groundwater coUected during the pumping tests for temporary discharge to the
Neponset River A sample of the discharge was coUected during the groundwater treatment
and it was found to contain less than the quantitation limit of 05 xgL of PCB The metals
concentrations were aU determined to be below the discharge criteria A sample was also
coUected and submitted for an acute toxicity determination The resuUs showed that no toxic
effect was observed The bench scale treatability results and the on-line discharge analyses
demonstrate that the filtration and carbon adsorption unit operations were effective temporary
treatment techniques
^ 12 FULL SCALE STUDY
A groundwater treatability study was conducted to evaluate the performance of four different
treatment processes on contaminated groundwater obtained from the Norwood PCB site The
contaminants present in the groundwater were determined during previous studies conducted
in May 1988 and AprU 1989 by EBASCO Chapter 1 of the Final FeasibUity Study
(EBASCO 1989c) contains an overview of the results obtained during these investigations
Based on the resuUs of the May 1988 and AprU 1989 field investigations EPA concluded
that the overburden and bedrock aquifers beneath the site were contaminated with
polychlorinated biphenyls (PCBs) and volatUe and semivolatile organic compounds (VOCs
and SVOCs) It was determined that surficial and subsurface soUs dredge pUes of sediments
taken from Meadow Brook sediments in Meadow Brook and sediments in the drainage
system of the buUding operated by Grant Gear were the sources of the contamination In
r
c September 1989 EPA released the Record of Decision (ROD) for the Norwood PCB site In
the ROD EPA directed that groundwater be treated with a system including activated carbon
air stripping with vapor controls and precipitationfiltration iEPA also directed that
treatability studies or pUot studies be conducted to aid in the overaU design of the system
In accordance with the ROD a bench scale treatabUity study was conducted at the ENSECO
Laboratory Facility in Cambridge Massachusetts by Metcalf amp Eddy personnel between
January 14 and February 16 1992 This report presents a description of the work
completed resuUs and conclusions of the study
121 Objectives
The fuU-scale groundwater treatability study was conducted to determine if treatment
consisting of precipitation fUtration air stripping and carbon adsorption would effectively
remove the contamination present in the groundwater at the Norwood PCB site to appUcable
standards Information on the percent reduction of organic and inorganic compounds in the
groundwater volume type of residual and byproducts produced by each component were
also investigated A schematic detailing the treatability study and the sampling and analysis
conducted is presented in Figure 1-1
122 Description of Work
The treatability study was performed in accordance with Pre-Design Work Plan 3 and the
QuaUty Assurance Project Plan for the Phase n Bench-Scale TreatabiUty Study (Work
Plan 3)
Groundwater samples were coUected from the Norwood PCB site for use in this
investigation Interim sampling was performed on effluent streams generated from each
bench-scale process for analysis according to Table 1-4 Influent and final effluent samples
generated during the groundwater treatabiUty were coUected and analyzed through the CLP
^
o JAR TESTING SAMPLE ID
o
POLYMER TESTING
RAW GROUNDWATER
VOL 1 SVOL I p PCB f ^ ^ METALS
mdash SST
T
T
T
SS - Choose Polymer T ar)d Dose Estimate pH pf i After Coagu lant
Jar Test 1 PH10 bull
Lime wCoag wPdymer - SS T Metals
Ume wCoag wo Polymer - SS T Metals
- NaOH wCoag wPolymer - SS T Metals
NaOH wCoag wo Polymer - SS T Metals
Jar Test 2 pH9
Jar Test 3 pH8
bull
Lime w C oag wPdymer - SS T Metals
- Lime wCoag wo Polymer - SS T Metals
- NaOH wCoag wPolymer - SS T Metals
NaOH wCoag wo Polymer - SS T Metals
- Lime wCoag wPolymer - SS T Metals
- Lime wCoag wo Polymer - SS T Metals
- NaOH wCoag wPolymer - SS T Metals
- NaOH wCoag wo Polymer - SS T Metals
JT1 -1 shy
j r i -2 shy
JT1 -3 shy
JTI-4
j r 2 - 1
JT2-2 shy
JT2-3
j r2-4 bull
JT3-1 shy
JT3-2shy
JT3-3 bull
JT3-4 shy
HLTRATION TESTING
RIter Paper 1 - SS T Time mdash |
RIter Paper 2 - SS T Time-
Rlter Paper 3 - SS T Time -
CtHXise Filter Paper or Particle Retention Size
Sample Well Using Bailer
VOL SVOL PCB CLPMETALS (PPF-1)
Precipitate and Filter Using Optimized Polymer pH Coagulant and Filter
system for volatUes semivolatUes PCBs and metals AU interim samples were analyzed at
ENSECO in Cambridge Massachusetts AU data was vaUdated by MampE according to the
QAPP
1221 Groundwater Sample CoUection Groundwater for this study was coUected from
weUs MW-IA and ME-8 as shown on Figure 1-2 iMW-lA was chosen as a sampling
location because it was determined to be one of the most contaminated weUs on-site based
on previous investigations During the course of the treatabiUty study a decision was made
to obtain samples from ME-8 because results of the most recent sampling effort conducted by
ICF indicated that groundwater from this weU contained approximately 200 xgL vinyl
chloride whereas groundwater from MW-IA no longer contained any quantifiable amount
Removal of vinyl chloride by aeration needed to be demonstrated during this investigation
because vinyl chloride is not effectively removed by carbon adsorption
Groundwater samples were obtained on four separate occasions during the study as shown in
Table 1-5 On each occasion the groundwater was coUected in accordance with the Field
Sampling Plan Three weU volumes of water were purged from the weU using a centrifiigal
pump before any samples were coUected The pH temperature and conductivity of the
purge water was measured after each weU volume untU the measured values differed by less
than 10 for three consecutive samples to ensure the sample drawn was representative of the
water in the aquifer Samples for the metals precipitation and filtration study were coUected
using a centrifugal pump Samples for the air stripping and carbon adsorption study were
coUected with a teflon baUer to minimize aeration and possible loss of volatUes during
sample coUection
The samples were coUected in one gallon amber glass bottles and stored at 4degC Each
sample bottle wasfiUed to exclude a headspace in the bottle
e 10
200 200
SCALE IN FEET
D CAP ROCK SAMPLE LOCATION
bull WELLS
nOURE 1-2 GROUNDWATER AND TRENCH AND CAP
ROCK SAMPLING LOCATIONS
11
E T C A L F a EDDY
c TABLE 1-5 GROUNDWATER SAMPLING SUMMARY
Mode of Date WeU Amount Sampled pH Temp degC Conductivity SampUng
11392 MW-IA 10 gallons 62 8deg 220 umhocm pump
12792 MW-IA 16 gaUons 62 8deg 220 umhocm baUer
20392 MW-IA 16 gallons 62 8deg 220 umhocm baUer
20592 ME-8 2 gallons 64 8deg 230 umhocm baUer
1222 Precipitation Testing
General Chemical precipitation for the removal of metals was evaluated at three pH values
and three polymer dosages to determine the effectiveness of the treatment A preliminary
evaluation of different coagulants and polymers was conducted at three pH values by
r Metcalf amp Eddy personnel and a leading polymer vendor to determine which chemicals could
potentiaUy be used to precipitate groundwater Based on the results from the preliminary
evaluation jar tests were conducted by Metcalf amp Eddy personnel to aid in the determination
of the chemical dosages required to optimize the effectiveness of precipitation
Polymer and Coagulent Testing Polymer testing was performed by Metcalf amp Eddy and a
leading polymer vendor at the ENSECO laboratory faciUty in Cambridge Massachusetts
The effectiveness of anionic cationic and nonioiuc polymer was evaluated at three pH
values The best polymer was determined to be Drewfloc 2270 a low charge anionic high
molecular weight polymer This polymer was used in jar tests 1 through 5 The best
coagulent was determined to be Charge Pack 12 (CP-12) a higher charge cationic low
molecular weight coagulent The CP-12 coagulent was used in jar tests 1 through 5
described under jar testing
12 c
InitiaUy the effects of varying the pH of the groundwater sample was investigated Tests c were conducted at pH values of 80 90 and 100 with sodium hydroxide which had the best
settling characteristics based on visual observation and turbidity measurement Each polymer
was then tested at pH = 100 to evaluate Us effectiveness under optimum pH conditions
A formula of polymer and coagulant addition was developed based on visual observations
suspended soUds and turbidity analyses performed on each sample generated during the
investigation The anionic polymer effectively flocculated the existing smaU suspended
particles and the addkion of cationic coagulant removed iron and color when the pH was
raised to 100
Jar Testing Five jar tests were performed using the polymer and coagulants determined to
be effective during preliminary testing Jar tests 1 and 4 were conducted as dupUcates at
ph 10 Jar test 2 was conducted at pH 9 jar test 3 was conducted at pH 8 and jar test 5 was
conducted at pH 10 On each occasion prior to beginning the jar test the raw groundwater
was brought tol5deg-17degCina warm water bath The temperature was held constant to c eliminate the effects of temperature on reaction rates and solubUity
The foUowing is a description of activities conducted during the jar tests fti through 4 See
Figure 1-1 for details Four samples were evaluated during each jar test For each jar test
four 15 Uter beakers were fiUed with 1 Uter of raw groundwater The beakers were placed
on the stirrer platform and the paddles were lowered into the sample The jar stirrer was
operated at 80 revolutions per minute (rpm) The pH was then adjusted to the desired value
(pH = 10 9 8 10 for Tests 1 2 3 4) with a lime slurry in two samples and with a
sodium hydroxide solution (25) in the remaining two samples Lime was added to
investigate its effects on the precipitate and to evaluate its effectiveness in pH adjustment
The cationic coagulant was then added to each sample untU the concentration in solution was
30 mgL The solution was stirred at 80 rpm for 2 minutes to ensure complete mixing The
polymer was then added to one sample pH adjusted with sodium hydroxide and one sample
pH adjusted with lime Mixing continued for two minutes Next the solution was stirred
13 c
slowly orflocculated for five minutes at 20 rpm FinaUy the solutions were aUowed to
c settle for 10 minutes Visual observations were recorded and samples were submitted for
suspended soUds turbidity and metals analyses
Jar test 5 was performed to assess the removal of manganese and aluminum by preaeration
and permanganate additions (see Figure 1-1) Because no significant benefit was observed in
the previous tests when lime was used instead of sodium hydroxide sodium hydroxide was
used to adjust the pH in aU four samples to a pH of 100 in jar test 5 Only sodium
hydroxide was added to the groundwater in the first jar to determine the removal of
manganese and aluminum attributable to the formation of an insoluble salt at high pH
Sodium hydroxide and polymer were added to the second jar to evaluate the effectiveness of
the polymer Sodium hydroxide polymer and coagulant were added to sample 4 The
supemate from sample 4 was then fUtered This was performed to determine if the required
removal efficiencies could be achieved by chemical precipitation and filtration
Permanganate was added to sample 3 in addition to sodium hydroxide coagulant and
polymer to determine if the manganese and aluminum present could be chemicaUy oxidized c to a less soluble state which would enhance the efficiency of fUtration The supemate was
then siphoned off using clean tygon tubing and a syringe into the sample containers
Samples were submitted for metals suspended soUds and turbidity as illustrated on
Figure 1-1
1223 Filtration Testing A bench-scale filtration study was perfonned to determine the
optimum pore size of filter media that could effectively remove the suspended soUds in the
precipitated groundwater The determination of the removal efficiency for each filter was
based on the concentration of suspended soUds and turbidity of the filtered water The time
required to filter the groundwater was also evaluated
Prior to filtration the metals in the groundwater were precipitated and coagulent and polymer
were added using the optimum conditions developed during the precipitation study The
optimum conditions consisted of pH adjustment to 10 with sodium hydroxide addition of
14 c
coagulent CP-12 to a concentration of one percent and addition of Drewfloc 2270 polymer to
c a concentration of 10 mgl Three grades (10 xm 5 xm and 1 xm pore sizes) of filter
paper were used with a Buchner ftmnel to filter aUquots of the precipitated groundwater
Samples of the filtered water were submitted to ENSECO for suspended soUds and turbidity
analysis
A sample of the metal hydroxide sludge was coUected during the treatability study The
sludge sample was submitted to the CLP system for PCB and metals analysis so that a
characterization of the sludge could be made and disposal options could be evaluated
1224 Air Stripping Testing Precipitated fUtered groundwater was aerated at three
different air to water ratios to determine the most effective stripping ratio To ensure that
worst case volatUe organic compound concentrations were present in the samples for this
study some modifications were made in how the sample was coUected and treated First
the groundwater was coUected with a baUer to prevent the loss of volatUes AdditionaUy the
water was fUtered under positive pressure foUowing the precipitation step to minimize the c loss of volatUes that would result if the water was filtered using a vacuum pump
An aquarium pump tygon tubing and aeration stone with a glass-fiber fUter cartridge was
used to aerate 1-Uter aUquots of precipitated and filtered groundwater The aeration flow
rate was caUbrated by filling a graduated cylinder with air that had been filled with tap water
and inverted in a water bath The air was diffused at 375 missec into 1-Uter aUquots of
groundwater and the time measured as iUustrated in Table 1-6 The aerated groundwater was
submitted to ENSECO for volatUe organics analysis
1225 Carbon Adsorption Testing The effectiveness of activated carbon for the removal
of organic compounds in the groundwater at the site was evaluated The carbon used was
the powdered activated 325 mesh carbon suppUed by Calgon Corporation The groundwater
samples used for this investigation were obtained and filtered as described in the air stripping
15 c
c
c
TABLE 1-6 AERATION TEST OPERATIONS
Air to Water Ratio Volume Volume of by Volume of Water Air Reqd Min of Aeration
251 1000 ml 25000 ml 111 501 1000 ml 50000 ml 222 751 1000 ml 75000 ml 333
section of this report to minimize the loss of volatUes A total of twelve samples were mn
during this investigation The necessity of air stripping was investigated by comparing the
resuUs from four samples that were air stripped to seven samples that were treated identicaUy
with the exception of air stripping AU samples for the air stripping comparison went
through the precipitation filtration and carbon adsorption processes AdditionaUy one
sample was prepared with no carbon added to serve as an untreated sample The samples are
summarized in Table 1-7 Each groundwater sample was prepared and mixed with a
predetermined dose of Calgon powdered 325 mesh activated carbon and placed m an open
Erlenmyer flask on a shaker table for a two-hour time period at 180 rpm A rotary shaker
table capable of accommodating twelve (12)-1000 ml Erlenmyer flasks was used Effluent
was fUtered with a barrel filter using a glass-fiber pre-fUter and a Whatman 45 micron
membrane The effluent clear and odorless in aU cases was added to sample containers
preserved and packed for shipment to CLP laboratories Since the shaker table could
accommodate 12 flasks a total of approximately 4 gaUons of effluent was generated during
each mn Several mns were performed to generate adequate quantities of sample for
analysis accordmg to Table 1-7 Groundwater was simUarly prepared for submittal to
Aquatec Lab in Burlington Vermont for chronic toxicity testing Three (3) shipments of
approximately 2 gaUons each were made
r 16
C) o o TABLE 1-7 CLP TREATABILITY STUDY SAMPLING SUMMARY
Dose g of Carbon Required of mis in gs Carbon
Sample ID 1000 ml of GW Analysis Volume mis Flasks Flasks in each
Precipitation Filtration Aeration amp Carbon
AC-1 05 V SV MET 3400 3 1067 054 AC-2 20 V SV PCB 4400 4 1100 22 AC-3 50 V SV MET 3400 3 1133 57 AC-4 100 V SV PCB 4400 4 1100 110 AC-5 Trip Blank 0 V
Precipitation Filtration amp Carbon
C-0 0 V 500 1 500 0
C-1 05 V SV MET 3200 3 1067 053
c-2 10 V PCB 2200 2 1100 11
C-3 20 V SV CT 29000 24 1250 25
C-4 50 V SV PCB 4400 4 1100 55
C-17 70 V MET 1200 1 1200 70
C-18 100 V SV 2200 2 1100 110
C-13 Treatability Blank 0 V PCB 2200 0 0 0
C-20 Trip Blank 0 V 0
C-10 Duplicate of C-1 05 SV 2000 2 1000 05
C-1 05 (MSMSD) 500 1 500 025
C-11 Duplicate of C-1 05 MET 1000 1 1000 05
C-20 Duplicate of C-2 10 V PCB (MSMSD)
4400 4 1100 11
C-16 Duplicate of C-4 50 PCB 2000 2 1000 50
C-6 0 PCB 2000 2 1000 0
17
o o n TABLE 1-7 (Continued) CLP TREATABILITY STUDY SAMPLING SUMMARY
Dose g of Carbon Required of mis in gs Carbon
Sample ID 1000 ml of GW Analysis Volume mis Flasks Flasks in each
Precipitation amp Filtration
PPF-1 V SV MET PCB 2000 2 1000 0
Sludge
Sludge-1 0 MET PCB 0
V = VolatUe organics SV = Semivolatile organics MET = Metals PCB = Polychlorinated biphenyls CT = Chronic toxicity MSMSD = Matrix spikematrix spike dup D = DupUcate TB = Trip blank PPF = Precipitated and pressure filtered
(to minimize volatUes loss as opposed to vacuum filtration)
18
c
c
123 Results
1231 Precipitation Testing
Polymer Testing Preliminary polymer and coagulant testing was conducted to determine
the type of polymer and coagulant that could be employed to treat groundwater from the site
The Drewfloc polymer and the Drew CP-12 cationic coagulant were chosen as the most
effective types InitiaUy the effect of varying the pH of the groundwater sample was
investigated The resuUs of tests conducted at pH values of 80 90 and 100 are presented
on Table 1-8 As the pH value was raised the quaUty of the floe improved The sample
raised to a pH level of 100 with sodium hydroxide exhibited the best settling characteristics
based on the color turbidity soUds and the quaUty of the floe
The effects of varying the polymer dose was then investigated at pH=100 The cationic
coagulant added to a concentration of 30 ppm after pH adjustment and prior to polymer
addition produced the clearest supemate based on color turbidity and suspended soUds
results Table 1-8 also summarizes the results from this investigation
Jar Testing Four jar tests were performed to evaluate the effectiveness of chemical
precipitation for the removal of metals in groundwater from weU MW-IA The analytical
results from the jar test are presented in Table 1-9 The greatest metal reductions occurred
when the pH was 100 Samples for which the pH was adjusted with lime showed better
removal of barium manganese and sodium concentrations than those samples for which the
pH was adjusted with sodium hydroxide Samples for which the pH was adjusted with
sodium hydroxide showed greater declines in the concentrations of calcium and magnesium
No significant effect was observed on the removal of cobalt iron lead aluminum potassium
and zinc when lime or sodium hydroxide was used to raise the pH The observation that
samples for which the pH was adjusted with sodium hydroxide had elevated concentrations of
19 c
c TABLE 1-8 PRELIMINARY POLYMER TESTING RESULTS
Description of Supemate
Procedure pH ColorSoUds
mgl Turbidity
NTU Floe SettleabUity
Varymg pH
Raw Groundwater pH adjustedNaOH pH adjustedNaOH pH adjustedNaOH
62 80 90 100
YeUowbrownYeUowbrownYeUowbrownYeUowbrown
450 gt50 gt gt 5 0 gt gt50
58 SUght mst pin floe medium
gt medium
None Slow Faster Fastest
Varying polymer dose pH adjustment wNaOH
pH adjustedno polymer
100 YeUowbrown gt gt50 gt medium Fast
Above wpolymerat 1 ppm
100 Light yeUow lt 10 35 large 18 Fast
c Polymer at 5 ppm 100
Polymer at 1 ppm 100 wcoag 30 ppm
Light yeUow
Very Ught
lt 10
lt 10 yeUow
32
30
Large 18
Targe 18
Fast
Fast
n 20
o o n TABLE 1-9 F U L L - S C A L E TREATABILITY STUDY JAR T E S T R E S U L T S
Results in mgL
SAMPLE ID iiiiiiiiiiiiiiiiiiiiMW JAiSiiii iiiJTililiiiiiiiiiiii iiiJTil^iiiiiii iiiiiiiiiiTIi3iiiiiiiii iiiii^ii^li^iiiiiiiiiiiiii^iiri^iiiiisiiiiiiiiiiiiimii iiiiiJT4^iiiiiiiiiiiiiinP4i4iiiiiiiiiii iiiiiJT2iiliiiiiiiiiiiiT2^iiiiiii |i|S^ iiiiiiiiiiiiiiiiiiiiiiiiiiiiilM ii iiiiiiiiiiiiiiiiiiiiJlt iiiiiiiiii iiiiiiiiii-iiiiiiii iiiiiiiii=iiiiiiiiiiiiiliiiiii iiiiiiiiiiiiiiiiiiiiiiliiiiiiiiiiiiiiiiiiiiiiiiiiliiiiiiiiiiiiiM ii^iiiiiiiiiiiii6iiiiiiiiiiiiiiiiiiijqiiiiii mmsectlsectMimamp0^
Zinc 0488 002 U 002 U 002 U 002 U 002 U 002 U 002 U 002 U 002 U 002 U
E S A M P L E ID iiiiiiiiiiiiiiiiiiiiJT2i3iiiiiiiiiiiiiiiii ^T2-4iiiiiiiii iiiiiiiiJ^alliiiiiiiiiiiii iii^Ta^iiiiiiiiiiii iiiiiiiiit3|3iiiiiiiiiiiii iiilT3Tr4iiiiiiiiiiiiiii rrs-i iiiiiiiiiiiiiiJTSl iiiiiiiiiiiiiii iiiiiitJiJiiiiiiiiiii iiiiiiWs-4iiiiiiiiiiiii iiiiiiiJT5r-5ii|iiiiiiii
iiiiiiiiliiiiiiiiiiiiiiiiiBSsiii iiiiiiiiiiiiiiiiiiiiiilgtHiiiiiiiiiiii iiiiiiNaOHiiiiiiii iiiiiiiiiiii)iliimiiiiiiiii iiiiiiiiSiiriiiisiiiiiiiiii iiiiiiiiNiliiiiiiiiii iiiii iNapHiiiiiiiiiiiii iiiiiiiiiiiiiiiifloiiiiiiiii iiii^iiiiiiiiiii iiiiiiii NiitQHiiiiiiiii iiiiiiiiiWftOHiiiiiiii wmm iii^iiiiiiiisiiiiiiiAli|ilii iiiiiiiiiiixiiiiiEal3i iltgtoi PolyCoag C o a g u l a n t PolyCoag Coagulant iiiiiiii iiiiiii iiiiiii)|sihyii^iiiiiiii PolyCoag PolyCoag iiiPoij^iii^il ANALYTES Aerated KMn04
Barium 0073 0072 010 010 010 010 NA NA NA NA NA Calcium 247 247 571 574 273 277 NA NA NA NA NA Cobalt 001 U 001 U 0017 0018 0017 0019 NA NA NA NA NA Iron 01 U Ol U 016 023 016 043 NA NA NA NA NA Lead 0005 U 0005 U 0005 U 0005 U 0005 U 0005 U NA NA NA NA NA Magnesium 44 44 50 51 50 50 NA NA NA NA NA Manganese 35 33 43 43 44 44 063 086 099 094 14 Potassium 5 U 5 U 5 U 5 U 5 U 5 U NA NA NA NA NA Sodium 423 477 170 169 502 508 NA NA NA NA NA Zinc 002 U 002 U 0082 011 015 016 NA NA NA NA NA
Notes Only metals detected in untreated groundwater from MWIA are presented NA = Not Analyzed
U = undetected at specified detection limit JTI = Jar Test 1
c
c
sodium in the treated water was expected This is because sodium is a component of sodium
hydroxide Similarly the elevated concentrations of calcium observed in samples for
whichthe pH was adjusted wUh lime are due to the calcium component in lime Jar test 5
was conducted to assess the effect that precipitation and chemical oxidation had on the
removal of manganese and aluminum The results of this investigation are also presented in
Table 1-9 The results indicate that greater reductions of aluminum and manganese cannot
be achieved with aeration or by the addition of a chemical oxidant such as permanganate
A sample of the metal hydroxide sludge a residual that wiU be generated during the
groundwater treatment was analyzed for metals and PCBs This sample of sludge was
generated by treating contaminated groundwater with precipitation and filtration using the
optimum treatment parameters The metals results indicate that the sludge would not be
considered hazardous under RCRA using the toxicity characteristic leaching procedure
(TCLP) A TCLP was not performed on the sludge however based on 1) the concentration
of the metals in the sludge 2) assuming a 100 leachability and 3) incoiporating a 20-fold
dUution for a soUd matrix analyzed by TCLP this sludge would not be considered hazardous
under RCRA The PCB analysis of the sludge showed that Aroclor 1254 was the only
detected PCB at a concentration of 31 mgkg The TSCA limit for PCBs in waste is
50 mgkg indicating that this sludge would not be hazardous under TSCA The results for
this sludge represent a preliminary characterization and once the fuU scale treatment system
is on line the sludge analysis wiU need further testing to confirm these preliminary results
and to make a further assessment of the disposal options The analytical resuUs for the
sludge are presented in Table 1-10
1232 FUtration Testing A bench-scale filtration study was performed to determine the
optimum particle retention grade or mesh of filter media that could effectively remove the
suspended soUds in the precipitated groundwater The results of the analysis on the fUtrate
are presented in Table 1-11
n 22
c
c
TABLE 1-10 PRECIPITATED METAL HYDROXIDE SLUDGE RESULTS Results in mgkg
i||ipiiiii|iiiiiiiiiiiiiiiii^^iiiili|ii^^^ TCLP or TSCA L i n i l t s i Tfesi-iiiiiiiiiiiiiiisiiiiii^iiiiiiSvHiij^ in Solid Matrices ii iiiiS WM3KT2S
METALS
Aluminum Antimony Arsemc Barium Beryllium
Cadmium Calcium Chromium Cobalt Copper Iron Lead Magnesium Manganese Mercury Nickel Selenium Silver Sodium Thallium Vanadium Zinc
PCBs
Aroclor 1254
41100 231 195 346 5767
9120 338
25 114
39000 694 5260 2730
03313
04
8960 08
561446
31
U U
U
J
U U U R
U U J
J
NC NC 100
2000 NC 20
NC 100 NC NC NC 100 NC NC
4 NC 20
100 NC NC NC NC
50
Notes = TCLP Limits incorporated a 1 to 20 dilution factor for solid matrices Aroclor 1254 was the only PCB detected The remaining six Aroclors
were nondetect at a quantitation limit of 36 mgkg NC = No criteria exists for this compound U = Undetected at speciiied detection limit
L J = Estimated value due to validation criteria R = The result is rejected
23
c
c
TABLE 1-11 FILTRATION STUDY RESULTS
Media Rating Speed Suspended SoUds Turbidity
Raw 45 mgl 578 Course 10 um 200 mls5 sec lt5 mgl 16 NTU Medium 5 um 200 mls7 sec lt5 mgl 19 NTU Fine 1 um 200 mls23 sec lt5 mgl 18 NTU
Since there was virtuaUy no difference in the quaUty of effluents but substantial increase in
time to filter with the fine filter paper the medium 5 micron paper was chosen to prepare
sample for ftirther study
1233 Air Stripping Precipitated fUtered groundwater was aerated at 3 different air to
water ratios to evaluate the effectiveness of air stripping for the removal of volatUe organic
compounds in the groundwater Tables 1-12 and 1-13 shows the analytical results for
groundwater samples obtained from weUs MW-IA and ME-8 respectively No volatUe
organic compounds were detected in samples that were aerated at a 501 air to water ratio
Aeration of precipitated filtered groundwater obtained from weU ME-8 removed aU of the
vinyl chloride at an air to water ratio of 251
1234 Carbon Adsorption The effectiveness of carbon adsorption for the removal of
organic compounds in the groundwater was evaluated The analytical results are presented in
Table 1-14 At the lowest carbon dosage only 1 xg1 of cis-12-dichloroethene and
2 xg1 of trichloroethene remained No site-related volatUe organic compounds were detected
in samples which were treated with higher doses of carbon Toluene and
dibromochloromethane were detected in sample C-4 however these two compounds were
not detected in the raw groundwater and must therefore be a result of lab contamination
24 c
c TABLE 1-12 FULL SCALE TREATABILITY STUDY AIR STRIPPING RESULTS IN ugL FOR WELL MWIA
Methylene Chloride 10 u 4 U 5 U 5 U 4 U 4 U 2 U 4 U
cis-12-Dichloroethene 200 D 1 U 1 06 J 06 J 1 U 1 U 1 U
Chloroform 4 J 1 U 1 U 1 U 1 U 12 J 1 U 1 U
12-Dichloroethane 10 U 2 1 u 1 U 1 U 1 U 1 U 03 J
Carbon Tetrachloride 10 u 1 U 1 u 1 U 1 U 1 U 1 U 01 J
Trichloroethene 860 D 1 U 2 06 J 06 J 02 J 1 U 1 U
Toluene 10 U 020 J 1 U 1 U 1 U 007 J 25 1 U
Dibromochloromethane 10 U 1 U 1 U 1 U 1 U 1 U 14 1 U
Chlorobenzene 5 J 1 U 1 U 1 U 1 U 1 U 1 U 1 U
Ethylbenzene 10 U 1 U 1 U 1 U 1 U 1 U 1 U 1 U
Total Xylenes 1 J 1 U 1 U 1 U I U 1 U 1 U 1 U
Styrene 10 U 1 U 1 u 1 U 1 U 1 U 09 J 1 U
124-Trichloroben2ene 2400 D 4 1 u 1 U 1 U 1 U 1 U 1 U
123-Trichloroben2ene NA 5 1 u 1 U 1 U 1 U 1 U 1 U ^
SEMIVOLATILE ORG ANICS
Diethylphthalate 10 U 2 J 10 u 10 U 10 u Di-n-butylphthalate 10 U 1 J 10 u 10 U 10 u
Bis(2-ethylhexyl)phthal ate 10 U 10 U 10 u 4 J 2 J
Notes
Only volatile and semivolatile organics detected in any sample are included
No PCBs were detected in any effluent sample at a detection limit of 01 ugL influent was 36 J ugL
C-ID = Duplicate of C-1
U = Undetected at specified detection limit
J = Estimated value due to validation criteria
D = Duplicate
NA = Not Analyzed
= Value is for total 12-Dichlorocthene
i| f|iiiiiiiiiiiiiii^ti8ili| WSk
3 U 2 u 8 U
1 U 1 u 1 U
1 U 1 u 1 U
04 J 1 U 1 U
1 U 1 u 1 U
03 J 008 J 1 U
1 U 1 u 1 U
1 U 1 u 1 U
02 J 1 U 1 U
005 J 1 U 1 U
02 J OI J 1 u 1 U 1 U 1 u 1 U 1 U 1 u 1 U 1 U 1 u
10 U
10 u
2 J
27
c
The effectiveness of combining aeration and carbon adsorption to remove organic c contaminants was also investigated These results are also summarized in Table 1-15 No
organic compounds were detected m any of the samples generated during this investigation
124 Conclusions The results of the groundwater treatability study demonstrate that
treatment consisting of precipitation fUtration air stripping with vapor phase controls and
carbon adsorption appear able to meet cleanup levels estabUshed for the site Figure 1-3 is a
schematic representation of the proposed system The ROD stipulates that treated
groundwater wUl be reinjected to the aquifer onsite in this case MCLs are the cleanup
levels An altemative to be evaluated is discharging the treated groundwater to a surface
water body either Meadow Brook or the Neponset River In this case cleanup levels are
estabUshed as effluent discharge levels Effluent discharge levels are calculated by
multiplying the ambient water quaUty criteria (AWQC) values for each compound by a
dUution factor The dUution factor for the Neponset River is based on a 100-gpm treatment
discharge rate and a Neponset River 7010 of 2020 gpm The dUution factor for Meadow
Brook is 1 since the treatment discharge rate is greater than the flow of the brook therefore
effluent discharge levels for Meadow Brook are set at AWQC
Tables 1-16 through 1-19 compare effluent discharge levels for both the Neponset River and
Meadow Brook to carbon adsorption effluent from the groundwater treatability study
Table 1-16 summarizes the concentration of metals in untreated groundwater the metals
concentrations remaining foUowing precipitation and filtration the metals concentration
foUowing aeration and carbon adsorption the metals concentrations foUowing caition
adsorption only the MCLs and the effluent discharge levels based on discharge to the
Neponset River The only metal effluent concentration which exceeds the MCLs is
aluminum the MCL for aluminum however is a secondary MCL which is nonenforceable
No metals concentrations in the effluent exceed any of the effluent discharge levels
n 28
c TABLE 1-15 FULL-SCALE TREATABILITY STUDY AERATION AND CARBON ADSORPTION RESULTS Results in ugL
iiiiii|Mpt-HiiDiiii-iiiiii^iiiiiiiiiiii iii bullbullbull^(6-^1 iiiiii-iiiiiiiii iiiiiiiiii^g-2iiiiiiiiiii|i
l | | | ibyNigtii i i i i | i i i i i i i | ivi
VOLATILE ORGANICS
Mediylene Chloride 6 U 4 U Carbon Tetrachloride 1 U 01 J Toluene 02 J 1 u Total Xylenes 1 U 1 u Acetone 5 U 5 U 2-Butanone 5 U 5 U 2-Hexanone 5 U 5 U 4-Methy 1-2-pentanone 5 U 5 U Carbon Disulfide 1 U 1 U
c Notes Only volatile organics detected in any sample are included U = undetected at specified detection limit J = value is estimated due to validation criteria
iiiiiA61iiiiiiiiiiiii
3 U 1 U
02 J 01 J
5 U 5 J 5 U
5 U 1 U
i|AGii[ijiiifii
3 U U
01 J 1 U 5 U 5 U 5 U 5 U 1 U
i^^^iiiiiic|ii[|ili
10
1 u 1 u 1 u 5 U 5 J
5 U 5 U 1 U
29
c
o o o
o
Gas Phase GAC or Catalytic Oxidation
To ^ Ambient
Air
To Groundwater Recharge or
Raw Treated ) Neponset River Groundwater Groundwater Influent Holding Tank J
Solids for Offsite Disposal
(NOTE Air stripper not necessary if discharge to Neponset)
FIGURE 1-3 PROPOSED GROUNDWATER TREATMENT SYSTEM SCHEMATIC
2483JP
o n o TABLE 1-16 COMPARISON OF INORGANIC FULL-SCALE TREATABILITY STUDY RESULTS TO MCLS AND DISCHARGE LEVELS
[i^i^^^^ iiiiiiijiMf|iilaquo4 Precipitation Aeration and Carbon AdsorpUoi iiiiiiiiiiiiiiiiiiiiiiritliiiiin
iiiii iiSiiii|iiiiiiiiiiiiiiiii and Filtration M^ Iiiiiiiiiiiiii iiiiiiiii|iiii|i|iiiiiiiiiii liiiijlliiiii
iiiiiiiiiiiiiiiiiiiii iiiiiiiiiiiiii i i i i i i i|ii||iiiiiiiiiiiiiiiiiiiiiiiii iiiiiiiiiiiiiiiilii Giliii iiiii ii iiiii i iiiic iD|i laquoi|iiiiiiii iiiiitiiiiciiiiiiiiiiiii
Discharge levels calculated by multiplying AWQC by a dilution factor based on a 100 gpm treatment discharge rate and a Neponset River 7Q10 of 2020 gpm
U = Undetected at specified detection limit
J = Estimated value due to validation criteria
NC = No criteria exists for the compound
P = Proposed MCL
S = Secondary MCL
n n o TABLE 1-17 COMPARISON OF INORGANIC FULL-SCALE TREATABILITY STUDY RESULTS TO MCLS AND DISCHARGE LEVELS
DISCHARGE TO MEADOW BROOK
[isjiiiiiiiiiiiiiiii-ii |iiiiiiiiiiiiiiiiiiiiiiiiiiiiiiiiiiiiiiiiiiiiiii iiiiiiiiiiiiiiiiiiiiiiiiiiiiii iiiiiiiiiiiiiiiiiiiiiiii- iiiiiiiiiiiiiiiiiiiiiiiiiiiiiiiiii ^iiiiiiiiiiiiiiiiiiiiiiiiiiiiiiiiii bull immMmii^^ F- piiiipiiiiil i i i i i i i i i i i AcraUon and Caibon AdsorpUon iii iii iiii i i i i l l l i i i i i i ^ ^ i p t ^ sectffllM^ ^ ^
Ajumin iw u i 358 bull490 z ii 240 i--lJi iiiiiiiiiiiJ^3iiitJi i i iii i3 lliiiiiiiiii iiii|ii]^(Ciiiiiiiiiii-iii-iiiiiiii5iiiii-iiiiiiiiNC^ Antimony 2i ij NA 44 U i44 U 44 U 44 U 44 U 10 P 88 30 8600
Ariseiaic- iiiiiiiiiiiiiiiiiiiiii8iiiiiiiiiiiiiii iiiiiiiiii-iis- - iiiiiiiiii- 1 u 71 J i-iiiiiy3|ili-uj - i i i 9 l i j i iii--5Qiiiiiiiiiiiiii iiiiii NC- NC - iL | Barium 247 32 106 U 65 U 597 49 U 131 IJ 2006 NC NC NC
Blaquoay|Hiiraquosi-- bullbullbull--bull i-iiiii-iiiiii3iiiiiiliiiiiiii -iiiiiiiiiiiNAi-iiiiiii I u -- 1 U iiiiiiiiiliilliiiiii-ii|iyi- iiiii iiiiiiiiiiiiiiiiii ii|i|40 - 53-bullbull13|shyCadmium ( S i u bull bull bull bull bull bull bull bull bull N A 4 UJ 4 UJ bullr^^ 4UJ 4UJ 5 682 038 170 Cai lc turn i bull- iiiiii3PiOCfiii iiiiiiiiiiii iiiiiiiiii^iiiiiiiiiiiiii 9650 i 8360 iiii7886iiiiiiiiiiiiiiiiiiiiiiii^iiiiiiii-ii6^^ iiiiii5isNltiiiiiiiiiiiiiiiiiii iiiiiiNC NGi NC Chromium 315 NA 8 J 7 UJ 7 u j 7 uj 7 iirj 160 16 11 3206
CO i-iii-iiii 33iitiii-iiiiii ii-iiiii-i-Jfiiiiii--iiii - bull bull 4 U Z 4 U- iiiiiiiiiiiiiilii-uiiiiiiiiiiiiiiiiiiiiiii4iitjiii-iiiiiiiiiii4 iiiiii-ii Nltiiiiiiiiiiiiiiiiiiiiii i l i iNc-- -NCi^-NCi
P ^ i bull bull Copper 6 4 i NA 128 U 179 U bull64Uj 9 U --256--u-- 1300 48 36 NC
Jtaa- iiiiiiiiiiii ltJOlt iiiiiiiiiii isiiiiiiiJQiii-i - z 6AS U ii232U-^^ bulliiiiiiiiiiiiiiiiiiiiuiiiiiiiiiiiiiiiiiiiiiiiiiiiiiiiiiii2 ipit|iiiiii iiiiii3pQiiiiJiiiilii liiiNC- v 1000- bull- NCi head 253 5^U^ 35 U 46 U 21 U 12 U J 2^4 u 14 054 NCis |Magnlaquoaiuiai iiiiiiiiiiilaquo)6iiiiiiiiiiiii iiiiiiiiiiii|lS)6iiiiiiiiiiiiii 3700 7060i V^ bulliiiMiiiiiiiiiiiiiiiiiii3Jpiiiiiii7^0iiiii^^^ i iiigtKSiiiiiiiiiiiiiiii bulliii I N C bull N C Ncjii Manganese 4810 bull356 62 U 18 UJ 23 U 35 U 53 U 56 S NC NC 106
Wtercuryi iiiiiiiiiiiiiiiiiiiiiiiiyiiiMiiiiiii iiiiiiiiiiiiiiiiiNAiiiiiii i P-2 U bullbull 0 2 U-- iiiiiiiiiiiiiiiiOi|iiittiiiiiii|iiiii 6iiiiit|iiiiiiiiiiiiiQ|iit|iiiiii iiiii|i|iiiiiiiiiii iiii|iii24- -- oon --0i|i Nickel 281 isrA 181 UJ 244 UJ 269 uil 17 U 356 il 166 P 643 33 3800
Potraquoslaquolum -iiiiiiiiiii4liS0iiiiiiiiii iiiiiiiiiiiii PPQiiiiU i 2200 U i ii 2620 XT | |i |owiiyiiiiii | |(^iiiiiiiiiii^ iiiiiiiiiiiiiiiW|iiiiiiiiiiiiii iii iii|ip--i NC- bullbullbull-KCii Selenium 20 U NA 32 U 13 UJ 1 6 u 1 UJ i u 5 6 266 50 6800 Sflycri i-i- iiiiiiiiiiiiiiiiiiiiiiiiiiiiiiiiiiiiiii iiiiiiiiiiiiiiiiiii iiii- i-4U bull -^M- U iii bull i i i i | | i | | i i i i |-i i | i | l | i i i i | i i i i iiiii-i ^66iiiiiiiiiiiiiii i|iP37 -0i2iNi Sodium 1 2 3 6 6 6 9 5 5 6 6 99000 lOlOOO 99866 106066 74566 NC NC NC NC
I m iiiiiiiiiiiiiiiiiiiiii||jriiiiii||iii|i|iii|| | ii46Q ^40- -bull-3iThaUJiiiitt - iiiiiiiiiiiiiiiiiiiiiiiiiiliiiiiiiiii iiiiiiiiiiiiiiNAii- I UJ ^ iiiiiiiiiiiiiiiiii Vanadium 439 NA 5 U 83 UJ 5 U 5 IJ 0 IJJ NC NC NC NC
Ziiicii^ iiiiiiii-iiiii- 488iiiiiiiiiiiiii iiiiiiiiiiii6iiu 151 U 67 UJ iiiii iiiiiiiiiiiiiiiil52iU- iiiiiiiii2 liiiiiiiiiii iiJiOQ()ii- Siiiiiiii iiiiiiiiii|6 bull bull33 - N C i
Notes
Discharge levels are AWQC (10-5 risk) since the treatment discharge rate of 100 gpm is higher than the flowrate of Meadow Brook
U = Undetected at specified detection limit
J = Estimated value due to validation criteria
NC = No criteria eus ts for the compound
P = Proposed MCL
S = Secondary MCL
o n o TABLE 1-18 COMPARISON OF ORGANIC FULL-SCALE TREATABILITY STUDY RESULTS TO MCLS AND DISCHARGE LEVELS - DISCHARGE TO THE NEPONSET RIVER
||x|o | bull iiii||i||il|A iiiiii iiiiiiiiliiiiiiiiiiili ii5iiPo|laquo|o|i iii||l|i|i||ii||y E^ly1 C DoteslOO ii i^i|raquoiiipltii=(iiiii|iii iiii i i w i M w iiiiiiilliHiJLYiiii iiiiWiiiiii iiiiiiiiiiiiii ii iiiiiiiiiiiiiiiiiiii iiiiii iiii iiiiiiiiiii iiiiiiiiiiiiiiiiii iiiiiiiiiililiiiiiiiiiliiiiii bulliiiiii lagaiiiiiiiii iiiiiiiiiiiiiiiiiiiiiiiiiiiiiiiii (ugL) iiiiiiii^iiiiiiiiii iiiiiiiiiiiiipiiiii iiUiiiiiii^ WmnKiiiiiii i(iiiiiiii i iii iiiiiiiiiiMiiiiii VOLATILE ORGANICS
112-Trichlorocthane 5 J 25 U 1 u 1 u 1 U 1 u 1 u 5 NC NC 8904
1122-TetrachIororthane 16 J 25 U 1 u I u I U 1 u 1 u NC NC 50880 2332
Chloroform 4 J 25 U 1 u 1 u 1 U I u 1 u NC 612680 26288 3328
Vinyl Chloride 10 U 50 U I u 1 u 1 u 1 u 1 u 2 NC NC 111300
11-DichIoroethene 10 U 25 U 1 u 1 u 1 u I u 1 u 7 245920 0 403
12-Dichloroethene (total) 200 D 97 1 u 1 u 1 u 1 u 1 70 245920 NC 29680000
Trichloroethene 860 D 430 1 u I u 1 u 1 u 2 5 954000 464280 19504
Tetrachloroethene 5 J 25 U 1 u I u 1 u 1 u 1 u 5 111936 17808 1876
Xylenes (total) 1 J 25 U 1 u 1 u 01 J 1 u I u lOOOO NC NC NC
Chlorobenzene 5 J 25 U 1 u 1 u 1 u 1 u I U NC NC NC NC
SEMIVOLATILE ORGANICS
Pentachlorophenol 25 U ND 25 U 25 U 25 U 25 U 25 U I 424 276 NC
Chlorobenzenes(total) 5300 1060 NC
13-Dichlorobenzene 3 J 2 10 U 10 U 10 U 10 U 10 U 600 NC NC 55120
14-Dichlorobenzene 17 9 10 U 10 U 10 U 10 U 10 U 75 NC NC 55120
12-Dichlorobciizcne 7 J 5 10 U 10 U 10 U 10 U 10 U 600 NC NC 360400
124-Trichlorobenzene 2400 D 50 10 u 10 u 10 U 10 u 10 U 9 5300 1060 NC
PESTICIDESPCBS
Arocloi-1254 36 J 32 NA 01 u NA OI u NA 05 42 03 01
Heptachlor 0074 J NA NA NA NA NA NA 04 11 01 01
Aldrin 017 J NA NA NA NA NA NA NC 64 NC 002
Heptachlor Epoxide 0045 J NA NA NA NA NA NA 02 NC NC NC
gamma-Chlordane 0056 J NA NA NA NA NA NA 2 51 OI 01
Notes
Discharge levels calculated by multiplying AWQC (10-S risk) by a dilution factor based on a 100 gpm treatment discharge rate and a Neponset River 7Q10 of 2020 gpm
Compounds presented are only those detected in the untreated groundwater sample
NA = Not analyzed J = Estimated value due to validation criteria
NC = No criteria exists for the compound D = The reported value is from the diluted analysis
U = Undetected at specified detection limit P = Proposed MCL
o n o TABLE 1-19 COMPARISON OF ORGANIC FULL-SCALE TREATABILITY STUDY RESULTS TO MCLS AND DISCHARGE LEVELS - DISCHARGE TO MEADOW BROOK
i 1 liiiisisi i ii iii iii|i|i i l i 11 i |ii^^ i i i i i i i i iiiiiiiiiiiiiiiiii iiiiiiiiiiiiieiciidiiiiii iiiiiiiiiiiiii iiiiiliiiiiii^^iiiiii iiiiiiiiiiiiiiiiiiii iiliiiii i iiiiipiiiliiiiiiiliiii iiiiiiiiiiiiiiiiii iiiii|iii|i|i-iiiiii iiAVQiii|iiiii i ii-iiiiiiigt-iiii ^^
iiiiiiiiiiiiiiii iiiiiiiiiiiiiiiiiiiiiiiiiiiiii iiiiiiiiiiiiiiiiiiiiii I i i i i i i i i||i|i|||iiiiiiiiiiiiiiii|iiii iii-|iiilaquo|i3[i|ii |||^|ii^|i|^|iii i (3 i i ^ ^ l i i illjliii^jiii^ iieip|i(iii|i iiiiiiiiiiiiiiiiiiii i^|iii|(iiiijiii|)|r^ iiii-iiliiiiiiiiiiiii ||i |illlli|i i|li|i|ii iiiiiiiiiiiiiiiiii iiiiiiiiiii|tiiiiiiiiiiiiiiiiiii iiiiiiiiiiiifiiiiiiiiii iiiiiiiiiiiiiiiiilaquoiiiiiii iiiiiiiiiiilliiiiiiiiiiiiiiii i (laquoy^ iiiiiiiiiiiii(Wiiiiiiiii iiiiiiiii i lK^ iiiiiiiiliiiiiiiiiiiiiiiii (ugl)iii iiMiiiiiii VOLATILE ORGANICS
112-Trichloroethane 5 J 25 U 1 u 1 u 1 u 1 u 1 u 5 NC NC 420
1122-Tetrachloroethane 16 J 25 U 1 u 1 u 1 u 1 u 1 u NC NC 2400 110
Chloroform 4 J 25 U 1 u 1 u 1 u I u 1 u NC 28900 1240 157
Vinyl Chloride 10 u 50 U 1 u 1 u 1 u 1 u I u 2 NC NC 5250
11-Dichloroethene 10 u 25 U 1 u 1 u 1 u I u 1 u 7 11600 NC 19
12-Dichlorocthene (total) 200 D 97 1 u I u 1 u 1 u 1 70 11600 NC 1400000
Trichloroethene 860 D 430 1 u 1 u 1 u I u 2 5 45000 21900 920
Tetrachloroethene 5 J 25 U 1 u 1 u 1 u 1 u 1 U 5 5280 840 89
Xylenes (total) 1 J 25 U 1 u 1 u 01 J I u I U 10000 NC NC NC
Chlorobenzene 5 J 25 U 1 u 1 u 1 u 1 u I u NC NC NC NC
SEMIVOLATILE ORGANICS
Pentachlorophenol 25 U ND 25 U 25 U 25 U 25 U 25 U 1 20 13 NC
Chlorobenzenes(total) 250 50 NC
13-Dichlorobcnzene 3 J 2 10 U 10 U 10 u 10 U 10 U 600 NC NC 2600
14-Dichlorobenzene 17 9 10 U 10 U 10 u 10 U 10 U 75 NC NC 2600
12-Dichlorobenzene 7 J 5 10 U 10 U 10 u 10 U 10 U 600 NC NC 17000
124-Trichlorobenzene 2400 D 50 10 u 10 u 10 u 10 u 10 U 9 250 50 NC
PESTICIDESPCBS
Aroclor-1254 36 J 32 01 u 01 u OI u OI u NA 05 20 0014 00045
Heptachlor 0074 J NA NA NA NA NA NA 04 052 00038 00029
Aldrin 017 J NA NA NA NA NA NA NC 3 NC 000079
Heptachlor Epoxide 0045 J NA NA NA NA NA NA 02 NC NC NC
gamma-Chlordane | 0056 J NA NA NA NA NA NA 2 24 00043 00048
Notes
Discharge levels are AWQC (10-5 risk) since the treatment discharge rate of 100 gpm is higher than the flowrate of Meadow Brook
Compounds presented are only those detected in the untreated groundwater sample
NA = Not analyzed J = Estimated value due to validation criteria
NC = No criteria exists for the compound D = The reported value is from the diluted analysis
U = Undetected at specified detection limit P = Proposed MCL
Table 1-17 shows a comparison of effluent to effluent discharge levels based on discharge to c Meadow Brook assuming a dilution factor on one If the treated groundwater was discharged
to Meadow Brook effluent discharge levels for arsenic would be exceeded Since arsenic is
a difficult compound to remove in a groundwater treatment plant it is concluded that
Meadow Brook may not be usable as a discharge point
Table 1-18 presents concentrations of organic contaminants in untreated groundwater from
MW-IA the precipitated and filtered effluent the effluent following both aeration and
carbon and the effluent from carbon adsorption only These values are compared to MCLs
and effluent discharge levels Only one carbon dose for the carbon only study the lowest
dose of 05 g carbon1000 ml groundwater is shown as a conservative example In both
cases using aeration and carbon and carbon alone organic contaminants were removed to
below MCLs and to below discharge levels Therefore aeration at an air-to-water ratio of
251 and a carbon dose of 05 g carbon1000 ml groundwater effectively removed volatile
organics semivolatile organics and PCBs from the groundwater
c It is expected that a maximum air-to-water ratio at 251 will be effective for an air stripper
onsite because full-scale air strippers are many times more efficient than the bench scale
models This is due to the greater surface area and turbulence found in the stripper The
off-gas from the air stripper will have to be treated to meet applicable standards either by a
catalytic oxidation unit or a vapor phase carbon adsorption system
Since no vinyl chloride was present in MW-IA and vinyl chloride is a difficult compound to
remove with carbon adsorption tests were performed with groundwater from ME-8 which
contained 210 xg1 vinyl chloride These results were presented in Table 1-13 which shows
that air stripping at an air-to-water ratio of 251 is effective in removing vinyl chloride In
order to reach the MCL of 2 figl for vinyl chloride an air stripper is required Carbon
adsorption alone would not remove vinyl chloride down to the MCL If the treated
groundwater is discharged to the Neponset River instead of being reinjected an air stripper
to remove vinyl chloride is not necessary since the discharge level is 111300 xg1
35 c
Table 1-19 shows a comparison between the organic concentrations in treatability study c effluents and effluent discharge levels based on discharge to Meadow Brook All volatile and
semivolatile organic compounds are removed to the effluent discharge levels It is
impossible to determine if PCBs were effectively removed since the most stringent discharge
level is 0014 xgL and the detection limit in the study is 01 xgL Discharge to Meadow
Brook may not be feasible due to 1) the treatability study cannot prove that PCBs are
removed to effluent discharge levels and 2) arsenic concentrations in the treated effluent
were higher than effluent discharge levels (based on a dilution factor of one)
The preliminary results of the sludge analysis indicate that the sludge is nonhazardous under
RCRA and TSCA Once the fiill scale groundwater treatment system is on line samples of
the sludge should be reanalyzed to confirm the preliminary results and to further assess the
disposal options
In summary the results of the treatability study indicate that groimdwater from the Norwood
PCB site can be treated effectively to allow discharge to either the Neponset River or r gtlaquo^ reinjection back into the aquifer If treated groundwater is reinjected the treatment plant
must include an air stripper to remove vinyl chloride If treated groundwater is discharged
to the Neponset River an air stripper is not necessary to meet discharge levels however the
use of Best Available Technology (BAT) may be required which would necessitate the
inclusion of an air stripper A cost comparison between an air stripper combined with
liquid-phase carbon versus liquid-phase carbon alone was performed and reported in the
Modeling Report The conclusion was there is not a significant difference in cost the
present worth assuming a discount factor of 8 and a 16-year period of perfonnance was
135 vs 102 million dollars (see Volume 2 Section 3) These costs will be evaluated
further during the design phase of the project The efficiracy at the full scale plant can be
optimized to ensure that at no time will the effluent from the plant exceed any applicable
groundwater or surface water standard
36 C
Section Two
c
c
20 ROCKS
21 Introduction and Objectives
There are several sources of rocks potentially contaminated with PCBs present on the Grant
Gear property portion of the Norwood PCB site Three different sources of rocks were
collected for analysis from the Grant Gear property The three rock sources included
overburden rocks from a trench west of the Grant Gear facility and below the interim
remedial cap crushed stone from the interim remedial cap west of the Grant Gear facility
and pea stone from the upper and lower roofs of the Grant Gear facility Throughout this
section rocks collected from on top of the interim remedial cap will be referred to as cap
rocks and overburden rocks wUl be referred to as trench rocks The rock collected from the
roof were analyzed under Work Plan 1 and are discussed in the Building Investigation
Report
The objective of this portion of the predesign work was threefold
bull To determine the PCB contamination if any on the different sources of rocks
bull To assess the feasibility of dry tumbling as a remedial altemative for the rocks
bull To assess the feasibility of water washing as a remedial altemative for the rocks
The dry tumblingwater washing was conducted on rocks that were reported to be too large
to be remediated with overburden soils by the solvent extraction technique
22 Description of Work
Samples of the three sources of rocks were collected by Metcalf amp Eddy personnel on
January 8-10 1992 Refer to Figure 1-1 for the locations of the trench and the cap rock
37 c
sampling points The samples were delivered to ENSECO laboratory in Cambridge
c Massachusetts and stored in a refrigerator at 4degC prior to sample preparation and analysis
Metcalf amp Eddy performed the sample preparation portion of the PCB analysis Rock
samples were weighed and gently placed in precleaned two liter glass beakers A quality
control surrogate compound was then added to each sample or method blank for subsequent
percent recovery determination The rocks were then immersed in extraction solvent
consisting of 30 percent acetone and 70 percent hexane by volume iEach sample and blank
was heated to 50degC and intermittently swirled by hand for a thirty minute extraction time
The extracts were then dried using sodium sulfate concentrated to 10 milliliters final volume
and submitted to ENSECO for PCB analysis using EPA SW846 Method 8080
The trench rocks were divided into three size categories with average diameters of one inch
two inches and three inches The rock size is an important consideration for the solvent
extraction remediation technique
^s^^ The three trench rock sizes and six cap rock samples were analyzed initially to determine the
extent of PCB contamination As outlined in the Quality Assurance Project Plan a second
portion of the cap rock sample with the highest initial PCB concentration was subjected to
water washing remediation and analyzed for PCBs Separate portions of the trench rock
samples were subjected to dry tumbling for ten and thirty minute intervals and water washing
for ten and thirty minute intervals The remediated rocks were then analyzed for PCBs
The dry tumbling and water washing were performed using an electronic rotary device The
rock samples were placed in clean two liter plastic sampling containers with screw cap
closures Laboratory distilled deionized water was poured into the water wash test
containers while the dry tumble samples had only the rocks enclosed
38 c
c 23 RESULTS
The one-inch average diameter trench rocks were initially contaminated with 1800 mgkg of
Aroclor 1254 Because the one-inch trench rocks were above the 10 mgkg cleanup standard
sample portions of the rocks were processed step by step through each of the four
remediations Although an eighty five percent reduction in PCB contamination was achieved
between the initial and final remediation samples the final concentration of 270 mgkg is still
well above the cleanup standard The results however showed a trend with the highest
concentration of PCBs detected on the initial sample lower PCB concentrations with the
ten-minute remediation and the lowest PCB concentrations achieved with the longest
thirty-minute remediation as expected The results for the one-inch trench rocks are
presented in Table 2-1
The two-inch average diameter rocks showed results similar to those of the one inch size
The initial sample had a concentration of 2500 mgkg of Aroclor 1254 The best
remediation result obtained was 450 mgkg for the ten-minute water wash sample A thirty c minute water wash sample for the two-inch trench rocks was not conducted when it became
apparent that a 10 mgkg cleanup level could not be obtained Because the 10 mgkg cleanup
level was not achievable the thirty minute water washing of two-inch rocks was not
conducted to minimize the level of effort and analytical costs The PCB result for the
thirty-minute dry screened sample 1900 mgkg Aroclor 1254 was higher than expected
This result was counter to the trend that was expected and observed with the one-inch rocks
and it demonstrates the non-homogenous nature of the rock samples This trend breaking
analytical result caused by the heterogenous or nonuniform nature of the rock sample matrix
was not repeated because the cleanup level could not be achieved The results for the
two-inch trench rock samples are presented in Table 2-1
The three-inch average diameter trench rocks yielded markedly different analytical results
The initial sample prepared with minimal on- site screening had a PCB concentration of
75 mgkg below the cleanup standard of 10 mgkg Although the initial result was below
39 c
TABLE 2-1 TRENCH ROCK WASHING RESULTS
Trench Rocks 1 inch Average Diameter
PCB Concentration
Sample mgKg
Initial sample 1800
Ten minute dry screened 620
Ten minute water wash 880
Thirty minute dry screened 290
Thirty minute water wash 270
Trench Rocks 2 inch Average Diameter
PCB Concentration
Sample mgKg
Initial sample 2500
Ten minute dry screened 490
Ten minute water wash 450
Thirty minute dry screened 1900
Trench Rocks 3 inch Average Diameter
PCB Concentration Sample mgKg
Initial sample 750
Ten min dry screened 210
Ten min water wash 025 UJ
Aroclor 1254 was the only PCB detected UJ - The sample was nondetect for PCBs to the estimated detection limit
of 025 mgKg
40
the cleanup standard it was close enough to warrant the first ten minute dry tumble c remediation step The first remediation step with a PCB concentration of 21 mgkg
confirmed that the three-inch trench rocks are less contaminated than their smaller
counterparts The three-inch ten-minute water washed sample was not submitted for fiill
quality control PCB analysis in an effort to minimize analytical costs The ten-minute water
washed sample result is from a partial quality control PCB screening analysis and is reported
as estimated Because of the lag time in tumaround of analytical results this sample had
been prepared extracted and screened and the information was available therefore it is
presented herein The results for the three inch average diameter rocks are presented in
Table 2-1
Six samples of cap rocks were collected and analyzed for PCBs AU of the results were less
than 02 mgkg or 200 xgkg For these cap rock samples an action level of 50 xgkg was
established in the Quality Assurance Project Plan The 50 xgkg value is an action level
established by EPA for this study only and is not a cleanup level identified in the ROD The
action if the results exceeded 50 igkg was to water wash the most highly PCB contaminated c sample Water washing was performed on cap rock sample number two The initial result
for this sample was 150 xgkg while the ten minute water washed sample yielded 24 igkg
Aroclor 1254 The cap rock results showed fairly consistent PCB concentrations in the range
of 50 to 150 igkg Aroclor 1254 The results are presented in Table 2-2
24 CONCLUSIONS
The cap rock samples were all determined to have PCB concentrations approximately one
hundred times less than the cleanup level of 10 mgkg Water washing conducted on the
most contaminated cap rock sample removed approximately eighty five percent of the PCBs
initially present These cap rock samples contained some fine soil like material which was
perhaps windblown carried on tmck tires or created by friction This material contributed
to the measured PCB concentrations for the cap rock samples
41 c
c TABLE 2-2 INTERIM REMEDIAL CAP ROCKS ANALYTICAL RESULTS
LOCAiSifi iiiiiiiiiiiiiii--iiiiiiiiiiiiiiiiiiiiidiiiiiiliiiiiiiii^ 10 minute Water Wash iiiii|ijii|iiii|iii^ PCB Concentration (ligKg)
1 120 NA
2 150 24
3 110 NA
4 31 U NA
5 86 NA
6 71 NA
Notes Aroclor 1254 was the only PCB detected U - Sample was nondetect for PCBs to the reported
detection limit - The highest initial PCB concentration cap rock sample was
subjected to a ten minute water wash remediation
42
C
The results of the rock tumbling and water washing demonstrate that this form of remediation r will not achieve the cleanup level of 10 mgkg for the one-inch and two-inch average
diameter overburden rocks The three inch rocks are below the cleanup level without
remediation It should be noted that these overburden rock samples were coUected from one
of the most highly contaminated areas at the site based on the remedial investigation results
These samples therefore represent worst case conditions
The dry tumbling remediation steps did not remove aU of the adhered soU particles as
anticipated This adhered highly PCB contaminated soU contributed to the measured rock
surface PCB concentration because the PCBs were extracted from the soU as weU as the rock
surface during sample preparation
The water wash remediation was effective in removing aU of the adhered soU The results
indicate that the rock surface and near surfaces have been contaminated with PCBs which
cannot be removed by water washing but are extractable with acetonehexane
c During the trench rock coUection ample one-inch and two-inch average diameter rocks were
avaUable at shaUow depths The trench had to be dug deeper to obtain the three inch size
rocks Because of the relative immobiUty of PCBs in soU the PCB concentration decreases
with depth as reported in the remedial investigation This decrease in PCB concentration
with depth is part of the explanation as to why the three inch rocks showed less
contamination than the smaUer sizes Also a factor is the surface area to mass ratio As the
mass of the rock increases the surface area to mass ratio decreases Since the PCBs are on
the surface or near surface of the rocks as the relative surface area decreases with size or
mass the reported concentration wiU decrease correspondingly
During the trench excavation and overburden rock coUection a two- to three-inch lens of
dark oUy appearing materials was observed This material was analyzed with a PCB field
screening kit and found to contain in excess of 10000 mgkg PCBs Some of the one and
two-inch diameter rocks sampled appeared dark in color Because it was not known whether
43 c
c
the dark rocks were naturaUy colored or from the tarry lens and to keep the study unbiased
these dark rocks were sampled randomly with the remaining rocks The dark appearing
rocks were estimated to comprise approximately five percent of the one and two-inch rock
sizes Inclusion of highly contaminated rocks in the samples would boost the reported PCB
concentrations
Altemative remedial measures other than rock tumbUng and water washing include detergent
and water washing organic solvent washing or steam cleaning Although preUminary
indications from the solvent extraction vendors are that only up to one inch size rocks can be
handled the possibiUty of designing a treatment system to handle larger rocks wiU be
explored during the design phase of this project If the size of the rocks precludes them
from remediation by solvent extraction along with contaminated soUds a rock cmsher wiU be
employed to reduce the contaminated rocks to a size that can be handled Although other
altematives for rock remediation might work solvent extraction with contaminated soUs or
rock cmshing foUowed by solvent extraction appear to be the easiest most cost effective
means to achieve the cleanup standards Whichever remedial altemative is selected rock
washing would only be necessary on rocks with average diameters between one and two
inches coUected from soU highly contaminated with PCBs A very rough estimate of rocks
onsite between one- and two-inch diameters is approximately 5000 tons No remediation of
the rocks is necessary if the solvent extraction technology can handle two-inch size rocks
44 c
c
c
TABLE 1-1 SUMMARY OF PCB RESULTS FOR PHASE I TREATABILITY SAMPLES
Phaie I RI umpling conducted in May 1988 Phaae II RI lampling conducted in April 1989
NC bull No criteria cxitta for thia compound
(1) Inaufficient Data to Develop Criteria Value preaented ia LOEL shy Loweit Obierved Effect Level
(2) Value preaented for carelnogeiia ia the 10-5 level
(3) Value preaented ia for dichloroethenea
(4) Value preieoted ia for trana 12-dichloroetliene
(5) pH dependent criteria (78 pH uted)
(6) Value preaented ia for chlorinated benzenea
(7) Value presented ia for total PCBa
(8) Effluent DiKhaige Limit based upon an effluent discharge of 5 gpm to the Neponset River during the 7-day low flow lOyr recurrence (2O20gpm)
USGS Pleasant Street Oauging Station on the Neponset River
(9) Dilution factor =[(5gpm+2020gpm)5gpml= 405
(lO)Concentration exceeds effluent discharge limit contaminant must be removed by Groundwater Treatment Plant before discharge to surface water [D=DAILY MAX A=AVG MONTHLY F=FISH]
-
-
-
- - -
-
-
-
-
-
o n o TABLE 1-3 COMPARISON OF METAL CONTAMINATION IN GROUNDWATER WFTH EFFLUENT DISCHARGE LEVELS - DISCHARGE TO THE NEPONSET RIVER
bull bull bull bull bull bull bull bull bull bull bull bull - bull bull bull bull gt gt bull gt bull bull bull bull bull - bull bulliii|vO|| iS iggJMLnei i iaD s-UNFILTEREDgssHis M-B33nsRmmMMM D A I L Y iiiiiiiiiiiiiAVGiiiiii |i mmmmMmmm Xy lira^li P H A S E I WtiiMM liwiAiiiii iiiiimiii iii-pHiwiiliiiii WampMM P H A S E I ilii iiwgiiiiiiiiiiiiiiiii|iiiii iiiiiiiiiiiiiiiiiiiili|i| iiii iiiiii iiiiiiiiiiiiiiiiiiii M A X I M U M iiiiipifriiii^iiii iiiiiiiiiiiiifiiii iiiiiiiiiiiiiiiii
555^gt5^5V555^^^^ i i i ilaquoiij S U R F A C E m m m Wtm^itM B E D R O C K bull bull gt f t bullbullbull B E D R O C K iiiFRiiliiiiiiiiiiiii iiiiiiijsiiiiiriiiiiiiiiiiiiiiii iiii|iiiiiiliiiiiiii E F F L U E N T E F F L U E N T E F F L U E N T iiiiiiiiiiiiiiiiii wmmm |||ii||li| |i IliAiiiiil WliampiMM liiiiltiilii^isiiii liiiiifctAXliii iiiAiiiiiiiiiiiiiiiii i^i^iibhreiiiiiiiiiiliiiiiiii liiiiiii iiHiiiiiiiiiiiiii- D I S C H A R O E D I S C H A R O E D I S C H A R O E iiiii imm^mi mmmn WmMm WBrnB
PARAlt4ETER W iMmm iiiiiiiii iiitjiiiii Wi^MMM iiii iiiiiiiiilii iiiaraquoliiii W-imMMi iiiiiiaiiiii mMmmmm iCSiiMAiiiiii O O N S U M P iiiiiiiVEitiiii liiiiisyifeEiiiiiiiii iiiiiiiiiitiiiiL iiii cii^i iiiiiifl|5iili iiiiiiili (UOW iiiiiiii (oon) iiiiult3piili (UOL) lzMcii0m (UGL) iipiiiiiiiiiiiiiiiiiiiiii ii|^(Siliiiiiiiiii|iiiiii (UOL) (2) (UOL) (6)C7) (IKJL) (6)C7) (UOn) (6) C7) i^iipi
M E T A L S
A h m i n u m 154000 390000 119 352 12500 43900 74 77 NA NA NA NC NC NC
fMgtimi-^ztm zmisectmi iMiMM wmmi M^iiiiampii iiJiiM 189 iiiiiiiiiisiiiiiilaquo3iii iiiiiiiiiiiiiiiiiiiiiifii iiiiiiiiiiiliiiii^-iiiii isiiiiiiiiiiisiiiii CJiiiiiijiii iiiiiiiiiiiiiStCiiiiiii iiiiiiiiiiiiiiiiiiiiiiiiiiiiM bullsiiiii iiiiiiili5 iiiiiiiiiiiiiii|iiiiiiiiiigtireii iiiiiiii-shy bull bull bull bull bull bull bull bull bull iiiiiiliiiiiiWiii bull bull laquo raquo - iiiiiiiiiililiiiiiiiilifii iiiiiiiiiiii iii|iiiiiiiiiiiiiiii l i i i i i i i i i i^ i l l l i s i i iiiiii i-iiiiiiiSiiiiiiisiiii iiiiiiiiiiiiiiiiii|fltii- 405000 iiiiiiiiiiilliiiiiiiiwii iiiiAiiishymBmmm imampmm WmMM Wimm iiiiillili iiiiiiiiliiiiiii
Lead 43 i t3 21 168 l i 37 30 168 14 (3) 054 p) NC 5670 219 NC
iiititlj^iusibiii^j iilllJii^ -M-W^M iiiiiiii^^i^ ii-|7laquo- L5W iiiiiiiiiiiiiilliiifii iiiiiiiiiiiiiiiltiiiiiiiiiiiiliiiiii ii5iiiiiiie iiiiiiiiiiii bullbull bull l t raquo iiiiiiiiiiiiiiiNC iiiiiiii isci i i i | | i i i | | i p i i II0M^I iiiiiliiiiiiiiilii WM^MmM ilillilflil i | | | l il |o| | l i i l i P liiiiiiiiii iiiiiiiiiiiiip8iii bullbull ( U si i l i l i iiiiii- iiii-li|i5 iiiiiiiiiiiiiiiiiiii iiiiiiiiiiipiiiiiiii-iiiiiiiiiiii -i- o-iil bull iiiiiiiiiiiiiiiiiiiiiiiiiiiM iiiiiiiiiiiiii iiiii iiiiii iiii iiiiii laquoiii
|i|||ii Iliii illl|iillSI |illliSl^| illillaquoii iiiiiiiiiiiiiiiiiiii iiiiiiiiiliiltiii laquo raquo iiiiiiiiiiiii||i||| iiiiiiiiiiiiii iii|i|ltoigttiiiiiiiiiiiiiiii i iiliiiiilii iiiiiiiiiiiii bull^bull i l iNc| i-|iiiii -i-iii ii gti5 i iiiiiiiili^^ iiiiiiiiiiii Oiiiiiiii|i bulliiiiiiii Sodium 14100 28900 12500 26raquo00 16320 33200 16300 68000 N c NC NC Nc NC Nc Thal l ium 10 10 58 10 1400 (1) 40 (1) 32 567000 16200 1296
igtPiiiilli MmmmiM liilililil iiliiiiisii iii|ii| bulliiii iiiiiisiiilii iiiiiiiiiiiii|i ii^|i iiiiiiiiiil iiiiiii iiiiiiii ii^iliiiiiiiNiilliiiiiiiji- bulli|iiiiiflaquoSiiiiiiiiiiiiiiiiii iii|lNe-|i-ii iiiiiiiiiisiiiiiiiiiiiiiiii Nc iiiiiii liiNCii iiiiiii iiiiiiiilifiei iiiii iiiiiii iilaquo|||il| mmmmi m m m i M iiiiiiiili iiiiiiiiiiiiiiiiisil i iiiisiiiiilllii iiiiliiiiiiiiliiiiiiiiiitii iiiiiiiiiiiiiiiiiiiiiiiiiiifiii iiiiiiliili-|s4ii iiilliiiiiiii ssiiiiiiiiiiiiii iiiiiiii^^iii-iiiii iiiiiiiiiiiiiiiiiiiiiiiliii i iiiiiiiiiiiiiiliiiiiiii 13365 iiiiiiiliiiiiiiiiiiiip^ P b a i e I RI sampling conducted in M a y 1988 Phase II RI samplmg conducted in Apri l 1989
N C = N o cri teria exiata for th is compotmd
N A = N o t Available
(1) Insufficient Data to Develop Cri ter ia Value presented is L O E L - Lowest Observed Effect Level
(2) Value preaented for careinogena ia the 10-S level
(3) Hardness dependent c r i te r ia (25 mgA C A C 0 3 uaed)
(4) Value presented is for Ihe m o r e toxic hexavalent form
(5) Value presented is proposed (more conservat ive)
(6) Effluent Discharge L imi t dilution factor based upon an effluent discbarge of 5 gpm to the Neponse t River during the 7 - d a y low flow lOyr recurrence (2020gpm)
USOS Pleasant Street Oaug ing atation on the Neponset River
(7) Dilut ion factor =[(Sgpm+2020gpm)Sgpm]= 405
(lO)Concentration exceeds effluent discharge limit contaminant must be removed by Groundwate r Treatment Plant before discharge to Ihe Neponset River [ D = D A I L Y M A X A = A V O M O N T H L Y F=FISH]
c and 1-3 for effluent (Uscharge limits for organic and inorganic compounds An acute toxicity
test showed that no toxic effect was observed for the interim treatment discharge
114 Conclusions
Based on the results of the Phase I bench scale treatabUity study the combined unit
operations of fUtration foUowed by carbon adsorption were effective in treating the
contaminated groundwater coUected during the pumping tests for temporary discharge to the
Neponset River A sample of the discharge was coUected during the groundwater treatment
and it was found to contain less than the quantitation limit of 05 xgL of PCB The metals
concentrations were aU determined to be below the discharge criteria A sample was also
coUected and submitted for an acute toxicity determination The resuUs showed that no toxic
effect was observed The bench scale treatability results and the on-line discharge analyses
demonstrate that the filtration and carbon adsorption unit operations were effective temporary
treatment techniques
^ 12 FULL SCALE STUDY
A groundwater treatability study was conducted to evaluate the performance of four different
treatment processes on contaminated groundwater obtained from the Norwood PCB site The
contaminants present in the groundwater were determined during previous studies conducted
in May 1988 and AprU 1989 by EBASCO Chapter 1 of the Final FeasibUity Study
(EBASCO 1989c) contains an overview of the results obtained during these investigations
Based on the resuUs of the May 1988 and AprU 1989 field investigations EPA concluded
that the overburden and bedrock aquifers beneath the site were contaminated with
polychlorinated biphenyls (PCBs) and volatUe and semivolatile organic compounds (VOCs
and SVOCs) It was determined that surficial and subsurface soUs dredge pUes of sediments
taken from Meadow Brook sediments in Meadow Brook and sediments in the drainage
system of the buUding operated by Grant Gear were the sources of the contamination In
r
c September 1989 EPA released the Record of Decision (ROD) for the Norwood PCB site In
the ROD EPA directed that groundwater be treated with a system including activated carbon
air stripping with vapor controls and precipitationfiltration iEPA also directed that
treatability studies or pUot studies be conducted to aid in the overaU design of the system
In accordance with the ROD a bench scale treatabUity study was conducted at the ENSECO
Laboratory Facility in Cambridge Massachusetts by Metcalf amp Eddy personnel between
January 14 and February 16 1992 This report presents a description of the work
completed resuUs and conclusions of the study
121 Objectives
The fuU-scale groundwater treatability study was conducted to determine if treatment
consisting of precipitation fUtration air stripping and carbon adsorption would effectively
remove the contamination present in the groundwater at the Norwood PCB site to appUcable
standards Information on the percent reduction of organic and inorganic compounds in the
groundwater volume type of residual and byproducts produced by each component were
also investigated A schematic detailing the treatability study and the sampling and analysis
conducted is presented in Figure 1-1
122 Description of Work
The treatability study was performed in accordance with Pre-Design Work Plan 3 and the
QuaUty Assurance Project Plan for the Phase n Bench-Scale TreatabiUty Study (Work
Plan 3)
Groundwater samples were coUected from the Norwood PCB site for use in this
investigation Interim sampling was performed on effluent streams generated from each
bench-scale process for analysis according to Table 1-4 Influent and final effluent samples
generated during the groundwater treatabiUty were coUected and analyzed through the CLP
^
o JAR TESTING SAMPLE ID
o
POLYMER TESTING
RAW GROUNDWATER
VOL 1 SVOL I p PCB f ^ ^ METALS
mdash SST
T
T
T
SS - Choose Polymer T ar)d Dose Estimate pH pf i After Coagu lant
Jar Test 1 PH10 bull
Lime wCoag wPdymer - SS T Metals
Ume wCoag wo Polymer - SS T Metals
- NaOH wCoag wPolymer - SS T Metals
NaOH wCoag wo Polymer - SS T Metals
Jar Test 2 pH9
Jar Test 3 pH8
bull
Lime w C oag wPdymer - SS T Metals
- Lime wCoag wo Polymer - SS T Metals
- NaOH wCoag wPolymer - SS T Metals
NaOH wCoag wo Polymer - SS T Metals
- Lime wCoag wPolymer - SS T Metals
- Lime wCoag wo Polymer - SS T Metals
- NaOH wCoag wPolymer - SS T Metals
- NaOH wCoag wo Polymer - SS T Metals
JT1 -1 shy
j r i -2 shy
JT1 -3 shy
JTI-4
j r 2 - 1
JT2-2 shy
JT2-3
j r2-4 bull
JT3-1 shy
JT3-2shy
JT3-3 bull
JT3-4 shy
HLTRATION TESTING
RIter Paper 1 - SS T Time mdash |
RIter Paper 2 - SS T Time-
Rlter Paper 3 - SS T Time -
CtHXise Filter Paper or Particle Retention Size
Sample Well Using Bailer
VOL SVOL PCB CLPMETALS (PPF-1)
Precipitate and Filter Using Optimized Polymer pH Coagulant and Filter
system for volatUes semivolatUes PCBs and metals AU interim samples were analyzed at
ENSECO in Cambridge Massachusetts AU data was vaUdated by MampE according to the
QAPP
1221 Groundwater Sample CoUection Groundwater for this study was coUected from
weUs MW-IA and ME-8 as shown on Figure 1-2 iMW-lA was chosen as a sampling
location because it was determined to be one of the most contaminated weUs on-site based
on previous investigations During the course of the treatabiUty study a decision was made
to obtain samples from ME-8 because results of the most recent sampling effort conducted by
ICF indicated that groundwater from this weU contained approximately 200 xgL vinyl
chloride whereas groundwater from MW-IA no longer contained any quantifiable amount
Removal of vinyl chloride by aeration needed to be demonstrated during this investigation
because vinyl chloride is not effectively removed by carbon adsorption
Groundwater samples were obtained on four separate occasions during the study as shown in
Table 1-5 On each occasion the groundwater was coUected in accordance with the Field
Sampling Plan Three weU volumes of water were purged from the weU using a centrifiigal
pump before any samples were coUected The pH temperature and conductivity of the
purge water was measured after each weU volume untU the measured values differed by less
than 10 for three consecutive samples to ensure the sample drawn was representative of the
water in the aquifer Samples for the metals precipitation and filtration study were coUected
using a centrifugal pump Samples for the air stripping and carbon adsorption study were
coUected with a teflon baUer to minimize aeration and possible loss of volatUes during
sample coUection
The samples were coUected in one gallon amber glass bottles and stored at 4degC Each
sample bottle wasfiUed to exclude a headspace in the bottle
e 10
200 200
SCALE IN FEET
D CAP ROCK SAMPLE LOCATION
bull WELLS
nOURE 1-2 GROUNDWATER AND TRENCH AND CAP
ROCK SAMPLING LOCATIONS
11
E T C A L F a EDDY
c TABLE 1-5 GROUNDWATER SAMPLING SUMMARY
Mode of Date WeU Amount Sampled pH Temp degC Conductivity SampUng
11392 MW-IA 10 gallons 62 8deg 220 umhocm pump
12792 MW-IA 16 gaUons 62 8deg 220 umhocm baUer
20392 MW-IA 16 gallons 62 8deg 220 umhocm baUer
20592 ME-8 2 gallons 64 8deg 230 umhocm baUer
1222 Precipitation Testing
General Chemical precipitation for the removal of metals was evaluated at three pH values
and three polymer dosages to determine the effectiveness of the treatment A preliminary
evaluation of different coagulants and polymers was conducted at three pH values by
r Metcalf amp Eddy personnel and a leading polymer vendor to determine which chemicals could
potentiaUy be used to precipitate groundwater Based on the results from the preliminary
evaluation jar tests were conducted by Metcalf amp Eddy personnel to aid in the determination
of the chemical dosages required to optimize the effectiveness of precipitation
Polymer and Coagulent Testing Polymer testing was performed by Metcalf amp Eddy and a
leading polymer vendor at the ENSECO laboratory faciUty in Cambridge Massachusetts
The effectiveness of anionic cationic and nonioiuc polymer was evaluated at three pH
values The best polymer was determined to be Drewfloc 2270 a low charge anionic high
molecular weight polymer This polymer was used in jar tests 1 through 5 The best
coagulent was determined to be Charge Pack 12 (CP-12) a higher charge cationic low
molecular weight coagulent The CP-12 coagulent was used in jar tests 1 through 5
described under jar testing
12 c
InitiaUy the effects of varying the pH of the groundwater sample was investigated Tests c were conducted at pH values of 80 90 and 100 with sodium hydroxide which had the best
settling characteristics based on visual observation and turbidity measurement Each polymer
was then tested at pH = 100 to evaluate Us effectiveness under optimum pH conditions
A formula of polymer and coagulant addition was developed based on visual observations
suspended soUds and turbidity analyses performed on each sample generated during the
investigation The anionic polymer effectively flocculated the existing smaU suspended
particles and the addkion of cationic coagulant removed iron and color when the pH was
raised to 100
Jar Testing Five jar tests were performed using the polymer and coagulants determined to
be effective during preliminary testing Jar tests 1 and 4 were conducted as dupUcates at
ph 10 Jar test 2 was conducted at pH 9 jar test 3 was conducted at pH 8 and jar test 5 was
conducted at pH 10 On each occasion prior to beginning the jar test the raw groundwater
was brought tol5deg-17degCina warm water bath The temperature was held constant to c eliminate the effects of temperature on reaction rates and solubUity
The foUowing is a description of activities conducted during the jar tests fti through 4 See
Figure 1-1 for details Four samples were evaluated during each jar test For each jar test
four 15 Uter beakers were fiUed with 1 Uter of raw groundwater The beakers were placed
on the stirrer platform and the paddles were lowered into the sample The jar stirrer was
operated at 80 revolutions per minute (rpm) The pH was then adjusted to the desired value
(pH = 10 9 8 10 for Tests 1 2 3 4) with a lime slurry in two samples and with a
sodium hydroxide solution (25) in the remaining two samples Lime was added to
investigate its effects on the precipitate and to evaluate its effectiveness in pH adjustment
The cationic coagulant was then added to each sample untU the concentration in solution was
30 mgL The solution was stirred at 80 rpm for 2 minutes to ensure complete mixing The
polymer was then added to one sample pH adjusted with sodium hydroxide and one sample
pH adjusted with lime Mixing continued for two minutes Next the solution was stirred
13 c
slowly orflocculated for five minutes at 20 rpm FinaUy the solutions were aUowed to
c settle for 10 minutes Visual observations were recorded and samples were submitted for
suspended soUds turbidity and metals analyses
Jar test 5 was performed to assess the removal of manganese and aluminum by preaeration
and permanganate additions (see Figure 1-1) Because no significant benefit was observed in
the previous tests when lime was used instead of sodium hydroxide sodium hydroxide was
used to adjust the pH in aU four samples to a pH of 100 in jar test 5 Only sodium
hydroxide was added to the groundwater in the first jar to determine the removal of
manganese and aluminum attributable to the formation of an insoluble salt at high pH
Sodium hydroxide and polymer were added to the second jar to evaluate the effectiveness of
the polymer Sodium hydroxide polymer and coagulant were added to sample 4 The
supemate from sample 4 was then fUtered This was performed to determine if the required
removal efficiencies could be achieved by chemical precipitation and filtration
Permanganate was added to sample 3 in addition to sodium hydroxide coagulant and
polymer to determine if the manganese and aluminum present could be chemicaUy oxidized c to a less soluble state which would enhance the efficiency of fUtration The supemate was
then siphoned off using clean tygon tubing and a syringe into the sample containers
Samples were submitted for metals suspended soUds and turbidity as illustrated on
Figure 1-1
1223 Filtration Testing A bench-scale filtration study was perfonned to determine the
optimum pore size of filter media that could effectively remove the suspended soUds in the
precipitated groundwater The determination of the removal efficiency for each filter was
based on the concentration of suspended soUds and turbidity of the filtered water The time
required to filter the groundwater was also evaluated
Prior to filtration the metals in the groundwater were precipitated and coagulent and polymer
were added using the optimum conditions developed during the precipitation study The
optimum conditions consisted of pH adjustment to 10 with sodium hydroxide addition of
14 c
coagulent CP-12 to a concentration of one percent and addition of Drewfloc 2270 polymer to
c a concentration of 10 mgl Three grades (10 xm 5 xm and 1 xm pore sizes) of filter
paper were used with a Buchner ftmnel to filter aUquots of the precipitated groundwater
Samples of the filtered water were submitted to ENSECO for suspended soUds and turbidity
analysis
A sample of the metal hydroxide sludge was coUected during the treatability study The
sludge sample was submitted to the CLP system for PCB and metals analysis so that a
characterization of the sludge could be made and disposal options could be evaluated
1224 Air Stripping Testing Precipitated fUtered groundwater was aerated at three
different air to water ratios to determine the most effective stripping ratio To ensure that
worst case volatUe organic compound concentrations were present in the samples for this
study some modifications were made in how the sample was coUected and treated First
the groundwater was coUected with a baUer to prevent the loss of volatUes AdditionaUy the
water was fUtered under positive pressure foUowing the precipitation step to minimize the c loss of volatUes that would result if the water was filtered using a vacuum pump
An aquarium pump tygon tubing and aeration stone with a glass-fiber fUter cartridge was
used to aerate 1-Uter aUquots of precipitated and filtered groundwater The aeration flow
rate was caUbrated by filling a graduated cylinder with air that had been filled with tap water
and inverted in a water bath The air was diffused at 375 missec into 1-Uter aUquots of
groundwater and the time measured as iUustrated in Table 1-6 The aerated groundwater was
submitted to ENSECO for volatUe organics analysis
1225 Carbon Adsorption Testing The effectiveness of activated carbon for the removal
of organic compounds in the groundwater at the site was evaluated The carbon used was
the powdered activated 325 mesh carbon suppUed by Calgon Corporation The groundwater
samples used for this investigation were obtained and filtered as described in the air stripping
15 c
c
c
TABLE 1-6 AERATION TEST OPERATIONS
Air to Water Ratio Volume Volume of by Volume of Water Air Reqd Min of Aeration
251 1000 ml 25000 ml 111 501 1000 ml 50000 ml 222 751 1000 ml 75000 ml 333
section of this report to minimize the loss of volatUes A total of twelve samples were mn
during this investigation The necessity of air stripping was investigated by comparing the
resuUs from four samples that were air stripped to seven samples that were treated identicaUy
with the exception of air stripping AU samples for the air stripping comparison went
through the precipitation filtration and carbon adsorption processes AdditionaUy one
sample was prepared with no carbon added to serve as an untreated sample The samples are
summarized in Table 1-7 Each groundwater sample was prepared and mixed with a
predetermined dose of Calgon powdered 325 mesh activated carbon and placed m an open
Erlenmyer flask on a shaker table for a two-hour time period at 180 rpm A rotary shaker
table capable of accommodating twelve (12)-1000 ml Erlenmyer flasks was used Effluent
was fUtered with a barrel filter using a glass-fiber pre-fUter and a Whatman 45 micron
membrane The effluent clear and odorless in aU cases was added to sample containers
preserved and packed for shipment to CLP laboratories Since the shaker table could
accommodate 12 flasks a total of approximately 4 gaUons of effluent was generated during
each mn Several mns were performed to generate adequate quantities of sample for
analysis accordmg to Table 1-7 Groundwater was simUarly prepared for submittal to
Aquatec Lab in Burlington Vermont for chronic toxicity testing Three (3) shipments of
approximately 2 gaUons each were made
r 16
C) o o TABLE 1-7 CLP TREATABILITY STUDY SAMPLING SUMMARY
Dose g of Carbon Required of mis in gs Carbon
Sample ID 1000 ml of GW Analysis Volume mis Flasks Flasks in each
Precipitation Filtration Aeration amp Carbon
AC-1 05 V SV MET 3400 3 1067 054 AC-2 20 V SV PCB 4400 4 1100 22 AC-3 50 V SV MET 3400 3 1133 57 AC-4 100 V SV PCB 4400 4 1100 110 AC-5 Trip Blank 0 V
Precipitation Filtration amp Carbon
C-0 0 V 500 1 500 0
C-1 05 V SV MET 3200 3 1067 053
c-2 10 V PCB 2200 2 1100 11
C-3 20 V SV CT 29000 24 1250 25
C-4 50 V SV PCB 4400 4 1100 55
C-17 70 V MET 1200 1 1200 70
C-18 100 V SV 2200 2 1100 110
C-13 Treatability Blank 0 V PCB 2200 0 0 0
C-20 Trip Blank 0 V 0
C-10 Duplicate of C-1 05 SV 2000 2 1000 05
C-1 05 (MSMSD) 500 1 500 025
C-11 Duplicate of C-1 05 MET 1000 1 1000 05
C-20 Duplicate of C-2 10 V PCB (MSMSD)
4400 4 1100 11
C-16 Duplicate of C-4 50 PCB 2000 2 1000 50
C-6 0 PCB 2000 2 1000 0
17
o o n TABLE 1-7 (Continued) CLP TREATABILITY STUDY SAMPLING SUMMARY
Dose g of Carbon Required of mis in gs Carbon
Sample ID 1000 ml of GW Analysis Volume mis Flasks Flasks in each
Precipitation amp Filtration
PPF-1 V SV MET PCB 2000 2 1000 0
Sludge
Sludge-1 0 MET PCB 0
V = VolatUe organics SV = Semivolatile organics MET = Metals PCB = Polychlorinated biphenyls CT = Chronic toxicity MSMSD = Matrix spikematrix spike dup D = DupUcate TB = Trip blank PPF = Precipitated and pressure filtered
(to minimize volatUes loss as opposed to vacuum filtration)
18
c
c
123 Results
1231 Precipitation Testing
Polymer Testing Preliminary polymer and coagulant testing was conducted to determine
the type of polymer and coagulant that could be employed to treat groundwater from the site
The Drewfloc polymer and the Drew CP-12 cationic coagulant were chosen as the most
effective types InitiaUy the effect of varying the pH of the groundwater sample was
investigated The resuUs of tests conducted at pH values of 80 90 and 100 are presented
on Table 1-8 As the pH value was raised the quaUty of the floe improved The sample
raised to a pH level of 100 with sodium hydroxide exhibited the best settling characteristics
based on the color turbidity soUds and the quaUty of the floe
The effects of varying the polymer dose was then investigated at pH=100 The cationic
coagulant added to a concentration of 30 ppm after pH adjustment and prior to polymer
addition produced the clearest supemate based on color turbidity and suspended soUds
results Table 1-8 also summarizes the results from this investigation
Jar Testing Four jar tests were performed to evaluate the effectiveness of chemical
precipitation for the removal of metals in groundwater from weU MW-IA The analytical
results from the jar test are presented in Table 1-9 The greatest metal reductions occurred
when the pH was 100 Samples for which the pH was adjusted with lime showed better
removal of barium manganese and sodium concentrations than those samples for which the
pH was adjusted with sodium hydroxide Samples for which the pH was adjusted with
sodium hydroxide showed greater declines in the concentrations of calcium and magnesium
No significant effect was observed on the removal of cobalt iron lead aluminum potassium
and zinc when lime or sodium hydroxide was used to raise the pH The observation that
samples for which the pH was adjusted with sodium hydroxide had elevated concentrations of
19 c
c TABLE 1-8 PRELIMINARY POLYMER TESTING RESULTS
Description of Supemate
Procedure pH ColorSoUds
mgl Turbidity
NTU Floe SettleabUity
Varymg pH
Raw Groundwater pH adjustedNaOH pH adjustedNaOH pH adjustedNaOH
62 80 90 100
YeUowbrownYeUowbrownYeUowbrownYeUowbrown
450 gt50 gt gt 5 0 gt gt50
58 SUght mst pin floe medium
gt medium
None Slow Faster Fastest
Varying polymer dose pH adjustment wNaOH
pH adjustedno polymer
100 YeUowbrown gt gt50 gt medium Fast
Above wpolymerat 1 ppm
100 Light yeUow lt 10 35 large 18 Fast
c Polymer at 5 ppm 100
Polymer at 1 ppm 100 wcoag 30 ppm
Light yeUow
Very Ught
lt 10
lt 10 yeUow
32
30
Large 18
Targe 18
Fast
Fast
n 20
o o n TABLE 1-9 F U L L - S C A L E TREATABILITY STUDY JAR T E S T R E S U L T S
Results in mgL
SAMPLE ID iiiiiiiiiiiiiiiiiiiiMW JAiSiiii iiiJTililiiiiiiiiiiii iiiJTil^iiiiiii iiiiiiiiiiTIi3iiiiiiiii iiiii^ii^li^iiiiiiiiiiiiii^iiri^iiiiisiiiiiiiiiiiiimii iiiiiJT4^iiiiiiiiiiiiiinP4i4iiiiiiiiiii iiiiiJT2iiliiiiiiiiiiiiT2^iiiiiii |i|S^ iiiiiiiiiiiiiiiiiiiiiiiiiiiiilM ii iiiiiiiiiiiiiiiiiiiiJlt iiiiiiiiii iiiiiiiiii-iiiiiiii iiiiiiiii=iiiiiiiiiiiiiliiiiii iiiiiiiiiiiiiiiiiiiiiiliiiiiiiiiiiiiiiiiiiiiiiiiiliiiiiiiiiiiiiM ii^iiiiiiiiiiiii6iiiiiiiiiiiiiiiiiiijqiiiiii mmsectlsectMimamp0^
Zinc 0488 002 U 002 U 002 U 002 U 002 U 002 U 002 U 002 U 002 U 002 U
E S A M P L E ID iiiiiiiiiiiiiiiiiiiiJT2i3iiiiiiiiiiiiiiiii ^T2-4iiiiiiiii iiiiiiiiJ^alliiiiiiiiiiiii iii^Ta^iiiiiiiiiiii iiiiiiiiit3|3iiiiiiiiiiiii iiilT3Tr4iiiiiiiiiiiiiii rrs-i iiiiiiiiiiiiiiJTSl iiiiiiiiiiiiiii iiiiiitJiJiiiiiiiiiii iiiiiiWs-4iiiiiiiiiiiii iiiiiiiJT5r-5ii|iiiiiiii
iiiiiiiiliiiiiiiiiiiiiiiiiBSsiii iiiiiiiiiiiiiiiiiiiiiilgtHiiiiiiiiiiii iiiiiiNaOHiiiiiiii iiiiiiiiiiii)iliimiiiiiiiii iiiiiiiiSiiriiiisiiiiiiiiii iiiiiiiiNiliiiiiiiiii iiiii iNapHiiiiiiiiiiiii iiiiiiiiiiiiiiiifloiiiiiiiii iiii^iiiiiiiiiii iiiiiiii NiitQHiiiiiiiii iiiiiiiiiWftOHiiiiiiii wmm iii^iiiiiiiisiiiiiiiAli|ilii iiiiiiiiiiixiiiiiEal3i iltgtoi PolyCoag C o a g u l a n t PolyCoag Coagulant iiiiiiii iiiiiii iiiiiii)|sihyii^iiiiiiii PolyCoag PolyCoag iiiPoij^iii^il ANALYTES Aerated KMn04
Barium 0073 0072 010 010 010 010 NA NA NA NA NA Calcium 247 247 571 574 273 277 NA NA NA NA NA Cobalt 001 U 001 U 0017 0018 0017 0019 NA NA NA NA NA Iron 01 U Ol U 016 023 016 043 NA NA NA NA NA Lead 0005 U 0005 U 0005 U 0005 U 0005 U 0005 U NA NA NA NA NA Magnesium 44 44 50 51 50 50 NA NA NA NA NA Manganese 35 33 43 43 44 44 063 086 099 094 14 Potassium 5 U 5 U 5 U 5 U 5 U 5 U NA NA NA NA NA Sodium 423 477 170 169 502 508 NA NA NA NA NA Zinc 002 U 002 U 0082 011 015 016 NA NA NA NA NA
Notes Only metals detected in untreated groundwater from MWIA are presented NA = Not Analyzed
U = undetected at specified detection limit JTI = Jar Test 1
c
c
sodium in the treated water was expected This is because sodium is a component of sodium
hydroxide Similarly the elevated concentrations of calcium observed in samples for
whichthe pH was adjusted wUh lime are due to the calcium component in lime Jar test 5
was conducted to assess the effect that precipitation and chemical oxidation had on the
removal of manganese and aluminum The results of this investigation are also presented in
Table 1-9 The results indicate that greater reductions of aluminum and manganese cannot
be achieved with aeration or by the addition of a chemical oxidant such as permanganate
A sample of the metal hydroxide sludge a residual that wiU be generated during the
groundwater treatment was analyzed for metals and PCBs This sample of sludge was
generated by treating contaminated groundwater with precipitation and filtration using the
optimum treatment parameters The metals results indicate that the sludge would not be
considered hazardous under RCRA using the toxicity characteristic leaching procedure
(TCLP) A TCLP was not performed on the sludge however based on 1) the concentration
of the metals in the sludge 2) assuming a 100 leachability and 3) incoiporating a 20-fold
dUution for a soUd matrix analyzed by TCLP this sludge would not be considered hazardous
under RCRA The PCB analysis of the sludge showed that Aroclor 1254 was the only
detected PCB at a concentration of 31 mgkg The TSCA limit for PCBs in waste is
50 mgkg indicating that this sludge would not be hazardous under TSCA The results for
this sludge represent a preliminary characterization and once the fuU scale treatment system
is on line the sludge analysis wiU need further testing to confirm these preliminary results
and to make a further assessment of the disposal options The analytical resuUs for the
sludge are presented in Table 1-10
1232 FUtration Testing A bench-scale filtration study was performed to determine the
optimum particle retention grade or mesh of filter media that could effectively remove the
suspended soUds in the precipitated groundwater The results of the analysis on the fUtrate
are presented in Table 1-11
n 22
c
c
TABLE 1-10 PRECIPITATED METAL HYDROXIDE SLUDGE RESULTS Results in mgkg
i||ipiiiii|iiiiiiiiiiiiiiiii^^iiiili|ii^^^ TCLP or TSCA L i n i l t s i Tfesi-iiiiiiiiiiiiiiisiiiiii^iiiiiiSvHiij^ in Solid Matrices ii iiiiS WM3KT2S
METALS
Aluminum Antimony Arsemc Barium Beryllium
Cadmium Calcium Chromium Cobalt Copper Iron Lead Magnesium Manganese Mercury Nickel Selenium Silver Sodium Thallium Vanadium Zinc
PCBs
Aroclor 1254
41100 231 195 346 5767
9120 338
25 114
39000 694 5260 2730
03313
04
8960 08
561446
31
U U
U
J
U U U R
U U J
J
NC NC 100
2000 NC 20
NC 100 NC NC NC 100 NC NC
4 NC 20
100 NC NC NC NC
50
Notes = TCLP Limits incorporated a 1 to 20 dilution factor for solid matrices Aroclor 1254 was the only PCB detected The remaining six Aroclors
were nondetect at a quantitation limit of 36 mgkg NC = No criteria exists for this compound U = Undetected at speciiied detection limit
L J = Estimated value due to validation criteria R = The result is rejected
23
c
c
TABLE 1-11 FILTRATION STUDY RESULTS
Media Rating Speed Suspended SoUds Turbidity
Raw 45 mgl 578 Course 10 um 200 mls5 sec lt5 mgl 16 NTU Medium 5 um 200 mls7 sec lt5 mgl 19 NTU Fine 1 um 200 mls23 sec lt5 mgl 18 NTU
Since there was virtuaUy no difference in the quaUty of effluents but substantial increase in
time to filter with the fine filter paper the medium 5 micron paper was chosen to prepare
sample for ftirther study
1233 Air Stripping Precipitated fUtered groundwater was aerated at 3 different air to
water ratios to evaluate the effectiveness of air stripping for the removal of volatUe organic
compounds in the groundwater Tables 1-12 and 1-13 shows the analytical results for
groundwater samples obtained from weUs MW-IA and ME-8 respectively No volatUe
organic compounds were detected in samples that were aerated at a 501 air to water ratio
Aeration of precipitated filtered groundwater obtained from weU ME-8 removed aU of the
vinyl chloride at an air to water ratio of 251
1234 Carbon Adsorption The effectiveness of carbon adsorption for the removal of
organic compounds in the groundwater was evaluated The analytical results are presented in
Table 1-14 At the lowest carbon dosage only 1 xg1 of cis-12-dichloroethene and
2 xg1 of trichloroethene remained No site-related volatUe organic compounds were detected
in samples which were treated with higher doses of carbon Toluene and
dibromochloromethane were detected in sample C-4 however these two compounds were
not detected in the raw groundwater and must therefore be a result of lab contamination
24 c
c TABLE 1-12 FULL SCALE TREATABILITY STUDY AIR STRIPPING RESULTS IN ugL FOR WELL MWIA
Methylene Chloride 10 u 4 U 5 U 5 U 4 U 4 U 2 U 4 U
cis-12-Dichloroethene 200 D 1 U 1 06 J 06 J 1 U 1 U 1 U
Chloroform 4 J 1 U 1 U 1 U 1 U 12 J 1 U 1 U
12-Dichloroethane 10 U 2 1 u 1 U 1 U 1 U 1 U 03 J
Carbon Tetrachloride 10 u 1 U 1 u 1 U 1 U 1 U 1 U 01 J
Trichloroethene 860 D 1 U 2 06 J 06 J 02 J 1 U 1 U
Toluene 10 U 020 J 1 U 1 U 1 U 007 J 25 1 U
Dibromochloromethane 10 U 1 U 1 U 1 U 1 U 1 U 14 1 U
Chlorobenzene 5 J 1 U 1 U 1 U 1 U 1 U 1 U 1 U
Ethylbenzene 10 U 1 U 1 U 1 U 1 U 1 U 1 U 1 U
Total Xylenes 1 J 1 U 1 U 1 U I U 1 U 1 U 1 U
Styrene 10 U 1 U 1 u 1 U 1 U 1 U 09 J 1 U
124-Trichloroben2ene 2400 D 4 1 u 1 U 1 U 1 U 1 U 1 U
123-Trichloroben2ene NA 5 1 u 1 U 1 U 1 U 1 U 1 U ^
SEMIVOLATILE ORG ANICS
Diethylphthalate 10 U 2 J 10 u 10 U 10 u Di-n-butylphthalate 10 U 1 J 10 u 10 U 10 u
Bis(2-ethylhexyl)phthal ate 10 U 10 U 10 u 4 J 2 J
Notes
Only volatile and semivolatile organics detected in any sample are included
No PCBs were detected in any effluent sample at a detection limit of 01 ugL influent was 36 J ugL
C-ID = Duplicate of C-1
U = Undetected at specified detection limit
J = Estimated value due to validation criteria
D = Duplicate
NA = Not Analyzed
= Value is for total 12-Dichlorocthene
i| f|iiiiiiiiiiiiiii^ti8ili| WSk
3 U 2 u 8 U
1 U 1 u 1 U
1 U 1 u 1 U
04 J 1 U 1 U
1 U 1 u 1 U
03 J 008 J 1 U
1 U 1 u 1 U
1 U 1 u 1 U
02 J 1 U 1 U
005 J 1 U 1 U
02 J OI J 1 u 1 U 1 U 1 u 1 U 1 U 1 u 1 U 1 U 1 u
10 U
10 u
2 J
27
c
The effectiveness of combining aeration and carbon adsorption to remove organic c contaminants was also investigated These results are also summarized in Table 1-15 No
organic compounds were detected m any of the samples generated during this investigation
124 Conclusions The results of the groundwater treatability study demonstrate that
treatment consisting of precipitation fUtration air stripping with vapor phase controls and
carbon adsorption appear able to meet cleanup levels estabUshed for the site Figure 1-3 is a
schematic representation of the proposed system The ROD stipulates that treated
groundwater wUl be reinjected to the aquifer onsite in this case MCLs are the cleanup
levels An altemative to be evaluated is discharging the treated groundwater to a surface
water body either Meadow Brook or the Neponset River In this case cleanup levels are
estabUshed as effluent discharge levels Effluent discharge levels are calculated by
multiplying the ambient water quaUty criteria (AWQC) values for each compound by a
dUution factor The dUution factor for the Neponset River is based on a 100-gpm treatment
discharge rate and a Neponset River 7010 of 2020 gpm The dUution factor for Meadow
Brook is 1 since the treatment discharge rate is greater than the flow of the brook therefore
effluent discharge levels for Meadow Brook are set at AWQC
Tables 1-16 through 1-19 compare effluent discharge levels for both the Neponset River and
Meadow Brook to carbon adsorption effluent from the groundwater treatability study
Table 1-16 summarizes the concentration of metals in untreated groundwater the metals
concentrations remaining foUowing precipitation and filtration the metals concentration
foUowing aeration and carbon adsorption the metals concentrations foUowing caition
adsorption only the MCLs and the effluent discharge levels based on discharge to the
Neponset River The only metal effluent concentration which exceeds the MCLs is
aluminum the MCL for aluminum however is a secondary MCL which is nonenforceable
No metals concentrations in the effluent exceed any of the effluent discharge levels
n 28
c TABLE 1-15 FULL-SCALE TREATABILITY STUDY AERATION AND CARBON ADSORPTION RESULTS Results in ugL
iiiiii|Mpt-HiiDiiii-iiiiii^iiiiiiiiiiii iii bullbullbull^(6-^1 iiiiii-iiiiiiiii iiiiiiiiii^g-2iiiiiiiiiii|i
l | | | ibyNigtii i i i i | i i i i i i i | ivi
VOLATILE ORGANICS
Mediylene Chloride 6 U 4 U Carbon Tetrachloride 1 U 01 J Toluene 02 J 1 u Total Xylenes 1 U 1 u Acetone 5 U 5 U 2-Butanone 5 U 5 U 2-Hexanone 5 U 5 U 4-Methy 1-2-pentanone 5 U 5 U Carbon Disulfide 1 U 1 U
c Notes Only volatile organics detected in any sample are included U = undetected at specified detection limit J = value is estimated due to validation criteria
iiiiiA61iiiiiiiiiiiii
3 U 1 U
02 J 01 J
5 U 5 J 5 U
5 U 1 U
i|AGii[ijiiifii
3 U U
01 J 1 U 5 U 5 U 5 U 5 U 1 U
i^^^iiiiiic|ii[|ili
10
1 u 1 u 1 u 5 U 5 J
5 U 5 U 1 U
29
c
o o o
o
Gas Phase GAC or Catalytic Oxidation
To ^ Ambient
Air
To Groundwater Recharge or
Raw Treated ) Neponset River Groundwater Groundwater Influent Holding Tank J
Solids for Offsite Disposal
(NOTE Air stripper not necessary if discharge to Neponset)
FIGURE 1-3 PROPOSED GROUNDWATER TREATMENT SYSTEM SCHEMATIC
2483JP
o n o TABLE 1-16 COMPARISON OF INORGANIC FULL-SCALE TREATABILITY STUDY RESULTS TO MCLS AND DISCHARGE LEVELS
[i^i^^^^ iiiiiiijiMf|iilaquo4 Precipitation Aeration and Carbon AdsorpUoi iiiiiiiiiiiiiiiiiiiiiiritliiiiin
iiiii iiSiiii|iiiiiiiiiiiiiiiii and Filtration M^ Iiiiiiiiiiiiii iiiiiiiii|iiii|i|iiiiiiiiiii liiiijlliiiii
iiiiiiiiiiiiiiiiiiiii iiiiiiiiiiiiii i i i i i i i|ii||iiiiiiiiiiiiiiiiiiiiiiiii iiiiiiiiiiiiiiiilii Giliii iiiii ii iiiii i iiiic iD|i laquoi|iiiiiiii iiiiitiiiiciiiiiiiiiiiii
Discharge levels calculated by multiplying AWQC by a dilution factor based on a 100 gpm treatment discharge rate and a Neponset River 7Q10 of 2020 gpm
U = Undetected at specified detection limit
J = Estimated value due to validation criteria
NC = No criteria exists for the compound
P = Proposed MCL
S = Secondary MCL
n n o TABLE 1-17 COMPARISON OF INORGANIC FULL-SCALE TREATABILITY STUDY RESULTS TO MCLS AND DISCHARGE LEVELS
DISCHARGE TO MEADOW BROOK
[isjiiiiiiiiiiiiiiii-ii |iiiiiiiiiiiiiiiiiiiiiiiiiiiiiiiiiiiiiiiiiiiiiii iiiiiiiiiiiiiiiiiiiiiiiiiiiiii iiiiiiiiiiiiiiiiiiiiiiii- iiiiiiiiiiiiiiiiiiiiiiiiiiiiiiiiii ^iiiiiiiiiiiiiiiiiiiiiiiiiiiiiiiiii bull immMmii^^ F- piiiipiiiiil i i i i i i i i i i i AcraUon and Caibon AdsorpUon iii iii iiii i i i i l l l i i i i i i ^ ^ i p t ^ sectffllM^ ^ ^
Ajumin iw u i 358 bull490 z ii 240 i--lJi iiiiiiiiiiiJ^3iiitJi i i iii i3 lliiiiiiiiii iiii|ii]^(Ciiiiiiiiiii-iii-iiiiiiii5iiiii-iiiiiiiiNC^ Antimony 2i ij NA 44 U i44 U 44 U 44 U 44 U 10 P 88 30 8600
Ariseiaic- iiiiiiiiiiiiiiiiiiiiii8iiiiiiiiiiiiiii iiiiiiiiii-iis- - iiiiiiiiii- 1 u 71 J i-iiiiiy3|ili-uj - i i i 9 l i j i iii--5Qiiiiiiiiiiiiii iiiiii NC- NC - iL | Barium 247 32 106 U 65 U 597 49 U 131 IJ 2006 NC NC NC
Blaquoay|Hiiraquosi-- bullbullbull--bull i-iiiii-iiiiii3iiiiiiliiiiiiii -iiiiiiiiiiiNAi-iiiiiii I u -- 1 U iiiiiiiiiliilliiiiii-ii|iyi- iiiii iiiiiiiiiiiiiiiiii ii|i|40 - 53-bullbull13|shyCadmium ( S i u bull bull bull bull bull bull bull bull bull N A 4 UJ 4 UJ bullr^^ 4UJ 4UJ 5 682 038 170 Cai lc turn i bull- iiiiii3PiOCfiii iiiiiiiiiiii iiiiiiiiii^iiiiiiiiiiiiii 9650 i 8360 iiii7886iiiiiiiiiiiiiiiiiiiiiiii^iiiiiiii-ii6^^ iiiiii5isNltiiiiiiiiiiiiiiiiiii iiiiiiNC NGi NC Chromium 315 NA 8 J 7 UJ 7 u j 7 uj 7 iirj 160 16 11 3206
CO i-iii-iiii 33iitiii-iiiiii ii-iiiii-i-Jfiiiiii--iiii - bull bull 4 U Z 4 U- iiiiiiiiiiiiiilii-uiiiiiiiiiiiiiiiiiiiiiii4iitjiii-iiiiiiiiiii4 iiiiii-ii Nltiiiiiiiiiiiiiiiiiiiiii i l i iNc-- -NCi^-NCi
P ^ i bull bull Copper 6 4 i NA 128 U 179 U bull64Uj 9 U --256--u-- 1300 48 36 NC
Jtaa- iiiiiiiiiiii ltJOlt iiiiiiiiiii isiiiiiiiJQiii-i - z 6AS U ii232U-^^ bulliiiiiiiiiiiiiiiiiiiiuiiiiiiiiiiiiiiiiiiiiiiiiiiiiiiiiiii2 ipit|iiiiii iiiiii3pQiiiiJiiiilii liiiNC- v 1000- bull- NCi head 253 5^U^ 35 U 46 U 21 U 12 U J 2^4 u 14 054 NCis |Magnlaquoaiuiai iiiiiiiiiiilaquo)6iiiiiiiiiiiii iiiiiiiiiiii|lS)6iiiiiiiiiiiiii 3700 7060i V^ bulliiiMiiiiiiiiiiiiiiiiiii3Jpiiiiiii7^0iiiii^^^ i iiigtKSiiiiiiiiiiiiiiii bulliii I N C bull N C Ncjii Manganese 4810 bull356 62 U 18 UJ 23 U 35 U 53 U 56 S NC NC 106
Wtercuryi iiiiiiiiiiiiiiiiiiiiiiiiyiiiMiiiiiii iiiiiiiiiiiiiiiiiNAiiiiiii i P-2 U bullbull 0 2 U-- iiiiiiiiiiiiiiiiOi|iiittiiiiiii|iiiii 6iiiiit|iiiiiiiiiiiiiQ|iit|iiiiii iiiii|i|iiiiiiiiiii iiii|iii24- -- oon --0i|i Nickel 281 isrA 181 UJ 244 UJ 269 uil 17 U 356 il 166 P 643 33 3800
Potraquoslaquolum -iiiiiiiiiii4liS0iiiiiiiiii iiiiiiiiiiiii PPQiiiiU i 2200 U i ii 2620 XT | |i |owiiyiiiiii | |(^iiiiiiiiiii^ iiiiiiiiiiiiiiiW|iiiiiiiiiiiiii iii iii|ip--i NC- bullbullbull-KCii Selenium 20 U NA 32 U 13 UJ 1 6 u 1 UJ i u 5 6 266 50 6800 Sflycri i-i- iiiiiiiiiiiiiiiiiiiiiiiiiiiiiiiiiiiiiii iiiiiiiiiiiiiiiiiii iiii- i-4U bull -^M- U iii bull i i i i | | i | | i i i i |-i i | i | l | i i i i | i i i i iiiii-i ^66iiiiiiiiiiiiiii i|iP37 -0i2iNi Sodium 1 2 3 6 6 6 9 5 5 6 6 99000 lOlOOO 99866 106066 74566 NC NC NC NC
I m iiiiiiiiiiiiiiiiiiiiii||jriiiiii||iii|i|iii|| | ii46Q ^40- -bull-3iThaUJiiiitt - iiiiiiiiiiiiiiiiiiiiiiiiiiliiiiiiiiii iiiiiiiiiiiiiiNAii- I UJ ^ iiiiiiiiiiiiiiiiii Vanadium 439 NA 5 U 83 UJ 5 U 5 IJ 0 IJJ NC NC NC NC
Ziiicii^ iiiiiiii-iiiii- 488iiiiiiiiiiiiii iiiiiiiiiiii6iiu 151 U 67 UJ iiiii iiiiiiiiiiiiiiiil52iU- iiiiiiiii2 liiiiiiiiiii iiJiOQ()ii- Siiiiiiii iiiiiiiiii|6 bull bull33 - N C i
Notes
Discharge levels are AWQC (10-5 risk) since the treatment discharge rate of 100 gpm is higher than the flowrate of Meadow Brook
U = Undetected at specified detection limit
J = Estimated value due to validation criteria
NC = No criteria eus ts for the compound
P = Proposed MCL
S = Secondary MCL
o n o TABLE 1-18 COMPARISON OF ORGANIC FULL-SCALE TREATABILITY STUDY RESULTS TO MCLS AND DISCHARGE LEVELS - DISCHARGE TO THE NEPONSET RIVER
||x|o | bull iiii||i||il|A iiiiii iiiiiiiiliiiiiiiiiiili ii5iiPo|laquo|o|i iii||l|i|i||ii||y E^ly1 C DoteslOO ii i^i|raquoiiipltii=(iiiii|iii iiii i i w i M w iiiiiiilliHiJLYiiii iiiiWiiiiii iiiiiiiiiiiiii ii iiiiiiiiiiiiiiiiiiii iiiiii iiii iiiiiiiiiii iiiiiiiiiiiiiiiiii iiiiiiiiiililiiiiiiiiiliiiiii bulliiiiii lagaiiiiiiiii iiiiiiiiiiiiiiiiiiiiiiiiiiiiiiiii (ugL) iiiiiiii^iiiiiiiiii iiiiiiiiiiiiipiiiii iiUiiiiiii^ WmnKiiiiiii i(iiiiiiii i iii iiiiiiiiiiMiiiiii VOLATILE ORGANICS
112-Trichlorocthane 5 J 25 U 1 u 1 u 1 U 1 u 1 u 5 NC NC 8904
1122-TetrachIororthane 16 J 25 U 1 u I u I U 1 u 1 u NC NC 50880 2332
Chloroform 4 J 25 U 1 u 1 u 1 U I u 1 u NC 612680 26288 3328
Vinyl Chloride 10 U 50 U I u 1 u 1 u 1 u 1 u 2 NC NC 111300
11-DichIoroethene 10 U 25 U 1 u 1 u 1 u I u 1 u 7 245920 0 403
12-Dichloroethene (total) 200 D 97 1 u 1 u 1 u 1 u 1 70 245920 NC 29680000
Trichloroethene 860 D 430 1 u I u 1 u 1 u 2 5 954000 464280 19504
Tetrachloroethene 5 J 25 U 1 u I u 1 u 1 u 1 u 5 111936 17808 1876
Xylenes (total) 1 J 25 U 1 u 1 u 01 J 1 u I u lOOOO NC NC NC
Chlorobenzene 5 J 25 U 1 u 1 u 1 u 1 u I U NC NC NC NC
SEMIVOLATILE ORGANICS
Pentachlorophenol 25 U ND 25 U 25 U 25 U 25 U 25 U I 424 276 NC
Chlorobenzenes(total) 5300 1060 NC
13-Dichlorobenzene 3 J 2 10 U 10 U 10 U 10 U 10 U 600 NC NC 55120
14-Dichlorobenzene 17 9 10 U 10 U 10 U 10 U 10 U 75 NC NC 55120
12-Dichlorobciizcne 7 J 5 10 U 10 U 10 U 10 U 10 U 600 NC NC 360400
124-Trichlorobenzene 2400 D 50 10 u 10 u 10 U 10 u 10 U 9 5300 1060 NC
PESTICIDESPCBS
Arocloi-1254 36 J 32 NA 01 u NA OI u NA 05 42 03 01
Heptachlor 0074 J NA NA NA NA NA NA 04 11 01 01
Aldrin 017 J NA NA NA NA NA NA NC 64 NC 002
Heptachlor Epoxide 0045 J NA NA NA NA NA NA 02 NC NC NC
gamma-Chlordane 0056 J NA NA NA NA NA NA 2 51 OI 01
Notes
Discharge levels calculated by multiplying AWQC (10-S risk) by a dilution factor based on a 100 gpm treatment discharge rate and a Neponset River 7Q10 of 2020 gpm
Compounds presented are only those detected in the untreated groundwater sample
NA = Not analyzed J = Estimated value due to validation criteria
NC = No criteria exists for the compound D = The reported value is from the diluted analysis
U = Undetected at specified detection limit P = Proposed MCL
o n o TABLE 1-19 COMPARISON OF ORGANIC FULL-SCALE TREATABILITY STUDY RESULTS TO MCLS AND DISCHARGE LEVELS - DISCHARGE TO MEADOW BROOK
i 1 liiiisisi i ii iii iii|i|i i l i 11 i |ii^^ i i i i i i i i iiiiiiiiiiiiiiiiii iiiiiiiiiiiiieiciidiiiiii iiiiiiiiiiiiii iiiiiliiiiiii^^iiiiii iiiiiiiiiiiiiiiiiiii iiliiiii i iiiiipiiiliiiiiiiliiii iiiiiiiiiiiiiiiiii iiiii|iii|i|i-iiiiii iiAVQiii|iiiii i ii-iiiiiiigt-iiii ^^
iiiiiiiiiiiiiiii iiiiiiiiiiiiiiiiiiiiiiiiiiiiii iiiiiiiiiiiiiiiiiiiiii I i i i i i i i i||i|i|||iiiiiiiiiiiiiiii|iiii iii-|iiilaquo|i3[i|ii |||^|ii^|i|^|iii i (3 i i ^ ^ l i i illjliii^jiii^ iieip|i(iii|i iiiiiiiiiiiiiiiiiiii i^|iii|(iiiijiii|)|r^ iiii-iiliiiiiiiiiiiii ||i |illlli|i i|li|i|ii iiiiiiiiiiiiiiiiii iiiiiiiiiii|tiiiiiiiiiiiiiiiiiii iiiiiiiiiiiifiiiiiiiiii iiiiiiiiiiiiiiiiilaquoiiiiiii iiiiiiiiiiilliiiiiiiiiiiiiiii i (laquoy^ iiiiiiiiiiiii(Wiiiiiiiii iiiiiiiii i lK^ iiiiiiiiliiiiiiiiiiiiiiiii (ugl)iii iiMiiiiiii VOLATILE ORGANICS
112-Trichloroethane 5 J 25 U 1 u 1 u 1 u 1 u 1 u 5 NC NC 420
1122-Tetrachloroethane 16 J 25 U 1 u 1 u 1 u 1 u 1 u NC NC 2400 110
Chloroform 4 J 25 U 1 u 1 u 1 u I u 1 u NC 28900 1240 157
Vinyl Chloride 10 u 50 U 1 u 1 u 1 u 1 u I u 2 NC NC 5250
11-Dichloroethene 10 u 25 U 1 u 1 u 1 u I u 1 u 7 11600 NC 19
12-Dichlorocthene (total) 200 D 97 1 u I u 1 u 1 u 1 70 11600 NC 1400000
Trichloroethene 860 D 430 1 u 1 u 1 u I u 2 5 45000 21900 920
Tetrachloroethene 5 J 25 U 1 u 1 u 1 u 1 u 1 U 5 5280 840 89
Xylenes (total) 1 J 25 U 1 u 1 u 01 J I u I U 10000 NC NC NC
Chlorobenzene 5 J 25 U 1 u 1 u 1 u 1 u I u NC NC NC NC
SEMIVOLATILE ORGANICS
Pentachlorophenol 25 U ND 25 U 25 U 25 U 25 U 25 U 1 20 13 NC
Chlorobenzenes(total) 250 50 NC
13-Dichlorobcnzene 3 J 2 10 U 10 U 10 u 10 U 10 U 600 NC NC 2600
14-Dichlorobenzene 17 9 10 U 10 U 10 u 10 U 10 U 75 NC NC 2600
12-Dichlorobenzene 7 J 5 10 U 10 U 10 u 10 U 10 U 600 NC NC 17000
124-Trichlorobenzene 2400 D 50 10 u 10 u 10 u 10 u 10 U 9 250 50 NC
PESTICIDESPCBS
Aroclor-1254 36 J 32 01 u 01 u OI u OI u NA 05 20 0014 00045
Heptachlor 0074 J NA NA NA NA NA NA 04 052 00038 00029
Aldrin 017 J NA NA NA NA NA NA NC 3 NC 000079
Heptachlor Epoxide 0045 J NA NA NA NA NA NA 02 NC NC NC
gamma-Chlordane | 0056 J NA NA NA NA NA NA 2 24 00043 00048
Notes
Discharge levels are AWQC (10-5 risk) since the treatment discharge rate of 100 gpm is higher than the flowrate of Meadow Brook
Compounds presented are only those detected in the untreated groundwater sample
NA = Not analyzed J = Estimated value due to validation criteria
NC = No criteria exists for the compound D = The reported value is from the diluted analysis
U = Undetected at specified detection limit P = Proposed MCL
Table 1-17 shows a comparison of effluent to effluent discharge levels based on discharge to c Meadow Brook assuming a dilution factor on one If the treated groundwater was discharged
to Meadow Brook effluent discharge levels for arsenic would be exceeded Since arsenic is
a difficult compound to remove in a groundwater treatment plant it is concluded that
Meadow Brook may not be usable as a discharge point
Table 1-18 presents concentrations of organic contaminants in untreated groundwater from
MW-IA the precipitated and filtered effluent the effluent following both aeration and
carbon and the effluent from carbon adsorption only These values are compared to MCLs
and effluent discharge levels Only one carbon dose for the carbon only study the lowest
dose of 05 g carbon1000 ml groundwater is shown as a conservative example In both
cases using aeration and carbon and carbon alone organic contaminants were removed to
below MCLs and to below discharge levels Therefore aeration at an air-to-water ratio of
251 and a carbon dose of 05 g carbon1000 ml groundwater effectively removed volatile
organics semivolatile organics and PCBs from the groundwater
c It is expected that a maximum air-to-water ratio at 251 will be effective for an air stripper
onsite because full-scale air strippers are many times more efficient than the bench scale
models This is due to the greater surface area and turbulence found in the stripper The
off-gas from the air stripper will have to be treated to meet applicable standards either by a
catalytic oxidation unit or a vapor phase carbon adsorption system
Since no vinyl chloride was present in MW-IA and vinyl chloride is a difficult compound to
remove with carbon adsorption tests were performed with groundwater from ME-8 which
contained 210 xg1 vinyl chloride These results were presented in Table 1-13 which shows
that air stripping at an air-to-water ratio of 251 is effective in removing vinyl chloride In
order to reach the MCL of 2 figl for vinyl chloride an air stripper is required Carbon
adsorption alone would not remove vinyl chloride down to the MCL If the treated
groundwater is discharged to the Neponset River instead of being reinjected an air stripper
to remove vinyl chloride is not necessary since the discharge level is 111300 xg1
35 c
Table 1-19 shows a comparison between the organic concentrations in treatability study c effluents and effluent discharge levels based on discharge to Meadow Brook All volatile and
semivolatile organic compounds are removed to the effluent discharge levels It is
impossible to determine if PCBs were effectively removed since the most stringent discharge
level is 0014 xgL and the detection limit in the study is 01 xgL Discharge to Meadow
Brook may not be feasible due to 1) the treatability study cannot prove that PCBs are
removed to effluent discharge levels and 2) arsenic concentrations in the treated effluent
were higher than effluent discharge levels (based on a dilution factor of one)
The preliminary results of the sludge analysis indicate that the sludge is nonhazardous under
RCRA and TSCA Once the fiill scale groundwater treatment system is on line samples of
the sludge should be reanalyzed to confirm the preliminary results and to further assess the
disposal options
In summary the results of the treatability study indicate that groimdwater from the Norwood
PCB site can be treated effectively to allow discharge to either the Neponset River or r gtlaquo^ reinjection back into the aquifer If treated groundwater is reinjected the treatment plant
must include an air stripper to remove vinyl chloride If treated groundwater is discharged
to the Neponset River an air stripper is not necessary to meet discharge levels however the
use of Best Available Technology (BAT) may be required which would necessitate the
inclusion of an air stripper A cost comparison between an air stripper combined with
liquid-phase carbon versus liquid-phase carbon alone was performed and reported in the
Modeling Report The conclusion was there is not a significant difference in cost the
present worth assuming a discount factor of 8 and a 16-year period of perfonnance was
135 vs 102 million dollars (see Volume 2 Section 3) These costs will be evaluated
further during the design phase of the project The efficiracy at the full scale plant can be
optimized to ensure that at no time will the effluent from the plant exceed any applicable
groundwater or surface water standard
36 C
Section Two
c
c
20 ROCKS
21 Introduction and Objectives
There are several sources of rocks potentially contaminated with PCBs present on the Grant
Gear property portion of the Norwood PCB site Three different sources of rocks were
collected for analysis from the Grant Gear property The three rock sources included
overburden rocks from a trench west of the Grant Gear facility and below the interim
remedial cap crushed stone from the interim remedial cap west of the Grant Gear facility
and pea stone from the upper and lower roofs of the Grant Gear facility Throughout this
section rocks collected from on top of the interim remedial cap will be referred to as cap
rocks and overburden rocks wUl be referred to as trench rocks The rock collected from the
roof were analyzed under Work Plan 1 and are discussed in the Building Investigation
Report
The objective of this portion of the predesign work was threefold
bull To determine the PCB contamination if any on the different sources of rocks
bull To assess the feasibility of dry tumbling as a remedial altemative for the rocks
bull To assess the feasibility of water washing as a remedial altemative for the rocks
The dry tumblingwater washing was conducted on rocks that were reported to be too large
to be remediated with overburden soils by the solvent extraction technique
22 Description of Work
Samples of the three sources of rocks were collected by Metcalf amp Eddy personnel on
January 8-10 1992 Refer to Figure 1-1 for the locations of the trench and the cap rock
37 c
sampling points The samples were delivered to ENSECO laboratory in Cambridge
c Massachusetts and stored in a refrigerator at 4degC prior to sample preparation and analysis
Metcalf amp Eddy performed the sample preparation portion of the PCB analysis Rock
samples were weighed and gently placed in precleaned two liter glass beakers A quality
control surrogate compound was then added to each sample or method blank for subsequent
percent recovery determination The rocks were then immersed in extraction solvent
consisting of 30 percent acetone and 70 percent hexane by volume iEach sample and blank
was heated to 50degC and intermittently swirled by hand for a thirty minute extraction time
The extracts were then dried using sodium sulfate concentrated to 10 milliliters final volume
and submitted to ENSECO for PCB analysis using EPA SW846 Method 8080
The trench rocks were divided into three size categories with average diameters of one inch
two inches and three inches The rock size is an important consideration for the solvent
extraction remediation technique
^s^^ The three trench rock sizes and six cap rock samples were analyzed initially to determine the
extent of PCB contamination As outlined in the Quality Assurance Project Plan a second
portion of the cap rock sample with the highest initial PCB concentration was subjected to
water washing remediation and analyzed for PCBs Separate portions of the trench rock
samples were subjected to dry tumbling for ten and thirty minute intervals and water washing
for ten and thirty minute intervals The remediated rocks were then analyzed for PCBs
The dry tumbling and water washing were performed using an electronic rotary device The
rock samples were placed in clean two liter plastic sampling containers with screw cap
closures Laboratory distilled deionized water was poured into the water wash test
containers while the dry tumble samples had only the rocks enclosed
38 c
c 23 RESULTS
The one-inch average diameter trench rocks were initially contaminated with 1800 mgkg of
Aroclor 1254 Because the one-inch trench rocks were above the 10 mgkg cleanup standard
sample portions of the rocks were processed step by step through each of the four
remediations Although an eighty five percent reduction in PCB contamination was achieved
between the initial and final remediation samples the final concentration of 270 mgkg is still
well above the cleanup standard The results however showed a trend with the highest
concentration of PCBs detected on the initial sample lower PCB concentrations with the
ten-minute remediation and the lowest PCB concentrations achieved with the longest
thirty-minute remediation as expected The results for the one-inch trench rocks are
presented in Table 2-1
The two-inch average diameter rocks showed results similar to those of the one inch size
The initial sample had a concentration of 2500 mgkg of Aroclor 1254 The best
remediation result obtained was 450 mgkg for the ten-minute water wash sample A thirty c minute water wash sample for the two-inch trench rocks was not conducted when it became
apparent that a 10 mgkg cleanup level could not be obtained Because the 10 mgkg cleanup
level was not achievable the thirty minute water washing of two-inch rocks was not
conducted to minimize the level of effort and analytical costs The PCB result for the
thirty-minute dry screened sample 1900 mgkg Aroclor 1254 was higher than expected
This result was counter to the trend that was expected and observed with the one-inch rocks
and it demonstrates the non-homogenous nature of the rock samples This trend breaking
analytical result caused by the heterogenous or nonuniform nature of the rock sample matrix
was not repeated because the cleanup level could not be achieved The results for the
two-inch trench rock samples are presented in Table 2-1
The three-inch average diameter trench rocks yielded markedly different analytical results
The initial sample prepared with minimal on- site screening had a PCB concentration of
75 mgkg below the cleanup standard of 10 mgkg Although the initial result was below
39 c
TABLE 2-1 TRENCH ROCK WASHING RESULTS
Trench Rocks 1 inch Average Diameter
PCB Concentration
Sample mgKg
Initial sample 1800
Ten minute dry screened 620
Ten minute water wash 880
Thirty minute dry screened 290
Thirty minute water wash 270
Trench Rocks 2 inch Average Diameter
PCB Concentration
Sample mgKg
Initial sample 2500
Ten minute dry screened 490
Ten minute water wash 450
Thirty minute dry screened 1900
Trench Rocks 3 inch Average Diameter
PCB Concentration Sample mgKg
Initial sample 750
Ten min dry screened 210
Ten min water wash 025 UJ
Aroclor 1254 was the only PCB detected UJ - The sample was nondetect for PCBs to the estimated detection limit
of 025 mgKg
40
the cleanup standard it was close enough to warrant the first ten minute dry tumble c remediation step The first remediation step with a PCB concentration of 21 mgkg
confirmed that the three-inch trench rocks are less contaminated than their smaller
counterparts The three-inch ten-minute water washed sample was not submitted for fiill
quality control PCB analysis in an effort to minimize analytical costs The ten-minute water
washed sample result is from a partial quality control PCB screening analysis and is reported
as estimated Because of the lag time in tumaround of analytical results this sample had
been prepared extracted and screened and the information was available therefore it is
presented herein The results for the three inch average diameter rocks are presented in
Table 2-1
Six samples of cap rocks were collected and analyzed for PCBs AU of the results were less
than 02 mgkg or 200 xgkg For these cap rock samples an action level of 50 xgkg was
established in the Quality Assurance Project Plan The 50 xgkg value is an action level
established by EPA for this study only and is not a cleanup level identified in the ROD The
action if the results exceeded 50 igkg was to water wash the most highly PCB contaminated c sample Water washing was performed on cap rock sample number two The initial result
for this sample was 150 xgkg while the ten minute water washed sample yielded 24 igkg
Aroclor 1254 The cap rock results showed fairly consistent PCB concentrations in the range
of 50 to 150 igkg Aroclor 1254 The results are presented in Table 2-2
24 CONCLUSIONS
The cap rock samples were all determined to have PCB concentrations approximately one
hundred times less than the cleanup level of 10 mgkg Water washing conducted on the
most contaminated cap rock sample removed approximately eighty five percent of the PCBs
initially present These cap rock samples contained some fine soil like material which was
perhaps windblown carried on tmck tires or created by friction This material contributed
to the measured PCB concentrations for the cap rock samples
41 c
c TABLE 2-2 INTERIM REMEDIAL CAP ROCKS ANALYTICAL RESULTS
LOCAiSifi iiiiiiiiiiiiiii--iiiiiiiiiiiiiiiiiiiiidiiiiiiliiiiiiiii^ 10 minute Water Wash iiiii|ijii|iiii|iii^ PCB Concentration (ligKg)
1 120 NA
2 150 24
3 110 NA
4 31 U NA
5 86 NA
6 71 NA
Notes Aroclor 1254 was the only PCB detected U - Sample was nondetect for PCBs to the reported
detection limit - The highest initial PCB concentration cap rock sample was
subjected to a ten minute water wash remediation
42
C
The results of the rock tumbling and water washing demonstrate that this form of remediation r will not achieve the cleanup level of 10 mgkg for the one-inch and two-inch average
diameter overburden rocks The three inch rocks are below the cleanup level without
remediation It should be noted that these overburden rock samples were coUected from one
of the most highly contaminated areas at the site based on the remedial investigation results
These samples therefore represent worst case conditions
The dry tumbling remediation steps did not remove aU of the adhered soU particles as
anticipated This adhered highly PCB contaminated soU contributed to the measured rock
surface PCB concentration because the PCBs were extracted from the soU as weU as the rock
surface during sample preparation
The water wash remediation was effective in removing aU of the adhered soU The results
indicate that the rock surface and near surfaces have been contaminated with PCBs which
cannot be removed by water washing but are extractable with acetonehexane
c During the trench rock coUection ample one-inch and two-inch average diameter rocks were
avaUable at shaUow depths The trench had to be dug deeper to obtain the three inch size
rocks Because of the relative immobiUty of PCBs in soU the PCB concentration decreases
with depth as reported in the remedial investigation This decrease in PCB concentration
with depth is part of the explanation as to why the three inch rocks showed less
contamination than the smaUer sizes Also a factor is the surface area to mass ratio As the
mass of the rock increases the surface area to mass ratio decreases Since the PCBs are on
the surface or near surface of the rocks as the relative surface area decreases with size or
mass the reported concentration wiU decrease correspondingly
During the trench excavation and overburden rock coUection a two- to three-inch lens of
dark oUy appearing materials was observed This material was analyzed with a PCB field
screening kit and found to contain in excess of 10000 mgkg PCBs Some of the one and
two-inch diameter rocks sampled appeared dark in color Because it was not known whether
43 c
c
the dark rocks were naturaUy colored or from the tarry lens and to keep the study unbiased
these dark rocks were sampled randomly with the remaining rocks The dark appearing
rocks were estimated to comprise approximately five percent of the one and two-inch rock
sizes Inclusion of highly contaminated rocks in the samples would boost the reported PCB
concentrations
Altemative remedial measures other than rock tumbUng and water washing include detergent
and water washing organic solvent washing or steam cleaning Although preUminary
indications from the solvent extraction vendors are that only up to one inch size rocks can be
handled the possibiUty of designing a treatment system to handle larger rocks wiU be
explored during the design phase of this project If the size of the rocks precludes them
from remediation by solvent extraction along with contaminated soUds a rock cmsher wiU be
employed to reduce the contaminated rocks to a size that can be handled Although other
altematives for rock remediation might work solvent extraction with contaminated soUs or
rock cmshing foUowed by solvent extraction appear to be the easiest most cost effective
means to achieve the cleanup standards Whichever remedial altemative is selected rock
washing would only be necessary on rocks with average diameters between one and two
inches coUected from soU highly contaminated with PCBs A very rough estimate of rocks
onsite between one- and two-inch diameters is approximately 5000 tons No remediation of
the rocks is necessary if the solvent extraction technology can handle two-inch size rocks
44 c
o C) o TABLE 1-2 COMPARISON OF ORGANIC CONTAMINATION IN GROUNDWATER WITH EFFLUENT DISCHARGE LEVELS - DISCHARGE TO THE NEPONSET RIVER
Phaie I RI umpling conducted in May 1988 Phaae II RI lampling conducted in April 1989
NC bull No criteria cxitta for thia compound
(1) Inaufficient Data to Develop Criteria Value preaented ia LOEL shy Loweit Obierved Effect Level
(2) Value preaented for carelnogeiia ia the 10-5 level
(3) Value preaented ia for dichloroethenea
(4) Value preieoted ia for trana 12-dichloroetliene
(5) pH dependent criteria (78 pH uted)
(6) Value preaented ia for chlorinated benzenea
(7) Value presented ia for total PCBa
(8) Effluent DiKhaige Limit based upon an effluent discharge of 5 gpm to the Neponset River during the 7-day low flow lOyr recurrence (2O20gpm)
USGS Pleasant Street Oauging Station on the Neponset River
(9) Dilution factor =[(5gpm+2020gpm)5gpml= 405
(lO)Concentration exceeds effluent discharge limit contaminant must be removed by Groundwater Treatment Plant before discharge to surface water [D=DAILY MAX A=AVG MONTHLY F=FISH]
-
-
-
- - -
-
-
-
-
-
o n o TABLE 1-3 COMPARISON OF METAL CONTAMINATION IN GROUNDWATER WFTH EFFLUENT DISCHARGE LEVELS - DISCHARGE TO THE NEPONSET RIVER
bull bull bull bull bull bull bull bull bull bull bull bull - bull bull bull bull gt gt bull gt bull bull bull bull bull - bull bulliii|vO|| iS iggJMLnei i iaD s-UNFILTEREDgssHis M-B33nsRmmMMM D A I L Y iiiiiiiiiiiiiAVGiiiiii |i mmmmMmmm Xy lira^li P H A S E I WtiiMM liwiAiiiii iiiiimiii iii-pHiwiiliiiii WampMM P H A S E I ilii iiwgiiiiiiiiiiiiiiiii|iiiii iiiiiiiiiiiiiiiiiiiili|i| iiii iiiiii iiiiiiiiiiiiiiiiiiii M A X I M U M iiiiipifriiii^iiii iiiiiiiiiiiiifiiii iiiiiiiiiiiiiiiii
555^gt5^5V555^^^^ i i i ilaquoiij S U R F A C E m m m Wtm^itM B E D R O C K bull bull gt f t bullbullbull B E D R O C K iiiFRiiliiiiiiiiiiiii iiiiiiijsiiiiiriiiiiiiiiiiiiiiii iiii|iiiiiiliiiiiiii E F F L U E N T E F F L U E N T E F F L U E N T iiiiiiiiiiiiiiiiii wmmm |||ii||li| |i IliAiiiiil WliampiMM liiiiltiilii^isiiii liiiiifctAXliii iiiAiiiiiiiiiiiiiiiii i^i^iibhreiiiiiiiiiiliiiiiiii liiiiiii iiHiiiiiiiiiiiiii- D I S C H A R O E D I S C H A R O E D I S C H A R O E iiiii imm^mi mmmn WmMm WBrnB
PARAlt4ETER W iMmm iiiiiiiii iiitjiiiii Wi^MMM iiii iiiiiiiiilii iiiaraquoliiii W-imMMi iiiiiiaiiiii mMmmmm iCSiiMAiiiiii O O N S U M P iiiiiiiVEitiiii liiiiisyifeEiiiiiiiii iiiiiiiiiitiiiiL iiii cii^i iiiiiifl|5iili iiiiiiili (UOW iiiiiiii (oon) iiiiult3piili (UOL) lzMcii0m (UGL) iipiiiiiiiiiiiiiiiiiiiiii ii|^(Siliiiiiiiiii|iiiiii (UOL) (2) (UOL) (6)C7) (IKJL) (6)C7) (UOn) (6) C7) i^iipi
M E T A L S
A h m i n u m 154000 390000 119 352 12500 43900 74 77 NA NA NA NC NC NC
fMgtimi-^ztm zmisectmi iMiMM wmmi M^iiiiampii iiJiiM 189 iiiiiiiiiisiiiiiilaquo3iii iiiiiiiiiiiiiiiiiiiiiifii iiiiiiiiiiiliiiii^-iiiii isiiiiiiiiiiisiiiii CJiiiiiijiii iiiiiiiiiiiiiStCiiiiiii iiiiiiiiiiiiiiiiiiiiiiiiiiiiM bullsiiiii iiiiiiili5 iiiiiiiiiiiiiii|iiiiiiiiiigtireii iiiiiiii-shy bull bull bull bull bull bull bull bull bull iiiiiiliiiiiiWiii bull bull laquo raquo - iiiiiiiiiililiiiiiiiilifii iiiiiiiiiiii iii|iiiiiiiiiiiiiiii l i i i i i i i i i i^ i l l l i s i i iiiiii i-iiiiiiiSiiiiiiisiiii iiiiiiiiiiiiiiiiii|fltii- 405000 iiiiiiiiiiilliiiiiiiiwii iiiiAiiishymBmmm imampmm WmMM Wimm iiiiillili iiiiiiiiliiiiiii
Lead 43 i t3 21 168 l i 37 30 168 14 (3) 054 p) NC 5670 219 NC
iiititlj^iusibiii^j iilllJii^ -M-W^M iiiiiiii^^i^ ii-|7laquo- L5W iiiiiiiiiiiiiilliiifii iiiiiiiiiiiiiiiltiiiiiiiiiiiiliiiiii ii5iiiiiiie iiiiiiiiiiii bullbull bull l t raquo iiiiiiiiiiiiiiiNC iiiiiiii isci i i i | | i i i | | i p i i II0M^I iiiiiliiiiiiiiilii WM^MmM ilillilflil i | | | l il |o| | l i i l i P liiiiiiiiii iiiiiiiiiiiiip8iii bullbull ( U si i l i l i iiiiii- iiii-li|i5 iiiiiiiiiiiiiiiiiiii iiiiiiiiiiipiiiiiiii-iiiiiiiiiiii -i- o-iil bull iiiiiiiiiiiiiiiiiiiiiiiiiiiM iiiiiiiiiiiiii iiiii iiiiii iiii iiiiii laquoiii
|i|||ii Iliii illl|iillSI |illliSl^| illillaquoii iiiiiiiiiiiiiiiiiiii iiiiiiiiiliiltiii laquo raquo iiiiiiiiiiiii||i||| iiiiiiiiiiiiii iii|i|ltoigttiiiiiiiiiiiiiiii i iiliiiiilii iiiiiiiiiiiii bull^bull i l iNc| i-|iiiii -i-iii ii gti5 i iiiiiiiili^^ iiiiiiiiiiii Oiiiiiiii|i bulliiiiiiii Sodium 14100 28900 12500 26raquo00 16320 33200 16300 68000 N c NC NC Nc NC Nc Thal l ium 10 10 58 10 1400 (1) 40 (1) 32 567000 16200 1296
igtPiiiilli MmmmiM liilililil iiliiiiisii iii|ii| bulliiii iiiiiisiiilii iiiiiiiiiiiii|i ii^|i iiiiiiiiiil iiiiiii iiiiiiii ii^iliiiiiiiNiilliiiiiiiji- bulli|iiiiiflaquoSiiiiiiiiiiiiiiiiii iii|lNe-|i-ii iiiiiiiiiisiiiiiiiiiiiiiiii Nc iiiiiii liiNCii iiiiiii iiiiiiiilifiei iiiii iiiiiii iilaquo|||il| mmmmi m m m i M iiiiiiiili iiiiiiiiiiiiiiiiisil i iiiisiiiiilllii iiiiliiiiiiiiliiiiiiiiiitii iiiiiiiiiiiiiiiiiiiiiiiiiiifiii iiiiiiliili-|s4ii iiilliiiiiiii ssiiiiiiiiiiiiii iiiiiiii^^iii-iiiii iiiiiiiiiiiiiiiiiiiiiiiliii i iiiiiiiiiiiiiiliiiiiiii 13365 iiiiiiiliiiiiiiiiiiiip^ P b a i e I RI sampling conducted in M a y 1988 Phase II RI samplmg conducted in Apri l 1989
N C = N o cri teria exiata for th is compotmd
N A = N o t Available
(1) Insufficient Data to Develop Cri ter ia Value presented is L O E L - Lowest Observed Effect Level
(2) Value preaented for careinogena ia the 10-S level
(3) Hardness dependent c r i te r ia (25 mgA C A C 0 3 uaed)
(4) Value presented is for Ihe m o r e toxic hexavalent form
(5) Value presented is proposed (more conservat ive)
(6) Effluent Discharge L imi t dilution factor based upon an effluent discbarge of 5 gpm to the Neponse t River during the 7 - d a y low flow lOyr recurrence (2020gpm)
USOS Pleasant Street Oaug ing atation on the Neponset River
(7) Dilut ion factor =[(Sgpm+2020gpm)Sgpm]= 405
(lO)Concentration exceeds effluent discharge limit contaminant must be removed by Groundwate r Treatment Plant before discharge to Ihe Neponset River [ D = D A I L Y M A X A = A V O M O N T H L Y F=FISH]
c and 1-3 for effluent (Uscharge limits for organic and inorganic compounds An acute toxicity
test showed that no toxic effect was observed for the interim treatment discharge
114 Conclusions
Based on the results of the Phase I bench scale treatabUity study the combined unit
operations of fUtration foUowed by carbon adsorption were effective in treating the
contaminated groundwater coUected during the pumping tests for temporary discharge to the
Neponset River A sample of the discharge was coUected during the groundwater treatment
and it was found to contain less than the quantitation limit of 05 xgL of PCB The metals
concentrations were aU determined to be below the discharge criteria A sample was also
coUected and submitted for an acute toxicity determination The resuUs showed that no toxic
effect was observed The bench scale treatability results and the on-line discharge analyses
demonstrate that the filtration and carbon adsorption unit operations were effective temporary
treatment techniques
^ 12 FULL SCALE STUDY
A groundwater treatability study was conducted to evaluate the performance of four different
treatment processes on contaminated groundwater obtained from the Norwood PCB site The
contaminants present in the groundwater were determined during previous studies conducted
in May 1988 and AprU 1989 by EBASCO Chapter 1 of the Final FeasibUity Study
(EBASCO 1989c) contains an overview of the results obtained during these investigations
Based on the resuUs of the May 1988 and AprU 1989 field investigations EPA concluded
that the overburden and bedrock aquifers beneath the site were contaminated with
polychlorinated biphenyls (PCBs) and volatUe and semivolatile organic compounds (VOCs
and SVOCs) It was determined that surficial and subsurface soUs dredge pUes of sediments
taken from Meadow Brook sediments in Meadow Brook and sediments in the drainage
system of the buUding operated by Grant Gear were the sources of the contamination In
r
c September 1989 EPA released the Record of Decision (ROD) for the Norwood PCB site In
the ROD EPA directed that groundwater be treated with a system including activated carbon
air stripping with vapor controls and precipitationfiltration iEPA also directed that
treatability studies or pUot studies be conducted to aid in the overaU design of the system
In accordance with the ROD a bench scale treatabUity study was conducted at the ENSECO
Laboratory Facility in Cambridge Massachusetts by Metcalf amp Eddy personnel between
January 14 and February 16 1992 This report presents a description of the work
completed resuUs and conclusions of the study
121 Objectives
The fuU-scale groundwater treatability study was conducted to determine if treatment
consisting of precipitation fUtration air stripping and carbon adsorption would effectively
remove the contamination present in the groundwater at the Norwood PCB site to appUcable
standards Information on the percent reduction of organic and inorganic compounds in the
groundwater volume type of residual and byproducts produced by each component were
also investigated A schematic detailing the treatability study and the sampling and analysis
conducted is presented in Figure 1-1
122 Description of Work
The treatability study was performed in accordance with Pre-Design Work Plan 3 and the
QuaUty Assurance Project Plan for the Phase n Bench-Scale TreatabiUty Study (Work
Plan 3)
Groundwater samples were coUected from the Norwood PCB site for use in this
investigation Interim sampling was performed on effluent streams generated from each
bench-scale process for analysis according to Table 1-4 Influent and final effluent samples
generated during the groundwater treatabiUty were coUected and analyzed through the CLP
^
o JAR TESTING SAMPLE ID
o
POLYMER TESTING
RAW GROUNDWATER
VOL 1 SVOL I p PCB f ^ ^ METALS
mdash SST
T
T
T
SS - Choose Polymer T ar)d Dose Estimate pH pf i After Coagu lant
Jar Test 1 PH10 bull
Lime wCoag wPdymer - SS T Metals
Ume wCoag wo Polymer - SS T Metals
- NaOH wCoag wPolymer - SS T Metals
NaOH wCoag wo Polymer - SS T Metals
Jar Test 2 pH9
Jar Test 3 pH8
bull
Lime w C oag wPdymer - SS T Metals
- Lime wCoag wo Polymer - SS T Metals
- NaOH wCoag wPolymer - SS T Metals
NaOH wCoag wo Polymer - SS T Metals
- Lime wCoag wPolymer - SS T Metals
- Lime wCoag wo Polymer - SS T Metals
- NaOH wCoag wPolymer - SS T Metals
- NaOH wCoag wo Polymer - SS T Metals
JT1 -1 shy
j r i -2 shy
JT1 -3 shy
JTI-4
j r 2 - 1
JT2-2 shy
JT2-3
j r2-4 bull
JT3-1 shy
JT3-2shy
JT3-3 bull
JT3-4 shy
HLTRATION TESTING
RIter Paper 1 - SS T Time mdash |
RIter Paper 2 - SS T Time-
Rlter Paper 3 - SS T Time -
CtHXise Filter Paper or Particle Retention Size
Sample Well Using Bailer
VOL SVOL PCB CLPMETALS (PPF-1)
Precipitate and Filter Using Optimized Polymer pH Coagulant and Filter
system for volatUes semivolatUes PCBs and metals AU interim samples were analyzed at
ENSECO in Cambridge Massachusetts AU data was vaUdated by MampE according to the
QAPP
1221 Groundwater Sample CoUection Groundwater for this study was coUected from
weUs MW-IA and ME-8 as shown on Figure 1-2 iMW-lA was chosen as a sampling
location because it was determined to be one of the most contaminated weUs on-site based
on previous investigations During the course of the treatabiUty study a decision was made
to obtain samples from ME-8 because results of the most recent sampling effort conducted by
ICF indicated that groundwater from this weU contained approximately 200 xgL vinyl
chloride whereas groundwater from MW-IA no longer contained any quantifiable amount
Removal of vinyl chloride by aeration needed to be demonstrated during this investigation
because vinyl chloride is not effectively removed by carbon adsorption
Groundwater samples were obtained on four separate occasions during the study as shown in
Table 1-5 On each occasion the groundwater was coUected in accordance with the Field
Sampling Plan Three weU volumes of water were purged from the weU using a centrifiigal
pump before any samples were coUected The pH temperature and conductivity of the
purge water was measured after each weU volume untU the measured values differed by less
than 10 for three consecutive samples to ensure the sample drawn was representative of the
water in the aquifer Samples for the metals precipitation and filtration study were coUected
using a centrifugal pump Samples for the air stripping and carbon adsorption study were
coUected with a teflon baUer to minimize aeration and possible loss of volatUes during
sample coUection
The samples were coUected in one gallon amber glass bottles and stored at 4degC Each
sample bottle wasfiUed to exclude a headspace in the bottle
e 10
200 200
SCALE IN FEET
D CAP ROCK SAMPLE LOCATION
bull WELLS
nOURE 1-2 GROUNDWATER AND TRENCH AND CAP
ROCK SAMPLING LOCATIONS
11
E T C A L F a EDDY
c TABLE 1-5 GROUNDWATER SAMPLING SUMMARY
Mode of Date WeU Amount Sampled pH Temp degC Conductivity SampUng
11392 MW-IA 10 gallons 62 8deg 220 umhocm pump
12792 MW-IA 16 gaUons 62 8deg 220 umhocm baUer
20392 MW-IA 16 gallons 62 8deg 220 umhocm baUer
20592 ME-8 2 gallons 64 8deg 230 umhocm baUer
1222 Precipitation Testing
General Chemical precipitation for the removal of metals was evaluated at three pH values
and three polymer dosages to determine the effectiveness of the treatment A preliminary
evaluation of different coagulants and polymers was conducted at three pH values by
r Metcalf amp Eddy personnel and a leading polymer vendor to determine which chemicals could
potentiaUy be used to precipitate groundwater Based on the results from the preliminary
evaluation jar tests were conducted by Metcalf amp Eddy personnel to aid in the determination
of the chemical dosages required to optimize the effectiveness of precipitation
Polymer and Coagulent Testing Polymer testing was performed by Metcalf amp Eddy and a
leading polymer vendor at the ENSECO laboratory faciUty in Cambridge Massachusetts
The effectiveness of anionic cationic and nonioiuc polymer was evaluated at three pH
values The best polymer was determined to be Drewfloc 2270 a low charge anionic high
molecular weight polymer This polymer was used in jar tests 1 through 5 The best
coagulent was determined to be Charge Pack 12 (CP-12) a higher charge cationic low
molecular weight coagulent The CP-12 coagulent was used in jar tests 1 through 5
described under jar testing
12 c
InitiaUy the effects of varying the pH of the groundwater sample was investigated Tests c were conducted at pH values of 80 90 and 100 with sodium hydroxide which had the best
settling characteristics based on visual observation and turbidity measurement Each polymer
was then tested at pH = 100 to evaluate Us effectiveness under optimum pH conditions
A formula of polymer and coagulant addition was developed based on visual observations
suspended soUds and turbidity analyses performed on each sample generated during the
investigation The anionic polymer effectively flocculated the existing smaU suspended
particles and the addkion of cationic coagulant removed iron and color when the pH was
raised to 100
Jar Testing Five jar tests were performed using the polymer and coagulants determined to
be effective during preliminary testing Jar tests 1 and 4 were conducted as dupUcates at
ph 10 Jar test 2 was conducted at pH 9 jar test 3 was conducted at pH 8 and jar test 5 was
conducted at pH 10 On each occasion prior to beginning the jar test the raw groundwater
was brought tol5deg-17degCina warm water bath The temperature was held constant to c eliminate the effects of temperature on reaction rates and solubUity
The foUowing is a description of activities conducted during the jar tests fti through 4 See
Figure 1-1 for details Four samples were evaluated during each jar test For each jar test
four 15 Uter beakers were fiUed with 1 Uter of raw groundwater The beakers were placed
on the stirrer platform and the paddles were lowered into the sample The jar stirrer was
operated at 80 revolutions per minute (rpm) The pH was then adjusted to the desired value
(pH = 10 9 8 10 for Tests 1 2 3 4) with a lime slurry in two samples and with a
sodium hydroxide solution (25) in the remaining two samples Lime was added to
investigate its effects on the precipitate and to evaluate its effectiveness in pH adjustment
The cationic coagulant was then added to each sample untU the concentration in solution was
30 mgL The solution was stirred at 80 rpm for 2 minutes to ensure complete mixing The
polymer was then added to one sample pH adjusted with sodium hydroxide and one sample
pH adjusted with lime Mixing continued for two minutes Next the solution was stirred
13 c
slowly orflocculated for five minutes at 20 rpm FinaUy the solutions were aUowed to
c settle for 10 minutes Visual observations were recorded and samples were submitted for
suspended soUds turbidity and metals analyses
Jar test 5 was performed to assess the removal of manganese and aluminum by preaeration
and permanganate additions (see Figure 1-1) Because no significant benefit was observed in
the previous tests when lime was used instead of sodium hydroxide sodium hydroxide was
used to adjust the pH in aU four samples to a pH of 100 in jar test 5 Only sodium
hydroxide was added to the groundwater in the first jar to determine the removal of
manganese and aluminum attributable to the formation of an insoluble salt at high pH
Sodium hydroxide and polymer were added to the second jar to evaluate the effectiveness of
the polymer Sodium hydroxide polymer and coagulant were added to sample 4 The
supemate from sample 4 was then fUtered This was performed to determine if the required
removal efficiencies could be achieved by chemical precipitation and filtration
Permanganate was added to sample 3 in addition to sodium hydroxide coagulant and
polymer to determine if the manganese and aluminum present could be chemicaUy oxidized c to a less soluble state which would enhance the efficiency of fUtration The supemate was
then siphoned off using clean tygon tubing and a syringe into the sample containers
Samples were submitted for metals suspended soUds and turbidity as illustrated on
Figure 1-1
1223 Filtration Testing A bench-scale filtration study was perfonned to determine the
optimum pore size of filter media that could effectively remove the suspended soUds in the
precipitated groundwater The determination of the removal efficiency for each filter was
based on the concentration of suspended soUds and turbidity of the filtered water The time
required to filter the groundwater was also evaluated
Prior to filtration the metals in the groundwater were precipitated and coagulent and polymer
were added using the optimum conditions developed during the precipitation study The
optimum conditions consisted of pH adjustment to 10 with sodium hydroxide addition of
14 c
coagulent CP-12 to a concentration of one percent and addition of Drewfloc 2270 polymer to
c a concentration of 10 mgl Three grades (10 xm 5 xm and 1 xm pore sizes) of filter
paper were used with a Buchner ftmnel to filter aUquots of the precipitated groundwater
Samples of the filtered water were submitted to ENSECO for suspended soUds and turbidity
analysis
A sample of the metal hydroxide sludge was coUected during the treatability study The
sludge sample was submitted to the CLP system for PCB and metals analysis so that a
characterization of the sludge could be made and disposal options could be evaluated
1224 Air Stripping Testing Precipitated fUtered groundwater was aerated at three
different air to water ratios to determine the most effective stripping ratio To ensure that
worst case volatUe organic compound concentrations were present in the samples for this
study some modifications were made in how the sample was coUected and treated First
the groundwater was coUected with a baUer to prevent the loss of volatUes AdditionaUy the
water was fUtered under positive pressure foUowing the precipitation step to minimize the c loss of volatUes that would result if the water was filtered using a vacuum pump
An aquarium pump tygon tubing and aeration stone with a glass-fiber fUter cartridge was
used to aerate 1-Uter aUquots of precipitated and filtered groundwater The aeration flow
rate was caUbrated by filling a graduated cylinder with air that had been filled with tap water
and inverted in a water bath The air was diffused at 375 missec into 1-Uter aUquots of
groundwater and the time measured as iUustrated in Table 1-6 The aerated groundwater was
submitted to ENSECO for volatUe organics analysis
1225 Carbon Adsorption Testing The effectiveness of activated carbon for the removal
of organic compounds in the groundwater at the site was evaluated The carbon used was
the powdered activated 325 mesh carbon suppUed by Calgon Corporation The groundwater
samples used for this investigation were obtained and filtered as described in the air stripping
15 c
c
c
TABLE 1-6 AERATION TEST OPERATIONS
Air to Water Ratio Volume Volume of by Volume of Water Air Reqd Min of Aeration
251 1000 ml 25000 ml 111 501 1000 ml 50000 ml 222 751 1000 ml 75000 ml 333
section of this report to minimize the loss of volatUes A total of twelve samples were mn
during this investigation The necessity of air stripping was investigated by comparing the
resuUs from four samples that were air stripped to seven samples that were treated identicaUy
with the exception of air stripping AU samples for the air stripping comparison went
through the precipitation filtration and carbon adsorption processes AdditionaUy one
sample was prepared with no carbon added to serve as an untreated sample The samples are
summarized in Table 1-7 Each groundwater sample was prepared and mixed with a
predetermined dose of Calgon powdered 325 mesh activated carbon and placed m an open
Erlenmyer flask on a shaker table for a two-hour time period at 180 rpm A rotary shaker
table capable of accommodating twelve (12)-1000 ml Erlenmyer flasks was used Effluent
was fUtered with a barrel filter using a glass-fiber pre-fUter and a Whatman 45 micron
membrane The effluent clear and odorless in aU cases was added to sample containers
preserved and packed for shipment to CLP laboratories Since the shaker table could
accommodate 12 flasks a total of approximately 4 gaUons of effluent was generated during
each mn Several mns were performed to generate adequate quantities of sample for
analysis accordmg to Table 1-7 Groundwater was simUarly prepared for submittal to
Aquatec Lab in Burlington Vermont for chronic toxicity testing Three (3) shipments of
approximately 2 gaUons each were made
r 16
C) o o TABLE 1-7 CLP TREATABILITY STUDY SAMPLING SUMMARY
Dose g of Carbon Required of mis in gs Carbon
Sample ID 1000 ml of GW Analysis Volume mis Flasks Flasks in each
Precipitation Filtration Aeration amp Carbon
AC-1 05 V SV MET 3400 3 1067 054 AC-2 20 V SV PCB 4400 4 1100 22 AC-3 50 V SV MET 3400 3 1133 57 AC-4 100 V SV PCB 4400 4 1100 110 AC-5 Trip Blank 0 V
Precipitation Filtration amp Carbon
C-0 0 V 500 1 500 0
C-1 05 V SV MET 3200 3 1067 053
c-2 10 V PCB 2200 2 1100 11
C-3 20 V SV CT 29000 24 1250 25
C-4 50 V SV PCB 4400 4 1100 55
C-17 70 V MET 1200 1 1200 70
C-18 100 V SV 2200 2 1100 110
C-13 Treatability Blank 0 V PCB 2200 0 0 0
C-20 Trip Blank 0 V 0
C-10 Duplicate of C-1 05 SV 2000 2 1000 05
C-1 05 (MSMSD) 500 1 500 025
C-11 Duplicate of C-1 05 MET 1000 1 1000 05
C-20 Duplicate of C-2 10 V PCB (MSMSD)
4400 4 1100 11
C-16 Duplicate of C-4 50 PCB 2000 2 1000 50
C-6 0 PCB 2000 2 1000 0
17
o o n TABLE 1-7 (Continued) CLP TREATABILITY STUDY SAMPLING SUMMARY
Dose g of Carbon Required of mis in gs Carbon
Sample ID 1000 ml of GW Analysis Volume mis Flasks Flasks in each
Precipitation amp Filtration
PPF-1 V SV MET PCB 2000 2 1000 0
Sludge
Sludge-1 0 MET PCB 0
V = VolatUe organics SV = Semivolatile organics MET = Metals PCB = Polychlorinated biphenyls CT = Chronic toxicity MSMSD = Matrix spikematrix spike dup D = DupUcate TB = Trip blank PPF = Precipitated and pressure filtered
(to minimize volatUes loss as opposed to vacuum filtration)
18
c
c
123 Results
1231 Precipitation Testing
Polymer Testing Preliminary polymer and coagulant testing was conducted to determine
the type of polymer and coagulant that could be employed to treat groundwater from the site
The Drewfloc polymer and the Drew CP-12 cationic coagulant were chosen as the most
effective types InitiaUy the effect of varying the pH of the groundwater sample was
investigated The resuUs of tests conducted at pH values of 80 90 and 100 are presented
on Table 1-8 As the pH value was raised the quaUty of the floe improved The sample
raised to a pH level of 100 with sodium hydroxide exhibited the best settling characteristics
based on the color turbidity soUds and the quaUty of the floe
The effects of varying the polymer dose was then investigated at pH=100 The cationic
coagulant added to a concentration of 30 ppm after pH adjustment and prior to polymer
addition produced the clearest supemate based on color turbidity and suspended soUds
results Table 1-8 also summarizes the results from this investigation
Jar Testing Four jar tests were performed to evaluate the effectiveness of chemical
precipitation for the removal of metals in groundwater from weU MW-IA The analytical
results from the jar test are presented in Table 1-9 The greatest metal reductions occurred
when the pH was 100 Samples for which the pH was adjusted with lime showed better
removal of barium manganese and sodium concentrations than those samples for which the
pH was adjusted with sodium hydroxide Samples for which the pH was adjusted with
sodium hydroxide showed greater declines in the concentrations of calcium and magnesium
No significant effect was observed on the removal of cobalt iron lead aluminum potassium
and zinc when lime or sodium hydroxide was used to raise the pH The observation that
samples for which the pH was adjusted with sodium hydroxide had elevated concentrations of
19 c
c TABLE 1-8 PRELIMINARY POLYMER TESTING RESULTS
Description of Supemate
Procedure pH ColorSoUds
mgl Turbidity
NTU Floe SettleabUity
Varymg pH
Raw Groundwater pH adjustedNaOH pH adjustedNaOH pH adjustedNaOH
62 80 90 100
YeUowbrownYeUowbrownYeUowbrownYeUowbrown
450 gt50 gt gt 5 0 gt gt50
58 SUght mst pin floe medium
gt medium
None Slow Faster Fastest
Varying polymer dose pH adjustment wNaOH
pH adjustedno polymer
100 YeUowbrown gt gt50 gt medium Fast
Above wpolymerat 1 ppm
100 Light yeUow lt 10 35 large 18 Fast
c Polymer at 5 ppm 100
Polymer at 1 ppm 100 wcoag 30 ppm
Light yeUow
Very Ught
lt 10
lt 10 yeUow
32
30
Large 18
Targe 18
Fast
Fast
n 20
o o n TABLE 1-9 F U L L - S C A L E TREATABILITY STUDY JAR T E S T R E S U L T S
Results in mgL
SAMPLE ID iiiiiiiiiiiiiiiiiiiiMW JAiSiiii iiiJTililiiiiiiiiiiii iiiJTil^iiiiiii iiiiiiiiiiTIi3iiiiiiiii iiiii^ii^li^iiiiiiiiiiiiii^iiri^iiiiisiiiiiiiiiiiiimii iiiiiJT4^iiiiiiiiiiiiiinP4i4iiiiiiiiiii iiiiiJT2iiliiiiiiiiiiiiT2^iiiiiii |i|S^ iiiiiiiiiiiiiiiiiiiiiiiiiiiiilM ii iiiiiiiiiiiiiiiiiiiiJlt iiiiiiiiii iiiiiiiiii-iiiiiiii iiiiiiiii=iiiiiiiiiiiiiliiiiii iiiiiiiiiiiiiiiiiiiiiiliiiiiiiiiiiiiiiiiiiiiiiiiiliiiiiiiiiiiiiM ii^iiiiiiiiiiiii6iiiiiiiiiiiiiiiiiiijqiiiiii mmsectlsectMimamp0^
Zinc 0488 002 U 002 U 002 U 002 U 002 U 002 U 002 U 002 U 002 U 002 U
E S A M P L E ID iiiiiiiiiiiiiiiiiiiiJT2i3iiiiiiiiiiiiiiiii ^T2-4iiiiiiiii iiiiiiiiJ^alliiiiiiiiiiiii iii^Ta^iiiiiiiiiiii iiiiiiiiit3|3iiiiiiiiiiiii iiilT3Tr4iiiiiiiiiiiiiii rrs-i iiiiiiiiiiiiiiJTSl iiiiiiiiiiiiiii iiiiiitJiJiiiiiiiiiii iiiiiiWs-4iiiiiiiiiiiii iiiiiiiJT5r-5ii|iiiiiiii
iiiiiiiiliiiiiiiiiiiiiiiiiBSsiii iiiiiiiiiiiiiiiiiiiiiilgtHiiiiiiiiiiii iiiiiiNaOHiiiiiiii iiiiiiiiiiii)iliimiiiiiiiii iiiiiiiiSiiriiiisiiiiiiiiii iiiiiiiiNiliiiiiiiiii iiiii iNapHiiiiiiiiiiiii iiiiiiiiiiiiiiiifloiiiiiiiii iiii^iiiiiiiiiii iiiiiiii NiitQHiiiiiiiii iiiiiiiiiWftOHiiiiiiii wmm iii^iiiiiiiisiiiiiiiAli|ilii iiiiiiiiiiixiiiiiEal3i iltgtoi PolyCoag C o a g u l a n t PolyCoag Coagulant iiiiiiii iiiiiii iiiiiii)|sihyii^iiiiiiii PolyCoag PolyCoag iiiPoij^iii^il ANALYTES Aerated KMn04
Barium 0073 0072 010 010 010 010 NA NA NA NA NA Calcium 247 247 571 574 273 277 NA NA NA NA NA Cobalt 001 U 001 U 0017 0018 0017 0019 NA NA NA NA NA Iron 01 U Ol U 016 023 016 043 NA NA NA NA NA Lead 0005 U 0005 U 0005 U 0005 U 0005 U 0005 U NA NA NA NA NA Magnesium 44 44 50 51 50 50 NA NA NA NA NA Manganese 35 33 43 43 44 44 063 086 099 094 14 Potassium 5 U 5 U 5 U 5 U 5 U 5 U NA NA NA NA NA Sodium 423 477 170 169 502 508 NA NA NA NA NA Zinc 002 U 002 U 0082 011 015 016 NA NA NA NA NA
Notes Only metals detected in untreated groundwater from MWIA are presented NA = Not Analyzed
U = undetected at specified detection limit JTI = Jar Test 1
c
c
sodium in the treated water was expected This is because sodium is a component of sodium
hydroxide Similarly the elevated concentrations of calcium observed in samples for
whichthe pH was adjusted wUh lime are due to the calcium component in lime Jar test 5
was conducted to assess the effect that precipitation and chemical oxidation had on the
removal of manganese and aluminum The results of this investigation are also presented in
Table 1-9 The results indicate that greater reductions of aluminum and manganese cannot
be achieved with aeration or by the addition of a chemical oxidant such as permanganate
A sample of the metal hydroxide sludge a residual that wiU be generated during the
groundwater treatment was analyzed for metals and PCBs This sample of sludge was
generated by treating contaminated groundwater with precipitation and filtration using the
optimum treatment parameters The metals results indicate that the sludge would not be
considered hazardous under RCRA using the toxicity characteristic leaching procedure
(TCLP) A TCLP was not performed on the sludge however based on 1) the concentration
of the metals in the sludge 2) assuming a 100 leachability and 3) incoiporating a 20-fold
dUution for a soUd matrix analyzed by TCLP this sludge would not be considered hazardous
under RCRA The PCB analysis of the sludge showed that Aroclor 1254 was the only
detected PCB at a concentration of 31 mgkg The TSCA limit for PCBs in waste is
50 mgkg indicating that this sludge would not be hazardous under TSCA The results for
this sludge represent a preliminary characterization and once the fuU scale treatment system
is on line the sludge analysis wiU need further testing to confirm these preliminary results
and to make a further assessment of the disposal options The analytical resuUs for the
sludge are presented in Table 1-10
1232 FUtration Testing A bench-scale filtration study was performed to determine the
optimum particle retention grade or mesh of filter media that could effectively remove the
suspended soUds in the precipitated groundwater The results of the analysis on the fUtrate
are presented in Table 1-11
n 22
c
c
TABLE 1-10 PRECIPITATED METAL HYDROXIDE SLUDGE RESULTS Results in mgkg
i||ipiiiii|iiiiiiiiiiiiiiiii^^iiiili|ii^^^ TCLP or TSCA L i n i l t s i Tfesi-iiiiiiiiiiiiiiisiiiiii^iiiiiiSvHiij^ in Solid Matrices ii iiiiS WM3KT2S
METALS
Aluminum Antimony Arsemc Barium Beryllium
Cadmium Calcium Chromium Cobalt Copper Iron Lead Magnesium Manganese Mercury Nickel Selenium Silver Sodium Thallium Vanadium Zinc
PCBs
Aroclor 1254
41100 231 195 346 5767
9120 338
25 114
39000 694 5260 2730
03313
04
8960 08
561446
31
U U
U
J
U U U R
U U J
J
NC NC 100
2000 NC 20
NC 100 NC NC NC 100 NC NC
4 NC 20
100 NC NC NC NC
50
Notes = TCLP Limits incorporated a 1 to 20 dilution factor for solid matrices Aroclor 1254 was the only PCB detected The remaining six Aroclors
were nondetect at a quantitation limit of 36 mgkg NC = No criteria exists for this compound U = Undetected at speciiied detection limit
L J = Estimated value due to validation criteria R = The result is rejected
23
c
c
TABLE 1-11 FILTRATION STUDY RESULTS
Media Rating Speed Suspended SoUds Turbidity
Raw 45 mgl 578 Course 10 um 200 mls5 sec lt5 mgl 16 NTU Medium 5 um 200 mls7 sec lt5 mgl 19 NTU Fine 1 um 200 mls23 sec lt5 mgl 18 NTU
Since there was virtuaUy no difference in the quaUty of effluents but substantial increase in
time to filter with the fine filter paper the medium 5 micron paper was chosen to prepare
sample for ftirther study
1233 Air Stripping Precipitated fUtered groundwater was aerated at 3 different air to
water ratios to evaluate the effectiveness of air stripping for the removal of volatUe organic
compounds in the groundwater Tables 1-12 and 1-13 shows the analytical results for
groundwater samples obtained from weUs MW-IA and ME-8 respectively No volatUe
organic compounds were detected in samples that were aerated at a 501 air to water ratio
Aeration of precipitated filtered groundwater obtained from weU ME-8 removed aU of the
vinyl chloride at an air to water ratio of 251
1234 Carbon Adsorption The effectiveness of carbon adsorption for the removal of
organic compounds in the groundwater was evaluated The analytical results are presented in
Table 1-14 At the lowest carbon dosage only 1 xg1 of cis-12-dichloroethene and
2 xg1 of trichloroethene remained No site-related volatUe organic compounds were detected
in samples which were treated with higher doses of carbon Toluene and
dibromochloromethane were detected in sample C-4 however these two compounds were
not detected in the raw groundwater and must therefore be a result of lab contamination
24 c
c TABLE 1-12 FULL SCALE TREATABILITY STUDY AIR STRIPPING RESULTS IN ugL FOR WELL MWIA
Methylene Chloride 10 u 4 U 5 U 5 U 4 U 4 U 2 U 4 U
cis-12-Dichloroethene 200 D 1 U 1 06 J 06 J 1 U 1 U 1 U
Chloroform 4 J 1 U 1 U 1 U 1 U 12 J 1 U 1 U
12-Dichloroethane 10 U 2 1 u 1 U 1 U 1 U 1 U 03 J
Carbon Tetrachloride 10 u 1 U 1 u 1 U 1 U 1 U 1 U 01 J
Trichloroethene 860 D 1 U 2 06 J 06 J 02 J 1 U 1 U
Toluene 10 U 020 J 1 U 1 U 1 U 007 J 25 1 U
Dibromochloromethane 10 U 1 U 1 U 1 U 1 U 1 U 14 1 U
Chlorobenzene 5 J 1 U 1 U 1 U 1 U 1 U 1 U 1 U
Ethylbenzene 10 U 1 U 1 U 1 U 1 U 1 U 1 U 1 U
Total Xylenes 1 J 1 U 1 U 1 U I U 1 U 1 U 1 U
Styrene 10 U 1 U 1 u 1 U 1 U 1 U 09 J 1 U
124-Trichloroben2ene 2400 D 4 1 u 1 U 1 U 1 U 1 U 1 U
123-Trichloroben2ene NA 5 1 u 1 U 1 U 1 U 1 U 1 U ^
SEMIVOLATILE ORG ANICS
Diethylphthalate 10 U 2 J 10 u 10 U 10 u Di-n-butylphthalate 10 U 1 J 10 u 10 U 10 u
Bis(2-ethylhexyl)phthal ate 10 U 10 U 10 u 4 J 2 J
Notes
Only volatile and semivolatile organics detected in any sample are included
No PCBs were detected in any effluent sample at a detection limit of 01 ugL influent was 36 J ugL
C-ID = Duplicate of C-1
U = Undetected at specified detection limit
J = Estimated value due to validation criteria
D = Duplicate
NA = Not Analyzed
= Value is for total 12-Dichlorocthene
i| f|iiiiiiiiiiiiiii^ti8ili| WSk
3 U 2 u 8 U
1 U 1 u 1 U
1 U 1 u 1 U
04 J 1 U 1 U
1 U 1 u 1 U
03 J 008 J 1 U
1 U 1 u 1 U
1 U 1 u 1 U
02 J 1 U 1 U
005 J 1 U 1 U
02 J OI J 1 u 1 U 1 U 1 u 1 U 1 U 1 u 1 U 1 U 1 u
10 U
10 u
2 J
27
c
The effectiveness of combining aeration and carbon adsorption to remove organic c contaminants was also investigated These results are also summarized in Table 1-15 No
organic compounds were detected m any of the samples generated during this investigation
124 Conclusions The results of the groundwater treatability study demonstrate that
treatment consisting of precipitation fUtration air stripping with vapor phase controls and
carbon adsorption appear able to meet cleanup levels estabUshed for the site Figure 1-3 is a
schematic representation of the proposed system The ROD stipulates that treated
groundwater wUl be reinjected to the aquifer onsite in this case MCLs are the cleanup
levels An altemative to be evaluated is discharging the treated groundwater to a surface
water body either Meadow Brook or the Neponset River In this case cleanup levels are
estabUshed as effluent discharge levels Effluent discharge levels are calculated by
multiplying the ambient water quaUty criteria (AWQC) values for each compound by a
dUution factor The dUution factor for the Neponset River is based on a 100-gpm treatment
discharge rate and a Neponset River 7010 of 2020 gpm The dUution factor for Meadow
Brook is 1 since the treatment discharge rate is greater than the flow of the brook therefore
effluent discharge levels for Meadow Brook are set at AWQC
Tables 1-16 through 1-19 compare effluent discharge levels for both the Neponset River and
Meadow Brook to carbon adsorption effluent from the groundwater treatability study
Table 1-16 summarizes the concentration of metals in untreated groundwater the metals
concentrations remaining foUowing precipitation and filtration the metals concentration
foUowing aeration and carbon adsorption the metals concentrations foUowing caition
adsorption only the MCLs and the effluent discharge levels based on discharge to the
Neponset River The only metal effluent concentration which exceeds the MCLs is
aluminum the MCL for aluminum however is a secondary MCL which is nonenforceable
No metals concentrations in the effluent exceed any of the effluent discharge levels
n 28
c TABLE 1-15 FULL-SCALE TREATABILITY STUDY AERATION AND CARBON ADSORPTION RESULTS Results in ugL
iiiiii|Mpt-HiiDiiii-iiiiii^iiiiiiiiiiii iii bullbullbull^(6-^1 iiiiii-iiiiiiiii iiiiiiiiii^g-2iiiiiiiiiii|i
l | | | ibyNigtii i i i i | i i i i i i i | ivi
VOLATILE ORGANICS
Mediylene Chloride 6 U 4 U Carbon Tetrachloride 1 U 01 J Toluene 02 J 1 u Total Xylenes 1 U 1 u Acetone 5 U 5 U 2-Butanone 5 U 5 U 2-Hexanone 5 U 5 U 4-Methy 1-2-pentanone 5 U 5 U Carbon Disulfide 1 U 1 U
c Notes Only volatile organics detected in any sample are included U = undetected at specified detection limit J = value is estimated due to validation criteria
iiiiiA61iiiiiiiiiiiii
3 U 1 U
02 J 01 J
5 U 5 J 5 U
5 U 1 U
i|AGii[ijiiifii
3 U U
01 J 1 U 5 U 5 U 5 U 5 U 1 U
i^^^iiiiiic|ii[|ili
10
1 u 1 u 1 u 5 U 5 J
5 U 5 U 1 U
29
c
o o o
o
Gas Phase GAC or Catalytic Oxidation
To ^ Ambient
Air
To Groundwater Recharge or
Raw Treated ) Neponset River Groundwater Groundwater Influent Holding Tank J
Solids for Offsite Disposal
(NOTE Air stripper not necessary if discharge to Neponset)
FIGURE 1-3 PROPOSED GROUNDWATER TREATMENT SYSTEM SCHEMATIC
2483JP
o n o TABLE 1-16 COMPARISON OF INORGANIC FULL-SCALE TREATABILITY STUDY RESULTS TO MCLS AND DISCHARGE LEVELS
[i^i^^^^ iiiiiiijiMf|iilaquo4 Precipitation Aeration and Carbon AdsorpUoi iiiiiiiiiiiiiiiiiiiiiiritliiiiin
iiiii iiSiiii|iiiiiiiiiiiiiiiii and Filtration M^ Iiiiiiiiiiiiii iiiiiiiii|iiii|i|iiiiiiiiiii liiiijlliiiii
iiiiiiiiiiiiiiiiiiiii iiiiiiiiiiiiii i i i i i i i|ii||iiiiiiiiiiiiiiiiiiiiiiiii iiiiiiiiiiiiiiiilii Giliii iiiii ii iiiii i iiiic iD|i laquoi|iiiiiiii iiiiitiiiiciiiiiiiiiiiii
Discharge levels calculated by multiplying AWQC by a dilution factor based on a 100 gpm treatment discharge rate and a Neponset River 7Q10 of 2020 gpm
U = Undetected at specified detection limit
J = Estimated value due to validation criteria
NC = No criteria exists for the compound
P = Proposed MCL
S = Secondary MCL
n n o TABLE 1-17 COMPARISON OF INORGANIC FULL-SCALE TREATABILITY STUDY RESULTS TO MCLS AND DISCHARGE LEVELS
DISCHARGE TO MEADOW BROOK
[isjiiiiiiiiiiiiiiii-ii |iiiiiiiiiiiiiiiiiiiiiiiiiiiiiiiiiiiiiiiiiiiiiii iiiiiiiiiiiiiiiiiiiiiiiiiiiiii iiiiiiiiiiiiiiiiiiiiiiii- iiiiiiiiiiiiiiiiiiiiiiiiiiiiiiiiii ^iiiiiiiiiiiiiiiiiiiiiiiiiiiiiiiiii bull immMmii^^ F- piiiipiiiiil i i i i i i i i i i i AcraUon and Caibon AdsorpUon iii iii iiii i i i i l l l i i i i i i ^ ^ i p t ^ sectffllM^ ^ ^
Ajumin iw u i 358 bull490 z ii 240 i--lJi iiiiiiiiiiiJ^3iiitJi i i iii i3 lliiiiiiiiii iiii|ii]^(Ciiiiiiiiiii-iii-iiiiiiii5iiiii-iiiiiiiiNC^ Antimony 2i ij NA 44 U i44 U 44 U 44 U 44 U 10 P 88 30 8600
Ariseiaic- iiiiiiiiiiiiiiiiiiiiii8iiiiiiiiiiiiiii iiiiiiiiii-iis- - iiiiiiiiii- 1 u 71 J i-iiiiiy3|ili-uj - i i i 9 l i j i iii--5Qiiiiiiiiiiiiii iiiiii NC- NC - iL | Barium 247 32 106 U 65 U 597 49 U 131 IJ 2006 NC NC NC
Blaquoay|Hiiraquosi-- bullbullbull--bull i-iiiii-iiiiii3iiiiiiliiiiiiii -iiiiiiiiiiiNAi-iiiiiii I u -- 1 U iiiiiiiiiliilliiiiii-ii|iyi- iiiii iiiiiiiiiiiiiiiiii ii|i|40 - 53-bullbull13|shyCadmium ( S i u bull bull bull bull bull bull bull bull bull N A 4 UJ 4 UJ bullr^^ 4UJ 4UJ 5 682 038 170 Cai lc turn i bull- iiiiii3PiOCfiii iiiiiiiiiiii iiiiiiiiii^iiiiiiiiiiiiii 9650 i 8360 iiii7886iiiiiiiiiiiiiiiiiiiiiiii^iiiiiiii-ii6^^ iiiiii5isNltiiiiiiiiiiiiiiiiiii iiiiiiNC NGi NC Chromium 315 NA 8 J 7 UJ 7 u j 7 uj 7 iirj 160 16 11 3206
CO i-iii-iiii 33iitiii-iiiiii ii-iiiii-i-Jfiiiiii--iiii - bull bull 4 U Z 4 U- iiiiiiiiiiiiiilii-uiiiiiiiiiiiiiiiiiiiiiii4iitjiii-iiiiiiiiiii4 iiiiii-ii Nltiiiiiiiiiiiiiiiiiiiiii i l i iNc-- -NCi^-NCi
P ^ i bull bull Copper 6 4 i NA 128 U 179 U bull64Uj 9 U --256--u-- 1300 48 36 NC
Jtaa- iiiiiiiiiiii ltJOlt iiiiiiiiiii isiiiiiiiJQiii-i - z 6AS U ii232U-^^ bulliiiiiiiiiiiiiiiiiiiiuiiiiiiiiiiiiiiiiiiiiiiiiiiiiiiiiiii2 ipit|iiiiii iiiiii3pQiiiiJiiiilii liiiNC- v 1000- bull- NCi head 253 5^U^ 35 U 46 U 21 U 12 U J 2^4 u 14 054 NCis |Magnlaquoaiuiai iiiiiiiiiiilaquo)6iiiiiiiiiiiii iiiiiiiiiiii|lS)6iiiiiiiiiiiiii 3700 7060i V^ bulliiiMiiiiiiiiiiiiiiiiiii3Jpiiiiiii7^0iiiii^^^ i iiigtKSiiiiiiiiiiiiiiii bulliii I N C bull N C Ncjii Manganese 4810 bull356 62 U 18 UJ 23 U 35 U 53 U 56 S NC NC 106
Wtercuryi iiiiiiiiiiiiiiiiiiiiiiiiyiiiMiiiiiii iiiiiiiiiiiiiiiiiNAiiiiiii i P-2 U bullbull 0 2 U-- iiiiiiiiiiiiiiiiOi|iiittiiiiiii|iiiii 6iiiiit|iiiiiiiiiiiiiQ|iit|iiiiii iiiii|i|iiiiiiiiiii iiii|iii24- -- oon --0i|i Nickel 281 isrA 181 UJ 244 UJ 269 uil 17 U 356 il 166 P 643 33 3800
Potraquoslaquolum -iiiiiiiiiii4liS0iiiiiiiiii iiiiiiiiiiiii PPQiiiiU i 2200 U i ii 2620 XT | |i |owiiyiiiiii | |(^iiiiiiiiiii^ iiiiiiiiiiiiiiiW|iiiiiiiiiiiiii iii iii|ip--i NC- bullbullbull-KCii Selenium 20 U NA 32 U 13 UJ 1 6 u 1 UJ i u 5 6 266 50 6800 Sflycri i-i- iiiiiiiiiiiiiiiiiiiiiiiiiiiiiiiiiiiiiii iiiiiiiiiiiiiiiiiii iiii- i-4U bull -^M- U iii bull i i i i | | i | | i i i i |-i i | i | l | i i i i | i i i i iiiii-i ^66iiiiiiiiiiiiiii i|iP37 -0i2iNi Sodium 1 2 3 6 6 6 9 5 5 6 6 99000 lOlOOO 99866 106066 74566 NC NC NC NC
I m iiiiiiiiiiiiiiiiiiiiii||jriiiiii||iii|i|iii|| | ii46Q ^40- -bull-3iThaUJiiiitt - iiiiiiiiiiiiiiiiiiiiiiiiiiliiiiiiiiii iiiiiiiiiiiiiiNAii- I UJ ^ iiiiiiiiiiiiiiiiii Vanadium 439 NA 5 U 83 UJ 5 U 5 IJ 0 IJJ NC NC NC NC
Ziiicii^ iiiiiiii-iiiii- 488iiiiiiiiiiiiii iiiiiiiiiiii6iiu 151 U 67 UJ iiiii iiiiiiiiiiiiiiiil52iU- iiiiiiiii2 liiiiiiiiiii iiJiOQ()ii- Siiiiiiii iiiiiiiiii|6 bull bull33 - N C i
Notes
Discharge levels are AWQC (10-5 risk) since the treatment discharge rate of 100 gpm is higher than the flowrate of Meadow Brook
U = Undetected at specified detection limit
J = Estimated value due to validation criteria
NC = No criteria eus ts for the compound
P = Proposed MCL
S = Secondary MCL
o n o TABLE 1-18 COMPARISON OF ORGANIC FULL-SCALE TREATABILITY STUDY RESULTS TO MCLS AND DISCHARGE LEVELS - DISCHARGE TO THE NEPONSET RIVER
||x|o | bull iiii||i||il|A iiiiii iiiiiiiiliiiiiiiiiiili ii5iiPo|laquo|o|i iii||l|i|i||ii||y E^ly1 C DoteslOO ii i^i|raquoiiipltii=(iiiii|iii iiii i i w i M w iiiiiiilliHiJLYiiii iiiiWiiiiii iiiiiiiiiiiiii ii iiiiiiiiiiiiiiiiiiii iiiiii iiii iiiiiiiiiii iiiiiiiiiiiiiiiiii iiiiiiiiiililiiiiiiiiiliiiiii bulliiiiii lagaiiiiiiiii iiiiiiiiiiiiiiiiiiiiiiiiiiiiiiiii (ugL) iiiiiiii^iiiiiiiiii iiiiiiiiiiiiipiiiii iiUiiiiiii^ WmnKiiiiiii i(iiiiiiii i iii iiiiiiiiiiMiiiiii VOLATILE ORGANICS
112-Trichlorocthane 5 J 25 U 1 u 1 u 1 U 1 u 1 u 5 NC NC 8904
1122-TetrachIororthane 16 J 25 U 1 u I u I U 1 u 1 u NC NC 50880 2332
Chloroform 4 J 25 U 1 u 1 u 1 U I u 1 u NC 612680 26288 3328
Vinyl Chloride 10 U 50 U I u 1 u 1 u 1 u 1 u 2 NC NC 111300
11-DichIoroethene 10 U 25 U 1 u 1 u 1 u I u 1 u 7 245920 0 403
12-Dichloroethene (total) 200 D 97 1 u 1 u 1 u 1 u 1 70 245920 NC 29680000
Trichloroethene 860 D 430 1 u I u 1 u 1 u 2 5 954000 464280 19504
Tetrachloroethene 5 J 25 U 1 u I u 1 u 1 u 1 u 5 111936 17808 1876
Xylenes (total) 1 J 25 U 1 u 1 u 01 J 1 u I u lOOOO NC NC NC
Chlorobenzene 5 J 25 U 1 u 1 u 1 u 1 u I U NC NC NC NC
SEMIVOLATILE ORGANICS
Pentachlorophenol 25 U ND 25 U 25 U 25 U 25 U 25 U I 424 276 NC
Chlorobenzenes(total) 5300 1060 NC
13-Dichlorobenzene 3 J 2 10 U 10 U 10 U 10 U 10 U 600 NC NC 55120
14-Dichlorobenzene 17 9 10 U 10 U 10 U 10 U 10 U 75 NC NC 55120
12-Dichlorobciizcne 7 J 5 10 U 10 U 10 U 10 U 10 U 600 NC NC 360400
124-Trichlorobenzene 2400 D 50 10 u 10 u 10 U 10 u 10 U 9 5300 1060 NC
PESTICIDESPCBS
Arocloi-1254 36 J 32 NA 01 u NA OI u NA 05 42 03 01
Heptachlor 0074 J NA NA NA NA NA NA 04 11 01 01
Aldrin 017 J NA NA NA NA NA NA NC 64 NC 002
Heptachlor Epoxide 0045 J NA NA NA NA NA NA 02 NC NC NC
gamma-Chlordane 0056 J NA NA NA NA NA NA 2 51 OI 01
Notes
Discharge levels calculated by multiplying AWQC (10-S risk) by a dilution factor based on a 100 gpm treatment discharge rate and a Neponset River 7Q10 of 2020 gpm
Compounds presented are only those detected in the untreated groundwater sample
NA = Not analyzed J = Estimated value due to validation criteria
NC = No criteria exists for the compound D = The reported value is from the diluted analysis
U = Undetected at specified detection limit P = Proposed MCL
o n o TABLE 1-19 COMPARISON OF ORGANIC FULL-SCALE TREATABILITY STUDY RESULTS TO MCLS AND DISCHARGE LEVELS - DISCHARGE TO MEADOW BROOK
i 1 liiiisisi i ii iii iii|i|i i l i 11 i |ii^^ i i i i i i i i iiiiiiiiiiiiiiiiii iiiiiiiiiiiiieiciidiiiiii iiiiiiiiiiiiii iiiiiliiiiiii^^iiiiii iiiiiiiiiiiiiiiiiiii iiliiiii i iiiiipiiiliiiiiiiliiii iiiiiiiiiiiiiiiiii iiiii|iii|i|i-iiiiii iiAVQiii|iiiii i ii-iiiiiiigt-iiii ^^
iiiiiiiiiiiiiiii iiiiiiiiiiiiiiiiiiiiiiiiiiiiii iiiiiiiiiiiiiiiiiiiiii I i i i i i i i i||i|i|||iiiiiiiiiiiiiiii|iiii iii-|iiilaquo|i3[i|ii |||^|ii^|i|^|iii i (3 i i ^ ^ l i i illjliii^jiii^ iieip|i(iii|i iiiiiiiiiiiiiiiiiiii i^|iii|(iiiijiii|)|r^ iiii-iiliiiiiiiiiiiii ||i |illlli|i i|li|i|ii iiiiiiiiiiiiiiiiii iiiiiiiiiii|tiiiiiiiiiiiiiiiiiii iiiiiiiiiiiifiiiiiiiiii iiiiiiiiiiiiiiiiilaquoiiiiiii iiiiiiiiiiilliiiiiiiiiiiiiiii i (laquoy^ iiiiiiiiiiiii(Wiiiiiiiii iiiiiiiii i lK^ iiiiiiiiliiiiiiiiiiiiiiiii (ugl)iii iiMiiiiiii VOLATILE ORGANICS
112-Trichloroethane 5 J 25 U 1 u 1 u 1 u 1 u 1 u 5 NC NC 420
1122-Tetrachloroethane 16 J 25 U 1 u 1 u 1 u 1 u 1 u NC NC 2400 110
Chloroform 4 J 25 U 1 u 1 u 1 u I u 1 u NC 28900 1240 157
Vinyl Chloride 10 u 50 U 1 u 1 u 1 u 1 u I u 2 NC NC 5250
11-Dichloroethene 10 u 25 U 1 u 1 u 1 u I u 1 u 7 11600 NC 19
12-Dichlorocthene (total) 200 D 97 1 u I u 1 u 1 u 1 70 11600 NC 1400000
Trichloroethene 860 D 430 1 u 1 u 1 u I u 2 5 45000 21900 920
Tetrachloroethene 5 J 25 U 1 u 1 u 1 u 1 u 1 U 5 5280 840 89
Xylenes (total) 1 J 25 U 1 u 1 u 01 J I u I U 10000 NC NC NC
Chlorobenzene 5 J 25 U 1 u 1 u 1 u 1 u I u NC NC NC NC
SEMIVOLATILE ORGANICS
Pentachlorophenol 25 U ND 25 U 25 U 25 U 25 U 25 U 1 20 13 NC
Chlorobenzenes(total) 250 50 NC
13-Dichlorobcnzene 3 J 2 10 U 10 U 10 u 10 U 10 U 600 NC NC 2600
14-Dichlorobenzene 17 9 10 U 10 U 10 u 10 U 10 U 75 NC NC 2600
12-Dichlorobenzene 7 J 5 10 U 10 U 10 u 10 U 10 U 600 NC NC 17000
124-Trichlorobenzene 2400 D 50 10 u 10 u 10 u 10 u 10 U 9 250 50 NC
PESTICIDESPCBS
Aroclor-1254 36 J 32 01 u 01 u OI u OI u NA 05 20 0014 00045
Heptachlor 0074 J NA NA NA NA NA NA 04 052 00038 00029
Aldrin 017 J NA NA NA NA NA NA NC 3 NC 000079
Heptachlor Epoxide 0045 J NA NA NA NA NA NA 02 NC NC NC
gamma-Chlordane | 0056 J NA NA NA NA NA NA 2 24 00043 00048
Notes
Discharge levels are AWQC (10-5 risk) since the treatment discharge rate of 100 gpm is higher than the flowrate of Meadow Brook
Compounds presented are only those detected in the untreated groundwater sample
NA = Not analyzed J = Estimated value due to validation criteria
NC = No criteria exists for the compound D = The reported value is from the diluted analysis
U = Undetected at specified detection limit P = Proposed MCL
Table 1-17 shows a comparison of effluent to effluent discharge levels based on discharge to c Meadow Brook assuming a dilution factor on one If the treated groundwater was discharged
to Meadow Brook effluent discharge levels for arsenic would be exceeded Since arsenic is
a difficult compound to remove in a groundwater treatment plant it is concluded that
Meadow Brook may not be usable as a discharge point
Table 1-18 presents concentrations of organic contaminants in untreated groundwater from
MW-IA the precipitated and filtered effluent the effluent following both aeration and
carbon and the effluent from carbon adsorption only These values are compared to MCLs
and effluent discharge levels Only one carbon dose for the carbon only study the lowest
dose of 05 g carbon1000 ml groundwater is shown as a conservative example In both
cases using aeration and carbon and carbon alone organic contaminants were removed to
below MCLs and to below discharge levels Therefore aeration at an air-to-water ratio of
251 and a carbon dose of 05 g carbon1000 ml groundwater effectively removed volatile
organics semivolatile organics and PCBs from the groundwater
c It is expected that a maximum air-to-water ratio at 251 will be effective for an air stripper
onsite because full-scale air strippers are many times more efficient than the bench scale
models This is due to the greater surface area and turbulence found in the stripper The
off-gas from the air stripper will have to be treated to meet applicable standards either by a
catalytic oxidation unit or a vapor phase carbon adsorption system
Since no vinyl chloride was present in MW-IA and vinyl chloride is a difficult compound to
remove with carbon adsorption tests were performed with groundwater from ME-8 which
contained 210 xg1 vinyl chloride These results were presented in Table 1-13 which shows
that air stripping at an air-to-water ratio of 251 is effective in removing vinyl chloride In
order to reach the MCL of 2 figl for vinyl chloride an air stripper is required Carbon
adsorption alone would not remove vinyl chloride down to the MCL If the treated
groundwater is discharged to the Neponset River instead of being reinjected an air stripper
to remove vinyl chloride is not necessary since the discharge level is 111300 xg1
35 c
Table 1-19 shows a comparison between the organic concentrations in treatability study c effluents and effluent discharge levels based on discharge to Meadow Brook All volatile and
semivolatile organic compounds are removed to the effluent discharge levels It is
impossible to determine if PCBs were effectively removed since the most stringent discharge
level is 0014 xgL and the detection limit in the study is 01 xgL Discharge to Meadow
Brook may not be feasible due to 1) the treatability study cannot prove that PCBs are
removed to effluent discharge levels and 2) arsenic concentrations in the treated effluent
were higher than effluent discharge levels (based on a dilution factor of one)
The preliminary results of the sludge analysis indicate that the sludge is nonhazardous under
RCRA and TSCA Once the fiill scale groundwater treatment system is on line samples of
the sludge should be reanalyzed to confirm the preliminary results and to further assess the
disposal options
In summary the results of the treatability study indicate that groimdwater from the Norwood
PCB site can be treated effectively to allow discharge to either the Neponset River or r gtlaquo^ reinjection back into the aquifer If treated groundwater is reinjected the treatment plant
must include an air stripper to remove vinyl chloride If treated groundwater is discharged
to the Neponset River an air stripper is not necessary to meet discharge levels however the
use of Best Available Technology (BAT) may be required which would necessitate the
inclusion of an air stripper A cost comparison between an air stripper combined with
liquid-phase carbon versus liquid-phase carbon alone was performed and reported in the
Modeling Report The conclusion was there is not a significant difference in cost the
present worth assuming a discount factor of 8 and a 16-year period of perfonnance was
135 vs 102 million dollars (see Volume 2 Section 3) These costs will be evaluated
further during the design phase of the project The efficiracy at the full scale plant can be
optimized to ensure that at no time will the effluent from the plant exceed any applicable
groundwater or surface water standard
36 C
Section Two
c
c
20 ROCKS
21 Introduction and Objectives
There are several sources of rocks potentially contaminated with PCBs present on the Grant
Gear property portion of the Norwood PCB site Three different sources of rocks were
collected for analysis from the Grant Gear property The three rock sources included
overburden rocks from a trench west of the Grant Gear facility and below the interim
remedial cap crushed stone from the interim remedial cap west of the Grant Gear facility
and pea stone from the upper and lower roofs of the Grant Gear facility Throughout this
section rocks collected from on top of the interim remedial cap will be referred to as cap
rocks and overburden rocks wUl be referred to as trench rocks The rock collected from the
roof were analyzed under Work Plan 1 and are discussed in the Building Investigation
Report
The objective of this portion of the predesign work was threefold
bull To determine the PCB contamination if any on the different sources of rocks
bull To assess the feasibility of dry tumbling as a remedial altemative for the rocks
bull To assess the feasibility of water washing as a remedial altemative for the rocks
The dry tumblingwater washing was conducted on rocks that were reported to be too large
to be remediated with overburden soils by the solvent extraction technique
22 Description of Work
Samples of the three sources of rocks were collected by Metcalf amp Eddy personnel on
January 8-10 1992 Refer to Figure 1-1 for the locations of the trench and the cap rock
37 c
sampling points The samples were delivered to ENSECO laboratory in Cambridge
c Massachusetts and stored in a refrigerator at 4degC prior to sample preparation and analysis
Metcalf amp Eddy performed the sample preparation portion of the PCB analysis Rock
samples were weighed and gently placed in precleaned two liter glass beakers A quality
control surrogate compound was then added to each sample or method blank for subsequent
percent recovery determination The rocks were then immersed in extraction solvent
consisting of 30 percent acetone and 70 percent hexane by volume iEach sample and blank
was heated to 50degC and intermittently swirled by hand for a thirty minute extraction time
The extracts were then dried using sodium sulfate concentrated to 10 milliliters final volume
and submitted to ENSECO for PCB analysis using EPA SW846 Method 8080
The trench rocks were divided into three size categories with average diameters of one inch
two inches and three inches The rock size is an important consideration for the solvent
extraction remediation technique
^s^^ The three trench rock sizes and six cap rock samples were analyzed initially to determine the
extent of PCB contamination As outlined in the Quality Assurance Project Plan a second
portion of the cap rock sample with the highest initial PCB concentration was subjected to
water washing remediation and analyzed for PCBs Separate portions of the trench rock
samples were subjected to dry tumbling for ten and thirty minute intervals and water washing
for ten and thirty minute intervals The remediated rocks were then analyzed for PCBs
The dry tumbling and water washing were performed using an electronic rotary device The
rock samples were placed in clean two liter plastic sampling containers with screw cap
closures Laboratory distilled deionized water was poured into the water wash test
containers while the dry tumble samples had only the rocks enclosed
38 c
c 23 RESULTS
The one-inch average diameter trench rocks were initially contaminated with 1800 mgkg of
Aroclor 1254 Because the one-inch trench rocks were above the 10 mgkg cleanup standard
sample portions of the rocks were processed step by step through each of the four
remediations Although an eighty five percent reduction in PCB contamination was achieved
between the initial and final remediation samples the final concentration of 270 mgkg is still
well above the cleanup standard The results however showed a trend with the highest
concentration of PCBs detected on the initial sample lower PCB concentrations with the
ten-minute remediation and the lowest PCB concentrations achieved with the longest
thirty-minute remediation as expected The results for the one-inch trench rocks are
presented in Table 2-1
The two-inch average diameter rocks showed results similar to those of the one inch size
The initial sample had a concentration of 2500 mgkg of Aroclor 1254 The best
remediation result obtained was 450 mgkg for the ten-minute water wash sample A thirty c minute water wash sample for the two-inch trench rocks was not conducted when it became
apparent that a 10 mgkg cleanup level could not be obtained Because the 10 mgkg cleanup
level was not achievable the thirty minute water washing of two-inch rocks was not
conducted to minimize the level of effort and analytical costs The PCB result for the
thirty-minute dry screened sample 1900 mgkg Aroclor 1254 was higher than expected
This result was counter to the trend that was expected and observed with the one-inch rocks
and it demonstrates the non-homogenous nature of the rock samples This trend breaking
analytical result caused by the heterogenous or nonuniform nature of the rock sample matrix
was not repeated because the cleanup level could not be achieved The results for the
two-inch trench rock samples are presented in Table 2-1
The three-inch average diameter trench rocks yielded markedly different analytical results
The initial sample prepared with minimal on- site screening had a PCB concentration of
75 mgkg below the cleanup standard of 10 mgkg Although the initial result was below
39 c
TABLE 2-1 TRENCH ROCK WASHING RESULTS
Trench Rocks 1 inch Average Diameter
PCB Concentration
Sample mgKg
Initial sample 1800
Ten minute dry screened 620
Ten minute water wash 880
Thirty minute dry screened 290
Thirty minute water wash 270
Trench Rocks 2 inch Average Diameter
PCB Concentration
Sample mgKg
Initial sample 2500
Ten minute dry screened 490
Ten minute water wash 450
Thirty minute dry screened 1900
Trench Rocks 3 inch Average Diameter
PCB Concentration Sample mgKg
Initial sample 750
Ten min dry screened 210
Ten min water wash 025 UJ
Aroclor 1254 was the only PCB detected UJ - The sample was nondetect for PCBs to the estimated detection limit
of 025 mgKg
40
the cleanup standard it was close enough to warrant the first ten minute dry tumble c remediation step The first remediation step with a PCB concentration of 21 mgkg
confirmed that the three-inch trench rocks are less contaminated than their smaller
counterparts The three-inch ten-minute water washed sample was not submitted for fiill
quality control PCB analysis in an effort to minimize analytical costs The ten-minute water
washed sample result is from a partial quality control PCB screening analysis and is reported
as estimated Because of the lag time in tumaround of analytical results this sample had
been prepared extracted and screened and the information was available therefore it is
presented herein The results for the three inch average diameter rocks are presented in
Table 2-1
Six samples of cap rocks were collected and analyzed for PCBs AU of the results were less
than 02 mgkg or 200 xgkg For these cap rock samples an action level of 50 xgkg was
established in the Quality Assurance Project Plan The 50 xgkg value is an action level
established by EPA for this study only and is not a cleanup level identified in the ROD The
action if the results exceeded 50 igkg was to water wash the most highly PCB contaminated c sample Water washing was performed on cap rock sample number two The initial result
for this sample was 150 xgkg while the ten minute water washed sample yielded 24 igkg
Aroclor 1254 The cap rock results showed fairly consistent PCB concentrations in the range
of 50 to 150 igkg Aroclor 1254 The results are presented in Table 2-2
24 CONCLUSIONS
The cap rock samples were all determined to have PCB concentrations approximately one
hundred times less than the cleanup level of 10 mgkg Water washing conducted on the
most contaminated cap rock sample removed approximately eighty five percent of the PCBs
initially present These cap rock samples contained some fine soil like material which was
perhaps windblown carried on tmck tires or created by friction This material contributed
to the measured PCB concentrations for the cap rock samples
41 c
c TABLE 2-2 INTERIM REMEDIAL CAP ROCKS ANALYTICAL RESULTS
LOCAiSifi iiiiiiiiiiiiiii--iiiiiiiiiiiiiiiiiiiiidiiiiiiliiiiiiiii^ 10 minute Water Wash iiiii|ijii|iiii|iii^ PCB Concentration (ligKg)
1 120 NA
2 150 24
3 110 NA
4 31 U NA
5 86 NA
6 71 NA
Notes Aroclor 1254 was the only PCB detected U - Sample was nondetect for PCBs to the reported
detection limit - The highest initial PCB concentration cap rock sample was
subjected to a ten minute water wash remediation
42
C
The results of the rock tumbling and water washing demonstrate that this form of remediation r will not achieve the cleanup level of 10 mgkg for the one-inch and two-inch average
diameter overburden rocks The three inch rocks are below the cleanup level without
remediation It should be noted that these overburden rock samples were coUected from one
of the most highly contaminated areas at the site based on the remedial investigation results
These samples therefore represent worst case conditions
The dry tumbling remediation steps did not remove aU of the adhered soU particles as
anticipated This adhered highly PCB contaminated soU contributed to the measured rock
surface PCB concentration because the PCBs were extracted from the soU as weU as the rock
surface during sample preparation
The water wash remediation was effective in removing aU of the adhered soU The results
indicate that the rock surface and near surfaces have been contaminated with PCBs which
cannot be removed by water washing but are extractable with acetonehexane
c During the trench rock coUection ample one-inch and two-inch average diameter rocks were
avaUable at shaUow depths The trench had to be dug deeper to obtain the three inch size
rocks Because of the relative immobiUty of PCBs in soU the PCB concentration decreases
with depth as reported in the remedial investigation This decrease in PCB concentration
with depth is part of the explanation as to why the three inch rocks showed less
contamination than the smaUer sizes Also a factor is the surface area to mass ratio As the
mass of the rock increases the surface area to mass ratio decreases Since the PCBs are on
the surface or near surface of the rocks as the relative surface area decreases with size or
mass the reported concentration wiU decrease correspondingly
During the trench excavation and overburden rock coUection a two- to three-inch lens of
dark oUy appearing materials was observed This material was analyzed with a PCB field
screening kit and found to contain in excess of 10000 mgkg PCBs Some of the one and
two-inch diameter rocks sampled appeared dark in color Because it was not known whether
43 c
c
the dark rocks were naturaUy colored or from the tarry lens and to keep the study unbiased
these dark rocks were sampled randomly with the remaining rocks The dark appearing
rocks were estimated to comprise approximately five percent of the one and two-inch rock
sizes Inclusion of highly contaminated rocks in the samples would boost the reported PCB
concentrations
Altemative remedial measures other than rock tumbUng and water washing include detergent
and water washing organic solvent washing or steam cleaning Although preUminary
indications from the solvent extraction vendors are that only up to one inch size rocks can be
handled the possibiUty of designing a treatment system to handle larger rocks wiU be
explored during the design phase of this project If the size of the rocks precludes them
from remediation by solvent extraction along with contaminated soUds a rock cmsher wiU be
employed to reduce the contaminated rocks to a size that can be handled Although other
altematives for rock remediation might work solvent extraction with contaminated soUs or
rock cmshing foUowed by solvent extraction appear to be the easiest most cost effective
means to achieve the cleanup standards Whichever remedial altemative is selected rock
washing would only be necessary on rocks with average diameters between one and two
inches coUected from soU highly contaminated with PCBs A very rough estimate of rocks
onsite between one- and two-inch diameters is approximately 5000 tons No remediation of
the rocks is necessary if the solvent extraction technology can handle two-inch size rocks
44 c
-
-
-
- - -
-
-
-
-
-
o n o TABLE 1-3 COMPARISON OF METAL CONTAMINATION IN GROUNDWATER WFTH EFFLUENT DISCHARGE LEVELS - DISCHARGE TO THE NEPONSET RIVER
bull bull bull bull bull bull bull bull bull bull bull bull - bull bull bull bull gt gt bull gt bull bull bull bull bull - bull bulliii|vO|| iS iggJMLnei i iaD s-UNFILTEREDgssHis M-B33nsRmmMMM D A I L Y iiiiiiiiiiiiiAVGiiiiii |i mmmmMmmm Xy lira^li P H A S E I WtiiMM liwiAiiiii iiiiimiii iii-pHiwiiliiiii WampMM P H A S E I ilii iiwgiiiiiiiiiiiiiiiii|iiiii iiiiiiiiiiiiiiiiiiiili|i| iiii iiiiii iiiiiiiiiiiiiiiiiiii M A X I M U M iiiiipifriiii^iiii iiiiiiiiiiiiifiiii iiiiiiiiiiiiiiiii
555^gt5^5V555^^^^ i i i ilaquoiij S U R F A C E m m m Wtm^itM B E D R O C K bull bull gt f t bullbullbull B E D R O C K iiiFRiiliiiiiiiiiiiii iiiiiiijsiiiiiriiiiiiiiiiiiiiiii iiii|iiiiiiliiiiiiii E F F L U E N T E F F L U E N T E F F L U E N T iiiiiiiiiiiiiiiiii wmmm |||ii||li| |i IliAiiiiil WliampiMM liiiiltiilii^isiiii liiiiifctAXliii iiiAiiiiiiiiiiiiiiiii i^i^iibhreiiiiiiiiiiliiiiiiii liiiiiii iiHiiiiiiiiiiiiii- D I S C H A R O E D I S C H A R O E D I S C H A R O E iiiii imm^mi mmmn WmMm WBrnB
PARAlt4ETER W iMmm iiiiiiiii iiitjiiiii Wi^MMM iiii iiiiiiiiilii iiiaraquoliiii W-imMMi iiiiiiaiiiii mMmmmm iCSiiMAiiiiii O O N S U M P iiiiiiiVEitiiii liiiiisyifeEiiiiiiiii iiiiiiiiiitiiiiL iiii cii^i iiiiiifl|5iili iiiiiiili (UOW iiiiiiii (oon) iiiiult3piili (UOL) lzMcii0m (UGL) iipiiiiiiiiiiiiiiiiiiiiii ii|^(Siliiiiiiiiii|iiiiii (UOL) (2) (UOL) (6)C7) (IKJL) (6)C7) (UOn) (6) C7) i^iipi
M E T A L S
A h m i n u m 154000 390000 119 352 12500 43900 74 77 NA NA NA NC NC NC
fMgtimi-^ztm zmisectmi iMiMM wmmi M^iiiiampii iiJiiM 189 iiiiiiiiiisiiiiiilaquo3iii iiiiiiiiiiiiiiiiiiiiiifii iiiiiiiiiiiliiiii^-iiiii isiiiiiiiiiiisiiiii CJiiiiiijiii iiiiiiiiiiiiiStCiiiiiii iiiiiiiiiiiiiiiiiiiiiiiiiiiiM bullsiiiii iiiiiiili5 iiiiiiiiiiiiiii|iiiiiiiiiigtireii iiiiiiii-shy bull bull bull bull bull bull bull bull bull iiiiiiliiiiiiWiii bull bull laquo raquo - iiiiiiiiiililiiiiiiiilifii iiiiiiiiiiii iii|iiiiiiiiiiiiiiii l i i i i i i i i i i^ i l l l i s i i iiiiii i-iiiiiiiSiiiiiiisiiii iiiiiiiiiiiiiiiiii|fltii- 405000 iiiiiiiiiiilliiiiiiiiwii iiiiAiiishymBmmm imampmm WmMM Wimm iiiiillili iiiiiiiiliiiiiii
Lead 43 i t3 21 168 l i 37 30 168 14 (3) 054 p) NC 5670 219 NC
iiititlj^iusibiii^j iilllJii^ -M-W^M iiiiiiii^^i^ ii-|7laquo- L5W iiiiiiiiiiiiiilliiifii iiiiiiiiiiiiiiiltiiiiiiiiiiiiliiiiii ii5iiiiiiie iiiiiiiiiiii bullbull bull l t raquo iiiiiiiiiiiiiiiNC iiiiiiii isci i i i | | i i i | | i p i i II0M^I iiiiiliiiiiiiiilii WM^MmM ilillilflil i | | | l il |o| | l i i l i P liiiiiiiiii iiiiiiiiiiiiip8iii bullbull ( U si i l i l i iiiiii- iiii-li|i5 iiiiiiiiiiiiiiiiiiii iiiiiiiiiiipiiiiiiii-iiiiiiiiiiii -i- o-iil bull iiiiiiiiiiiiiiiiiiiiiiiiiiiM iiiiiiiiiiiiii iiiii iiiiii iiii iiiiii laquoiii
|i|||ii Iliii illl|iillSI |illliSl^| illillaquoii iiiiiiiiiiiiiiiiiiii iiiiiiiiiliiltiii laquo raquo iiiiiiiiiiiii||i||| iiiiiiiiiiiiii iii|i|ltoigttiiiiiiiiiiiiiiii i iiliiiiilii iiiiiiiiiiiii bull^bull i l iNc| i-|iiiii -i-iii ii gti5 i iiiiiiiili^^ iiiiiiiiiiii Oiiiiiiii|i bulliiiiiiii Sodium 14100 28900 12500 26raquo00 16320 33200 16300 68000 N c NC NC Nc NC Nc Thal l ium 10 10 58 10 1400 (1) 40 (1) 32 567000 16200 1296
igtPiiiilli MmmmiM liilililil iiliiiiisii iii|ii| bulliiii iiiiiisiiilii iiiiiiiiiiiii|i ii^|i iiiiiiiiiil iiiiiii iiiiiiii ii^iliiiiiiiNiilliiiiiiiji- bulli|iiiiiflaquoSiiiiiiiiiiiiiiiiii iii|lNe-|i-ii iiiiiiiiiisiiiiiiiiiiiiiiii Nc iiiiiii liiNCii iiiiiii iiiiiiiilifiei iiiii iiiiiii iilaquo|||il| mmmmi m m m i M iiiiiiiili iiiiiiiiiiiiiiiiisil i iiiisiiiiilllii iiiiliiiiiiiiliiiiiiiiiitii iiiiiiiiiiiiiiiiiiiiiiiiiiifiii iiiiiiliili-|s4ii iiilliiiiiiii ssiiiiiiiiiiiiii iiiiiiii^^iii-iiiii iiiiiiiiiiiiiiiiiiiiiiiliii i iiiiiiiiiiiiiiliiiiiiii 13365 iiiiiiiliiiiiiiiiiiiip^ P b a i e I RI sampling conducted in M a y 1988 Phase II RI samplmg conducted in Apri l 1989
N C = N o cri teria exiata for th is compotmd
N A = N o t Available
(1) Insufficient Data to Develop Cri ter ia Value presented is L O E L - Lowest Observed Effect Level
(2) Value preaented for careinogena ia the 10-S level
(3) Hardness dependent c r i te r ia (25 mgA C A C 0 3 uaed)
(4) Value presented is for Ihe m o r e toxic hexavalent form
(5) Value presented is proposed (more conservat ive)
(6) Effluent Discharge L imi t dilution factor based upon an effluent discbarge of 5 gpm to the Neponse t River during the 7 - d a y low flow lOyr recurrence (2020gpm)
USOS Pleasant Street Oaug ing atation on the Neponset River
(7) Dilut ion factor =[(Sgpm+2020gpm)Sgpm]= 405
(lO)Concentration exceeds effluent discharge limit contaminant must be removed by Groundwate r Treatment Plant before discharge to Ihe Neponset River [ D = D A I L Y M A X A = A V O M O N T H L Y F=FISH]
c and 1-3 for effluent (Uscharge limits for organic and inorganic compounds An acute toxicity
test showed that no toxic effect was observed for the interim treatment discharge
114 Conclusions
Based on the results of the Phase I bench scale treatabUity study the combined unit
operations of fUtration foUowed by carbon adsorption were effective in treating the
contaminated groundwater coUected during the pumping tests for temporary discharge to the
Neponset River A sample of the discharge was coUected during the groundwater treatment
and it was found to contain less than the quantitation limit of 05 xgL of PCB The metals
concentrations were aU determined to be below the discharge criteria A sample was also
coUected and submitted for an acute toxicity determination The resuUs showed that no toxic
effect was observed The bench scale treatability results and the on-line discharge analyses
demonstrate that the filtration and carbon adsorption unit operations were effective temporary
treatment techniques
^ 12 FULL SCALE STUDY
A groundwater treatability study was conducted to evaluate the performance of four different
treatment processes on contaminated groundwater obtained from the Norwood PCB site The
contaminants present in the groundwater were determined during previous studies conducted
in May 1988 and AprU 1989 by EBASCO Chapter 1 of the Final FeasibUity Study
(EBASCO 1989c) contains an overview of the results obtained during these investigations
Based on the resuUs of the May 1988 and AprU 1989 field investigations EPA concluded
that the overburden and bedrock aquifers beneath the site were contaminated with
polychlorinated biphenyls (PCBs) and volatUe and semivolatile organic compounds (VOCs
and SVOCs) It was determined that surficial and subsurface soUs dredge pUes of sediments
taken from Meadow Brook sediments in Meadow Brook and sediments in the drainage
system of the buUding operated by Grant Gear were the sources of the contamination In
r
c September 1989 EPA released the Record of Decision (ROD) for the Norwood PCB site In
the ROD EPA directed that groundwater be treated with a system including activated carbon
air stripping with vapor controls and precipitationfiltration iEPA also directed that
treatability studies or pUot studies be conducted to aid in the overaU design of the system
In accordance with the ROD a bench scale treatabUity study was conducted at the ENSECO
Laboratory Facility in Cambridge Massachusetts by Metcalf amp Eddy personnel between
January 14 and February 16 1992 This report presents a description of the work
completed resuUs and conclusions of the study
121 Objectives
The fuU-scale groundwater treatability study was conducted to determine if treatment
consisting of precipitation fUtration air stripping and carbon adsorption would effectively
remove the contamination present in the groundwater at the Norwood PCB site to appUcable
standards Information on the percent reduction of organic and inorganic compounds in the
groundwater volume type of residual and byproducts produced by each component were
also investigated A schematic detailing the treatability study and the sampling and analysis
conducted is presented in Figure 1-1
122 Description of Work
The treatability study was performed in accordance with Pre-Design Work Plan 3 and the
QuaUty Assurance Project Plan for the Phase n Bench-Scale TreatabiUty Study (Work
Plan 3)
Groundwater samples were coUected from the Norwood PCB site for use in this
investigation Interim sampling was performed on effluent streams generated from each
bench-scale process for analysis according to Table 1-4 Influent and final effluent samples
generated during the groundwater treatabiUty were coUected and analyzed through the CLP
^
o JAR TESTING SAMPLE ID
o
POLYMER TESTING
RAW GROUNDWATER
VOL 1 SVOL I p PCB f ^ ^ METALS
mdash SST
T
T
T
SS - Choose Polymer T ar)d Dose Estimate pH pf i After Coagu lant
Jar Test 1 PH10 bull
Lime wCoag wPdymer - SS T Metals
Ume wCoag wo Polymer - SS T Metals
- NaOH wCoag wPolymer - SS T Metals
NaOH wCoag wo Polymer - SS T Metals
Jar Test 2 pH9
Jar Test 3 pH8
bull
Lime w C oag wPdymer - SS T Metals
- Lime wCoag wo Polymer - SS T Metals
- NaOH wCoag wPolymer - SS T Metals
NaOH wCoag wo Polymer - SS T Metals
- Lime wCoag wPolymer - SS T Metals
- Lime wCoag wo Polymer - SS T Metals
- NaOH wCoag wPolymer - SS T Metals
- NaOH wCoag wo Polymer - SS T Metals
JT1 -1 shy
j r i -2 shy
JT1 -3 shy
JTI-4
j r 2 - 1
JT2-2 shy
JT2-3
j r2-4 bull
JT3-1 shy
JT3-2shy
JT3-3 bull
JT3-4 shy
HLTRATION TESTING
RIter Paper 1 - SS T Time mdash |
RIter Paper 2 - SS T Time-
Rlter Paper 3 - SS T Time -
CtHXise Filter Paper or Particle Retention Size
Sample Well Using Bailer
VOL SVOL PCB CLPMETALS (PPF-1)
Precipitate and Filter Using Optimized Polymer pH Coagulant and Filter
system for volatUes semivolatUes PCBs and metals AU interim samples were analyzed at
ENSECO in Cambridge Massachusetts AU data was vaUdated by MampE according to the
QAPP
1221 Groundwater Sample CoUection Groundwater for this study was coUected from
weUs MW-IA and ME-8 as shown on Figure 1-2 iMW-lA was chosen as a sampling
location because it was determined to be one of the most contaminated weUs on-site based
on previous investigations During the course of the treatabiUty study a decision was made
to obtain samples from ME-8 because results of the most recent sampling effort conducted by
ICF indicated that groundwater from this weU contained approximately 200 xgL vinyl
chloride whereas groundwater from MW-IA no longer contained any quantifiable amount
Removal of vinyl chloride by aeration needed to be demonstrated during this investigation
because vinyl chloride is not effectively removed by carbon adsorption
Groundwater samples were obtained on four separate occasions during the study as shown in
Table 1-5 On each occasion the groundwater was coUected in accordance with the Field
Sampling Plan Three weU volumes of water were purged from the weU using a centrifiigal
pump before any samples were coUected The pH temperature and conductivity of the
purge water was measured after each weU volume untU the measured values differed by less
than 10 for three consecutive samples to ensure the sample drawn was representative of the
water in the aquifer Samples for the metals precipitation and filtration study were coUected
using a centrifugal pump Samples for the air stripping and carbon adsorption study were
coUected with a teflon baUer to minimize aeration and possible loss of volatUes during
sample coUection
The samples were coUected in one gallon amber glass bottles and stored at 4degC Each
sample bottle wasfiUed to exclude a headspace in the bottle
e 10
200 200
SCALE IN FEET
D CAP ROCK SAMPLE LOCATION
bull WELLS
nOURE 1-2 GROUNDWATER AND TRENCH AND CAP
ROCK SAMPLING LOCATIONS
11
E T C A L F a EDDY
c TABLE 1-5 GROUNDWATER SAMPLING SUMMARY
Mode of Date WeU Amount Sampled pH Temp degC Conductivity SampUng
11392 MW-IA 10 gallons 62 8deg 220 umhocm pump
12792 MW-IA 16 gaUons 62 8deg 220 umhocm baUer
20392 MW-IA 16 gallons 62 8deg 220 umhocm baUer
20592 ME-8 2 gallons 64 8deg 230 umhocm baUer
1222 Precipitation Testing
General Chemical precipitation for the removal of metals was evaluated at three pH values
and three polymer dosages to determine the effectiveness of the treatment A preliminary
evaluation of different coagulants and polymers was conducted at three pH values by
r Metcalf amp Eddy personnel and a leading polymer vendor to determine which chemicals could
potentiaUy be used to precipitate groundwater Based on the results from the preliminary
evaluation jar tests were conducted by Metcalf amp Eddy personnel to aid in the determination
of the chemical dosages required to optimize the effectiveness of precipitation
Polymer and Coagulent Testing Polymer testing was performed by Metcalf amp Eddy and a
leading polymer vendor at the ENSECO laboratory faciUty in Cambridge Massachusetts
The effectiveness of anionic cationic and nonioiuc polymer was evaluated at three pH
values The best polymer was determined to be Drewfloc 2270 a low charge anionic high
molecular weight polymer This polymer was used in jar tests 1 through 5 The best
coagulent was determined to be Charge Pack 12 (CP-12) a higher charge cationic low
molecular weight coagulent The CP-12 coagulent was used in jar tests 1 through 5
described under jar testing
12 c
InitiaUy the effects of varying the pH of the groundwater sample was investigated Tests c were conducted at pH values of 80 90 and 100 with sodium hydroxide which had the best
settling characteristics based on visual observation and turbidity measurement Each polymer
was then tested at pH = 100 to evaluate Us effectiveness under optimum pH conditions
A formula of polymer and coagulant addition was developed based on visual observations
suspended soUds and turbidity analyses performed on each sample generated during the
investigation The anionic polymer effectively flocculated the existing smaU suspended
particles and the addkion of cationic coagulant removed iron and color when the pH was
raised to 100
Jar Testing Five jar tests were performed using the polymer and coagulants determined to
be effective during preliminary testing Jar tests 1 and 4 were conducted as dupUcates at
ph 10 Jar test 2 was conducted at pH 9 jar test 3 was conducted at pH 8 and jar test 5 was
conducted at pH 10 On each occasion prior to beginning the jar test the raw groundwater
was brought tol5deg-17degCina warm water bath The temperature was held constant to c eliminate the effects of temperature on reaction rates and solubUity
The foUowing is a description of activities conducted during the jar tests fti through 4 See
Figure 1-1 for details Four samples were evaluated during each jar test For each jar test
four 15 Uter beakers were fiUed with 1 Uter of raw groundwater The beakers were placed
on the stirrer platform and the paddles were lowered into the sample The jar stirrer was
operated at 80 revolutions per minute (rpm) The pH was then adjusted to the desired value
(pH = 10 9 8 10 for Tests 1 2 3 4) with a lime slurry in two samples and with a
sodium hydroxide solution (25) in the remaining two samples Lime was added to
investigate its effects on the precipitate and to evaluate its effectiveness in pH adjustment
The cationic coagulant was then added to each sample untU the concentration in solution was
30 mgL The solution was stirred at 80 rpm for 2 minutes to ensure complete mixing The
polymer was then added to one sample pH adjusted with sodium hydroxide and one sample
pH adjusted with lime Mixing continued for two minutes Next the solution was stirred
13 c
slowly orflocculated for five minutes at 20 rpm FinaUy the solutions were aUowed to
c settle for 10 minutes Visual observations were recorded and samples were submitted for
suspended soUds turbidity and metals analyses
Jar test 5 was performed to assess the removal of manganese and aluminum by preaeration
and permanganate additions (see Figure 1-1) Because no significant benefit was observed in
the previous tests when lime was used instead of sodium hydroxide sodium hydroxide was
used to adjust the pH in aU four samples to a pH of 100 in jar test 5 Only sodium
hydroxide was added to the groundwater in the first jar to determine the removal of
manganese and aluminum attributable to the formation of an insoluble salt at high pH
Sodium hydroxide and polymer were added to the second jar to evaluate the effectiveness of
the polymer Sodium hydroxide polymer and coagulant were added to sample 4 The
supemate from sample 4 was then fUtered This was performed to determine if the required
removal efficiencies could be achieved by chemical precipitation and filtration
Permanganate was added to sample 3 in addition to sodium hydroxide coagulant and
polymer to determine if the manganese and aluminum present could be chemicaUy oxidized c to a less soluble state which would enhance the efficiency of fUtration The supemate was
then siphoned off using clean tygon tubing and a syringe into the sample containers
Samples were submitted for metals suspended soUds and turbidity as illustrated on
Figure 1-1
1223 Filtration Testing A bench-scale filtration study was perfonned to determine the
optimum pore size of filter media that could effectively remove the suspended soUds in the
precipitated groundwater The determination of the removal efficiency for each filter was
based on the concentration of suspended soUds and turbidity of the filtered water The time
required to filter the groundwater was also evaluated
Prior to filtration the metals in the groundwater were precipitated and coagulent and polymer
were added using the optimum conditions developed during the precipitation study The
optimum conditions consisted of pH adjustment to 10 with sodium hydroxide addition of
14 c
coagulent CP-12 to a concentration of one percent and addition of Drewfloc 2270 polymer to
c a concentration of 10 mgl Three grades (10 xm 5 xm and 1 xm pore sizes) of filter
paper were used with a Buchner ftmnel to filter aUquots of the precipitated groundwater
Samples of the filtered water were submitted to ENSECO for suspended soUds and turbidity
analysis
A sample of the metal hydroxide sludge was coUected during the treatability study The
sludge sample was submitted to the CLP system for PCB and metals analysis so that a
characterization of the sludge could be made and disposal options could be evaluated
1224 Air Stripping Testing Precipitated fUtered groundwater was aerated at three
different air to water ratios to determine the most effective stripping ratio To ensure that
worst case volatUe organic compound concentrations were present in the samples for this
study some modifications were made in how the sample was coUected and treated First
the groundwater was coUected with a baUer to prevent the loss of volatUes AdditionaUy the
water was fUtered under positive pressure foUowing the precipitation step to minimize the c loss of volatUes that would result if the water was filtered using a vacuum pump
An aquarium pump tygon tubing and aeration stone with a glass-fiber fUter cartridge was
used to aerate 1-Uter aUquots of precipitated and filtered groundwater The aeration flow
rate was caUbrated by filling a graduated cylinder with air that had been filled with tap water
and inverted in a water bath The air was diffused at 375 missec into 1-Uter aUquots of
groundwater and the time measured as iUustrated in Table 1-6 The aerated groundwater was
submitted to ENSECO for volatUe organics analysis
1225 Carbon Adsorption Testing The effectiveness of activated carbon for the removal
of organic compounds in the groundwater at the site was evaluated The carbon used was
the powdered activated 325 mesh carbon suppUed by Calgon Corporation The groundwater
samples used for this investigation were obtained and filtered as described in the air stripping
15 c
c
c
TABLE 1-6 AERATION TEST OPERATIONS
Air to Water Ratio Volume Volume of by Volume of Water Air Reqd Min of Aeration
251 1000 ml 25000 ml 111 501 1000 ml 50000 ml 222 751 1000 ml 75000 ml 333
section of this report to minimize the loss of volatUes A total of twelve samples were mn
during this investigation The necessity of air stripping was investigated by comparing the
resuUs from four samples that were air stripped to seven samples that were treated identicaUy
with the exception of air stripping AU samples for the air stripping comparison went
through the precipitation filtration and carbon adsorption processes AdditionaUy one
sample was prepared with no carbon added to serve as an untreated sample The samples are
summarized in Table 1-7 Each groundwater sample was prepared and mixed with a
predetermined dose of Calgon powdered 325 mesh activated carbon and placed m an open
Erlenmyer flask on a shaker table for a two-hour time period at 180 rpm A rotary shaker
table capable of accommodating twelve (12)-1000 ml Erlenmyer flasks was used Effluent
was fUtered with a barrel filter using a glass-fiber pre-fUter and a Whatman 45 micron
membrane The effluent clear and odorless in aU cases was added to sample containers
preserved and packed for shipment to CLP laboratories Since the shaker table could
accommodate 12 flasks a total of approximately 4 gaUons of effluent was generated during
each mn Several mns were performed to generate adequate quantities of sample for
analysis accordmg to Table 1-7 Groundwater was simUarly prepared for submittal to
Aquatec Lab in Burlington Vermont for chronic toxicity testing Three (3) shipments of
approximately 2 gaUons each were made
r 16
C) o o TABLE 1-7 CLP TREATABILITY STUDY SAMPLING SUMMARY
Dose g of Carbon Required of mis in gs Carbon
Sample ID 1000 ml of GW Analysis Volume mis Flasks Flasks in each
Precipitation Filtration Aeration amp Carbon
AC-1 05 V SV MET 3400 3 1067 054 AC-2 20 V SV PCB 4400 4 1100 22 AC-3 50 V SV MET 3400 3 1133 57 AC-4 100 V SV PCB 4400 4 1100 110 AC-5 Trip Blank 0 V
Precipitation Filtration amp Carbon
C-0 0 V 500 1 500 0
C-1 05 V SV MET 3200 3 1067 053
c-2 10 V PCB 2200 2 1100 11
C-3 20 V SV CT 29000 24 1250 25
C-4 50 V SV PCB 4400 4 1100 55
C-17 70 V MET 1200 1 1200 70
C-18 100 V SV 2200 2 1100 110
C-13 Treatability Blank 0 V PCB 2200 0 0 0
C-20 Trip Blank 0 V 0
C-10 Duplicate of C-1 05 SV 2000 2 1000 05
C-1 05 (MSMSD) 500 1 500 025
C-11 Duplicate of C-1 05 MET 1000 1 1000 05
C-20 Duplicate of C-2 10 V PCB (MSMSD)
4400 4 1100 11
C-16 Duplicate of C-4 50 PCB 2000 2 1000 50
C-6 0 PCB 2000 2 1000 0
17
o o n TABLE 1-7 (Continued) CLP TREATABILITY STUDY SAMPLING SUMMARY
Dose g of Carbon Required of mis in gs Carbon
Sample ID 1000 ml of GW Analysis Volume mis Flasks Flasks in each
Precipitation amp Filtration
PPF-1 V SV MET PCB 2000 2 1000 0
Sludge
Sludge-1 0 MET PCB 0
V = VolatUe organics SV = Semivolatile organics MET = Metals PCB = Polychlorinated biphenyls CT = Chronic toxicity MSMSD = Matrix spikematrix spike dup D = DupUcate TB = Trip blank PPF = Precipitated and pressure filtered
(to minimize volatUes loss as opposed to vacuum filtration)
18
c
c
123 Results
1231 Precipitation Testing
Polymer Testing Preliminary polymer and coagulant testing was conducted to determine
the type of polymer and coagulant that could be employed to treat groundwater from the site
The Drewfloc polymer and the Drew CP-12 cationic coagulant were chosen as the most
effective types InitiaUy the effect of varying the pH of the groundwater sample was
investigated The resuUs of tests conducted at pH values of 80 90 and 100 are presented
on Table 1-8 As the pH value was raised the quaUty of the floe improved The sample
raised to a pH level of 100 with sodium hydroxide exhibited the best settling characteristics
based on the color turbidity soUds and the quaUty of the floe
The effects of varying the polymer dose was then investigated at pH=100 The cationic
coagulant added to a concentration of 30 ppm after pH adjustment and prior to polymer
addition produced the clearest supemate based on color turbidity and suspended soUds
results Table 1-8 also summarizes the results from this investigation
Jar Testing Four jar tests were performed to evaluate the effectiveness of chemical
precipitation for the removal of metals in groundwater from weU MW-IA The analytical
results from the jar test are presented in Table 1-9 The greatest metal reductions occurred
when the pH was 100 Samples for which the pH was adjusted with lime showed better
removal of barium manganese and sodium concentrations than those samples for which the
pH was adjusted with sodium hydroxide Samples for which the pH was adjusted with
sodium hydroxide showed greater declines in the concentrations of calcium and magnesium
No significant effect was observed on the removal of cobalt iron lead aluminum potassium
and zinc when lime or sodium hydroxide was used to raise the pH The observation that
samples for which the pH was adjusted with sodium hydroxide had elevated concentrations of
19 c
c TABLE 1-8 PRELIMINARY POLYMER TESTING RESULTS
Description of Supemate
Procedure pH ColorSoUds
mgl Turbidity
NTU Floe SettleabUity
Varymg pH
Raw Groundwater pH adjustedNaOH pH adjustedNaOH pH adjustedNaOH
62 80 90 100
YeUowbrownYeUowbrownYeUowbrownYeUowbrown
450 gt50 gt gt 5 0 gt gt50
58 SUght mst pin floe medium
gt medium
None Slow Faster Fastest
Varying polymer dose pH adjustment wNaOH
pH adjustedno polymer
100 YeUowbrown gt gt50 gt medium Fast
Above wpolymerat 1 ppm
100 Light yeUow lt 10 35 large 18 Fast
c Polymer at 5 ppm 100
Polymer at 1 ppm 100 wcoag 30 ppm
Light yeUow
Very Ught
lt 10
lt 10 yeUow
32
30
Large 18
Targe 18
Fast
Fast
n 20
o o n TABLE 1-9 F U L L - S C A L E TREATABILITY STUDY JAR T E S T R E S U L T S
Results in mgL
SAMPLE ID iiiiiiiiiiiiiiiiiiiiMW JAiSiiii iiiJTililiiiiiiiiiiii iiiJTil^iiiiiii iiiiiiiiiiTIi3iiiiiiiii iiiii^ii^li^iiiiiiiiiiiiii^iiri^iiiiisiiiiiiiiiiiiimii iiiiiJT4^iiiiiiiiiiiiiinP4i4iiiiiiiiiii iiiiiJT2iiliiiiiiiiiiiiT2^iiiiiii |i|S^ iiiiiiiiiiiiiiiiiiiiiiiiiiiiilM ii iiiiiiiiiiiiiiiiiiiiJlt iiiiiiiiii iiiiiiiiii-iiiiiiii iiiiiiiii=iiiiiiiiiiiiiliiiiii iiiiiiiiiiiiiiiiiiiiiiliiiiiiiiiiiiiiiiiiiiiiiiiiliiiiiiiiiiiiiM ii^iiiiiiiiiiiii6iiiiiiiiiiiiiiiiiiijqiiiiii mmsectlsectMimamp0^
Zinc 0488 002 U 002 U 002 U 002 U 002 U 002 U 002 U 002 U 002 U 002 U
E S A M P L E ID iiiiiiiiiiiiiiiiiiiiJT2i3iiiiiiiiiiiiiiiii ^T2-4iiiiiiiii iiiiiiiiJ^alliiiiiiiiiiiii iii^Ta^iiiiiiiiiiii iiiiiiiiit3|3iiiiiiiiiiiii iiilT3Tr4iiiiiiiiiiiiiii rrs-i iiiiiiiiiiiiiiJTSl iiiiiiiiiiiiiii iiiiiitJiJiiiiiiiiiii iiiiiiWs-4iiiiiiiiiiiii iiiiiiiJT5r-5ii|iiiiiiii
iiiiiiiiliiiiiiiiiiiiiiiiiBSsiii iiiiiiiiiiiiiiiiiiiiiilgtHiiiiiiiiiiii iiiiiiNaOHiiiiiiii iiiiiiiiiiii)iliimiiiiiiiii iiiiiiiiSiiriiiisiiiiiiiiii iiiiiiiiNiliiiiiiiiii iiiii iNapHiiiiiiiiiiiii iiiiiiiiiiiiiiiifloiiiiiiiii iiii^iiiiiiiiiii iiiiiiii NiitQHiiiiiiiii iiiiiiiiiWftOHiiiiiiii wmm iii^iiiiiiiisiiiiiiiAli|ilii iiiiiiiiiiixiiiiiEal3i iltgtoi PolyCoag C o a g u l a n t PolyCoag Coagulant iiiiiiii iiiiiii iiiiiii)|sihyii^iiiiiiii PolyCoag PolyCoag iiiPoij^iii^il ANALYTES Aerated KMn04
Barium 0073 0072 010 010 010 010 NA NA NA NA NA Calcium 247 247 571 574 273 277 NA NA NA NA NA Cobalt 001 U 001 U 0017 0018 0017 0019 NA NA NA NA NA Iron 01 U Ol U 016 023 016 043 NA NA NA NA NA Lead 0005 U 0005 U 0005 U 0005 U 0005 U 0005 U NA NA NA NA NA Magnesium 44 44 50 51 50 50 NA NA NA NA NA Manganese 35 33 43 43 44 44 063 086 099 094 14 Potassium 5 U 5 U 5 U 5 U 5 U 5 U NA NA NA NA NA Sodium 423 477 170 169 502 508 NA NA NA NA NA Zinc 002 U 002 U 0082 011 015 016 NA NA NA NA NA
Notes Only metals detected in untreated groundwater from MWIA are presented NA = Not Analyzed
U = undetected at specified detection limit JTI = Jar Test 1
c
c
sodium in the treated water was expected This is because sodium is a component of sodium
hydroxide Similarly the elevated concentrations of calcium observed in samples for
whichthe pH was adjusted wUh lime are due to the calcium component in lime Jar test 5
was conducted to assess the effect that precipitation and chemical oxidation had on the
removal of manganese and aluminum The results of this investigation are also presented in
Table 1-9 The results indicate that greater reductions of aluminum and manganese cannot
be achieved with aeration or by the addition of a chemical oxidant such as permanganate
A sample of the metal hydroxide sludge a residual that wiU be generated during the
groundwater treatment was analyzed for metals and PCBs This sample of sludge was
generated by treating contaminated groundwater with precipitation and filtration using the
optimum treatment parameters The metals results indicate that the sludge would not be
considered hazardous under RCRA using the toxicity characteristic leaching procedure
(TCLP) A TCLP was not performed on the sludge however based on 1) the concentration
of the metals in the sludge 2) assuming a 100 leachability and 3) incoiporating a 20-fold
dUution for a soUd matrix analyzed by TCLP this sludge would not be considered hazardous
under RCRA The PCB analysis of the sludge showed that Aroclor 1254 was the only
detected PCB at a concentration of 31 mgkg The TSCA limit for PCBs in waste is
50 mgkg indicating that this sludge would not be hazardous under TSCA The results for
this sludge represent a preliminary characterization and once the fuU scale treatment system
is on line the sludge analysis wiU need further testing to confirm these preliminary results
and to make a further assessment of the disposal options The analytical resuUs for the
sludge are presented in Table 1-10
1232 FUtration Testing A bench-scale filtration study was performed to determine the
optimum particle retention grade or mesh of filter media that could effectively remove the
suspended soUds in the precipitated groundwater The results of the analysis on the fUtrate
are presented in Table 1-11
n 22
c
c
TABLE 1-10 PRECIPITATED METAL HYDROXIDE SLUDGE RESULTS Results in mgkg
i||ipiiiii|iiiiiiiiiiiiiiiii^^iiiili|ii^^^ TCLP or TSCA L i n i l t s i Tfesi-iiiiiiiiiiiiiiisiiiiii^iiiiiiSvHiij^ in Solid Matrices ii iiiiS WM3KT2S
METALS
Aluminum Antimony Arsemc Barium Beryllium
Cadmium Calcium Chromium Cobalt Copper Iron Lead Magnesium Manganese Mercury Nickel Selenium Silver Sodium Thallium Vanadium Zinc
PCBs
Aroclor 1254
41100 231 195 346 5767
9120 338
25 114
39000 694 5260 2730
03313
04
8960 08
561446
31
U U
U
J
U U U R
U U J
J
NC NC 100
2000 NC 20
NC 100 NC NC NC 100 NC NC
4 NC 20
100 NC NC NC NC
50
Notes = TCLP Limits incorporated a 1 to 20 dilution factor for solid matrices Aroclor 1254 was the only PCB detected The remaining six Aroclors
were nondetect at a quantitation limit of 36 mgkg NC = No criteria exists for this compound U = Undetected at speciiied detection limit
L J = Estimated value due to validation criteria R = The result is rejected
23
c
c
TABLE 1-11 FILTRATION STUDY RESULTS
Media Rating Speed Suspended SoUds Turbidity
Raw 45 mgl 578 Course 10 um 200 mls5 sec lt5 mgl 16 NTU Medium 5 um 200 mls7 sec lt5 mgl 19 NTU Fine 1 um 200 mls23 sec lt5 mgl 18 NTU
Since there was virtuaUy no difference in the quaUty of effluents but substantial increase in
time to filter with the fine filter paper the medium 5 micron paper was chosen to prepare
sample for ftirther study
1233 Air Stripping Precipitated fUtered groundwater was aerated at 3 different air to
water ratios to evaluate the effectiveness of air stripping for the removal of volatUe organic
compounds in the groundwater Tables 1-12 and 1-13 shows the analytical results for
groundwater samples obtained from weUs MW-IA and ME-8 respectively No volatUe
organic compounds were detected in samples that were aerated at a 501 air to water ratio
Aeration of precipitated filtered groundwater obtained from weU ME-8 removed aU of the
vinyl chloride at an air to water ratio of 251
1234 Carbon Adsorption The effectiveness of carbon adsorption for the removal of
organic compounds in the groundwater was evaluated The analytical results are presented in
Table 1-14 At the lowest carbon dosage only 1 xg1 of cis-12-dichloroethene and
2 xg1 of trichloroethene remained No site-related volatUe organic compounds were detected
in samples which were treated with higher doses of carbon Toluene and
dibromochloromethane were detected in sample C-4 however these two compounds were
not detected in the raw groundwater and must therefore be a result of lab contamination
24 c
c TABLE 1-12 FULL SCALE TREATABILITY STUDY AIR STRIPPING RESULTS IN ugL FOR WELL MWIA
Methylene Chloride 10 u 4 U 5 U 5 U 4 U 4 U 2 U 4 U
cis-12-Dichloroethene 200 D 1 U 1 06 J 06 J 1 U 1 U 1 U
Chloroform 4 J 1 U 1 U 1 U 1 U 12 J 1 U 1 U
12-Dichloroethane 10 U 2 1 u 1 U 1 U 1 U 1 U 03 J
Carbon Tetrachloride 10 u 1 U 1 u 1 U 1 U 1 U 1 U 01 J
Trichloroethene 860 D 1 U 2 06 J 06 J 02 J 1 U 1 U
Toluene 10 U 020 J 1 U 1 U 1 U 007 J 25 1 U
Dibromochloromethane 10 U 1 U 1 U 1 U 1 U 1 U 14 1 U
Chlorobenzene 5 J 1 U 1 U 1 U 1 U 1 U 1 U 1 U
Ethylbenzene 10 U 1 U 1 U 1 U 1 U 1 U 1 U 1 U
Total Xylenes 1 J 1 U 1 U 1 U I U 1 U 1 U 1 U
Styrene 10 U 1 U 1 u 1 U 1 U 1 U 09 J 1 U
124-Trichloroben2ene 2400 D 4 1 u 1 U 1 U 1 U 1 U 1 U
123-Trichloroben2ene NA 5 1 u 1 U 1 U 1 U 1 U 1 U ^
SEMIVOLATILE ORG ANICS
Diethylphthalate 10 U 2 J 10 u 10 U 10 u Di-n-butylphthalate 10 U 1 J 10 u 10 U 10 u
Bis(2-ethylhexyl)phthal ate 10 U 10 U 10 u 4 J 2 J
Notes
Only volatile and semivolatile organics detected in any sample are included
No PCBs were detected in any effluent sample at a detection limit of 01 ugL influent was 36 J ugL
C-ID = Duplicate of C-1
U = Undetected at specified detection limit
J = Estimated value due to validation criteria
D = Duplicate
NA = Not Analyzed
= Value is for total 12-Dichlorocthene
i| f|iiiiiiiiiiiiiii^ti8ili| WSk
3 U 2 u 8 U
1 U 1 u 1 U
1 U 1 u 1 U
04 J 1 U 1 U
1 U 1 u 1 U
03 J 008 J 1 U
1 U 1 u 1 U
1 U 1 u 1 U
02 J 1 U 1 U
005 J 1 U 1 U
02 J OI J 1 u 1 U 1 U 1 u 1 U 1 U 1 u 1 U 1 U 1 u
10 U
10 u
2 J
27
c
The effectiveness of combining aeration and carbon adsorption to remove organic c contaminants was also investigated These results are also summarized in Table 1-15 No
organic compounds were detected m any of the samples generated during this investigation
124 Conclusions The results of the groundwater treatability study demonstrate that
treatment consisting of precipitation fUtration air stripping with vapor phase controls and
carbon adsorption appear able to meet cleanup levels estabUshed for the site Figure 1-3 is a
schematic representation of the proposed system The ROD stipulates that treated
groundwater wUl be reinjected to the aquifer onsite in this case MCLs are the cleanup
levels An altemative to be evaluated is discharging the treated groundwater to a surface
water body either Meadow Brook or the Neponset River In this case cleanup levels are
estabUshed as effluent discharge levels Effluent discharge levels are calculated by
multiplying the ambient water quaUty criteria (AWQC) values for each compound by a
dUution factor The dUution factor for the Neponset River is based on a 100-gpm treatment
discharge rate and a Neponset River 7010 of 2020 gpm The dUution factor for Meadow
Brook is 1 since the treatment discharge rate is greater than the flow of the brook therefore
effluent discharge levels for Meadow Brook are set at AWQC
Tables 1-16 through 1-19 compare effluent discharge levels for both the Neponset River and
Meadow Brook to carbon adsorption effluent from the groundwater treatability study
Table 1-16 summarizes the concentration of metals in untreated groundwater the metals
concentrations remaining foUowing precipitation and filtration the metals concentration
foUowing aeration and carbon adsorption the metals concentrations foUowing caition
adsorption only the MCLs and the effluent discharge levels based on discharge to the
Neponset River The only metal effluent concentration which exceeds the MCLs is
aluminum the MCL for aluminum however is a secondary MCL which is nonenforceable
No metals concentrations in the effluent exceed any of the effluent discharge levels
n 28
c TABLE 1-15 FULL-SCALE TREATABILITY STUDY AERATION AND CARBON ADSORPTION RESULTS Results in ugL
iiiiii|Mpt-HiiDiiii-iiiiii^iiiiiiiiiiii iii bullbullbull^(6-^1 iiiiii-iiiiiiiii iiiiiiiiii^g-2iiiiiiiiiii|i
l | | | ibyNigtii i i i i | i i i i i i i | ivi
VOLATILE ORGANICS
Mediylene Chloride 6 U 4 U Carbon Tetrachloride 1 U 01 J Toluene 02 J 1 u Total Xylenes 1 U 1 u Acetone 5 U 5 U 2-Butanone 5 U 5 U 2-Hexanone 5 U 5 U 4-Methy 1-2-pentanone 5 U 5 U Carbon Disulfide 1 U 1 U
c Notes Only volatile organics detected in any sample are included U = undetected at specified detection limit J = value is estimated due to validation criteria
iiiiiA61iiiiiiiiiiiii
3 U 1 U
02 J 01 J
5 U 5 J 5 U
5 U 1 U
i|AGii[ijiiifii
3 U U
01 J 1 U 5 U 5 U 5 U 5 U 1 U
i^^^iiiiiic|ii[|ili
10
1 u 1 u 1 u 5 U 5 J
5 U 5 U 1 U
29
c
o o o
o
Gas Phase GAC or Catalytic Oxidation
To ^ Ambient
Air
To Groundwater Recharge or
Raw Treated ) Neponset River Groundwater Groundwater Influent Holding Tank J
Solids for Offsite Disposal
(NOTE Air stripper not necessary if discharge to Neponset)
FIGURE 1-3 PROPOSED GROUNDWATER TREATMENT SYSTEM SCHEMATIC
2483JP
o n o TABLE 1-16 COMPARISON OF INORGANIC FULL-SCALE TREATABILITY STUDY RESULTS TO MCLS AND DISCHARGE LEVELS
[i^i^^^^ iiiiiiijiMf|iilaquo4 Precipitation Aeration and Carbon AdsorpUoi iiiiiiiiiiiiiiiiiiiiiiritliiiiin
iiiii iiSiiii|iiiiiiiiiiiiiiiii and Filtration M^ Iiiiiiiiiiiiii iiiiiiiii|iiii|i|iiiiiiiiiii liiiijlliiiii
iiiiiiiiiiiiiiiiiiiii iiiiiiiiiiiiii i i i i i i i|ii||iiiiiiiiiiiiiiiiiiiiiiiii iiiiiiiiiiiiiiiilii Giliii iiiii ii iiiii i iiiic iD|i laquoi|iiiiiiii iiiiitiiiiciiiiiiiiiiiii
Discharge levels calculated by multiplying AWQC by a dilution factor based on a 100 gpm treatment discharge rate and a Neponset River 7Q10 of 2020 gpm
U = Undetected at specified detection limit
J = Estimated value due to validation criteria
NC = No criteria exists for the compound
P = Proposed MCL
S = Secondary MCL
n n o TABLE 1-17 COMPARISON OF INORGANIC FULL-SCALE TREATABILITY STUDY RESULTS TO MCLS AND DISCHARGE LEVELS
DISCHARGE TO MEADOW BROOK
[isjiiiiiiiiiiiiiiii-ii |iiiiiiiiiiiiiiiiiiiiiiiiiiiiiiiiiiiiiiiiiiiiiii iiiiiiiiiiiiiiiiiiiiiiiiiiiiii iiiiiiiiiiiiiiiiiiiiiiii- iiiiiiiiiiiiiiiiiiiiiiiiiiiiiiiiii ^iiiiiiiiiiiiiiiiiiiiiiiiiiiiiiiiii bull immMmii^^ F- piiiipiiiiil i i i i i i i i i i i AcraUon and Caibon AdsorpUon iii iii iiii i i i i l l l i i i i i i ^ ^ i p t ^ sectffllM^ ^ ^
Ajumin iw u i 358 bull490 z ii 240 i--lJi iiiiiiiiiiiJ^3iiitJi i i iii i3 lliiiiiiiiii iiii|ii]^(Ciiiiiiiiiii-iii-iiiiiiii5iiiii-iiiiiiiiNC^ Antimony 2i ij NA 44 U i44 U 44 U 44 U 44 U 10 P 88 30 8600
Ariseiaic- iiiiiiiiiiiiiiiiiiiiii8iiiiiiiiiiiiiii iiiiiiiiii-iis- - iiiiiiiiii- 1 u 71 J i-iiiiiy3|ili-uj - i i i 9 l i j i iii--5Qiiiiiiiiiiiiii iiiiii NC- NC - iL | Barium 247 32 106 U 65 U 597 49 U 131 IJ 2006 NC NC NC
Blaquoay|Hiiraquosi-- bullbullbull--bull i-iiiii-iiiiii3iiiiiiliiiiiiii -iiiiiiiiiiiNAi-iiiiiii I u -- 1 U iiiiiiiiiliilliiiiii-ii|iyi- iiiii iiiiiiiiiiiiiiiiii ii|i|40 - 53-bullbull13|shyCadmium ( S i u bull bull bull bull bull bull bull bull bull N A 4 UJ 4 UJ bullr^^ 4UJ 4UJ 5 682 038 170 Cai lc turn i bull- iiiiii3PiOCfiii iiiiiiiiiiii iiiiiiiiii^iiiiiiiiiiiiii 9650 i 8360 iiii7886iiiiiiiiiiiiiiiiiiiiiiii^iiiiiiii-ii6^^ iiiiii5isNltiiiiiiiiiiiiiiiiiii iiiiiiNC NGi NC Chromium 315 NA 8 J 7 UJ 7 u j 7 uj 7 iirj 160 16 11 3206
CO i-iii-iiii 33iitiii-iiiiii ii-iiiii-i-Jfiiiiii--iiii - bull bull 4 U Z 4 U- iiiiiiiiiiiiiilii-uiiiiiiiiiiiiiiiiiiiiiii4iitjiii-iiiiiiiiiii4 iiiiii-ii Nltiiiiiiiiiiiiiiiiiiiiii i l i iNc-- -NCi^-NCi
P ^ i bull bull Copper 6 4 i NA 128 U 179 U bull64Uj 9 U --256--u-- 1300 48 36 NC
Jtaa- iiiiiiiiiiii ltJOlt iiiiiiiiiii isiiiiiiiJQiii-i - z 6AS U ii232U-^^ bulliiiiiiiiiiiiiiiiiiiiuiiiiiiiiiiiiiiiiiiiiiiiiiiiiiiiiiii2 ipit|iiiiii iiiiii3pQiiiiJiiiilii liiiNC- v 1000- bull- NCi head 253 5^U^ 35 U 46 U 21 U 12 U J 2^4 u 14 054 NCis |Magnlaquoaiuiai iiiiiiiiiiilaquo)6iiiiiiiiiiiii iiiiiiiiiiii|lS)6iiiiiiiiiiiiii 3700 7060i V^ bulliiiMiiiiiiiiiiiiiiiiiii3Jpiiiiiii7^0iiiii^^^ i iiigtKSiiiiiiiiiiiiiiii bulliii I N C bull N C Ncjii Manganese 4810 bull356 62 U 18 UJ 23 U 35 U 53 U 56 S NC NC 106
Wtercuryi iiiiiiiiiiiiiiiiiiiiiiiiyiiiMiiiiiii iiiiiiiiiiiiiiiiiNAiiiiiii i P-2 U bullbull 0 2 U-- iiiiiiiiiiiiiiiiOi|iiittiiiiiii|iiiii 6iiiiit|iiiiiiiiiiiiiQ|iit|iiiiii iiiii|i|iiiiiiiiiii iiii|iii24- -- oon --0i|i Nickel 281 isrA 181 UJ 244 UJ 269 uil 17 U 356 il 166 P 643 33 3800
Potraquoslaquolum -iiiiiiiiiii4liS0iiiiiiiiii iiiiiiiiiiiii PPQiiiiU i 2200 U i ii 2620 XT | |i |owiiyiiiiii | |(^iiiiiiiiiii^ iiiiiiiiiiiiiiiW|iiiiiiiiiiiiii iii iii|ip--i NC- bullbullbull-KCii Selenium 20 U NA 32 U 13 UJ 1 6 u 1 UJ i u 5 6 266 50 6800 Sflycri i-i- iiiiiiiiiiiiiiiiiiiiiiiiiiiiiiiiiiiiiii iiiiiiiiiiiiiiiiiii iiii- i-4U bull -^M- U iii bull i i i i | | i | | i i i i |-i i | i | l | i i i i | i i i i iiiii-i ^66iiiiiiiiiiiiiii i|iP37 -0i2iNi Sodium 1 2 3 6 6 6 9 5 5 6 6 99000 lOlOOO 99866 106066 74566 NC NC NC NC
I m iiiiiiiiiiiiiiiiiiiiii||jriiiiii||iii|i|iii|| | ii46Q ^40- -bull-3iThaUJiiiitt - iiiiiiiiiiiiiiiiiiiiiiiiiiliiiiiiiiii iiiiiiiiiiiiiiNAii- I UJ ^ iiiiiiiiiiiiiiiiii Vanadium 439 NA 5 U 83 UJ 5 U 5 IJ 0 IJJ NC NC NC NC
Ziiicii^ iiiiiiii-iiiii- 488iiiiiiiiiiiiii iiiiiiiiiiii6iiu 151 U 67 UJ iiiii iiiiiiiiiiiiiiiil52iU- iiiiiiiii2 liiiiiiiiiii iiJiOQ()ii- Siiiiiiii iiiiiiiiii|6 bull bull33 - N C i
Notes
Discharge levels are AWQC (10-5 risk) since the treatment discharge rate of 100 gpm is higher than the flowrate of Meadow Brook
U = Undetected at specified detection limit
J = Estimated value due to validation criteria
NC = No criteria eus ts for the compound
P = Proposed MCL
S = Secondary MCL
o n o TABLE 1-18 COMPARISON OF ORGANIC FULL-SCALE TREATABILITY STUDY RESULTS TO MCLS AND DISCHARGE LEVELS - DISCHARGE TO THE NEPONSET RIVER
||x|o | bull iiii||i||il|A iiiiii iiiiiiiiliiiiiiiiiiili ii5iiPo|laquo|o|i iii||l|i|i||ii||y E^ly1 C DoteslOO ii i^i|raquoiiipltii=(iiiii|iii iiii i i w i M w iiiiiiilliHiJLYiiii iiiiWiiiiii iiiiiiiiiiiiii ii iiiiiiiiiiiiiiiiiiii iiiiii iiii iiiiiiiiiii iiiiiiiiiiiiiiiiii iiiiiiiiiililiiiiiiiiiliiiiii bulliiiiii lagaiiiiiiiii iiiiiiiiiiiiiiiiiiiiiiiiiiiiiiiii (ugL) iiiiiiii^iiiiiiiiii iiiiiiiiiiiiipiiiii iiUiiiiiii^ WmnKiiiiiii i(iiiiiiii i iii iiiiiiiiiiMiiiiii VOLATILE ORGANICS
112-Trichlorocthane 5 J 25 U 1 u 1 u 1 U 1 u 1 u 5 NC NC 8904
1122-TetrachIororthane 16 J 25 U 1 u I u I U 1 u 1 u NC NC 50880 2332
Chloroform 4 J 25 U 1 u 1 u 1 U I u 1 u NC 612680 26288 3328
Vinyl Chloride 10 U 50 U I u 1 u 1 u 1 u 1 u 2 NC NC 111300
11-DichIoroethene 10 U 25 U 1 u 1 u 1 u I u 1 u 7 245920 0 403
12-Dichloroethene (total) 200 D 97 1 u 1 u 1 u 1 u 1 70 245920 NC 29680000
Trichloroethene 860 D 430 1 u I u 1 u 1 u 2 5 954000 464280 19504
Tetrachloroethene 5 J 25 U 1 u I u 1 u 1 u 1 u 5 111936 17808 1876
Xylenes (total) 1 J 25 U 1 u 1 u 01 J 1 u I u lOOOO NC NC NC
Chlorobenzene 5 J 25 U 1 u 1 u 1 u 1 u I U NC NC NC NC
SEMIVOLATILE ORGANICS
Pentachlorophenol 25 U ND 25 U 25 U 25 U 25 U 25 U I 424 276 NC
Chlorobenzenes(total) 5300 1060 NC
13-Dichlorobenzene 3 J 2 10 U 10 U 10 U 10 U 10 U 600 NC NC 55120
14-Dichlorobenzene 17 9 10 U 10 U 10 U 10 U 10 U 75 NC NC 55120
12-Dichlorobciizcne 7 J 5 10 U 10 U 10 U 10 U 10 U 600 NC NC 360400
124-Trichlorobenzene 2400 D 50 10 u 10 u 10 U 10 u 10 U 9 5300 1060 NC
PESTICIDESPCBS
Arocloi-1254 36 J 32 NA 01 u NA OI u NA 05 42 03 01
Heptachlor 0074 J NA NA NA NA NA NA 04 11 01 01
Aldrin 017 J NA NA NA NA NA NA NC 64 NC 002
Heptachlor Epoxide 0045 J NA NA NA NA NA NA 02 NC NC NC
gamma-Chlordane 0056 J NA NA NA NA NA NA 2 51 OI 01
Notes
Discharge levels calculated by multiplying AWQC (10-S risk) by a dilution factor based on a 100 gpm treatment discharge rate and a Neponset River 7Q10 of 2020 gpm
Compounds presented are only those detected in the untreated groundwater sample
NA = Not analyzed J = Estimated value due to validation criteria
NC = No criteria exists for the compound D = The reported value is from the diluted analysis
U = Undetected at specified detection limit P = Proposed MCL
o n o TABLE 1-19 COMPARISON OF ORGANIC FULL-SCALE TREATABILITY STUDY RESULTS TO MCLS AND DISCHARGE LEVELS - DISCHARGE TO MEADOW BROOK
i 1 liiiisisi i ii iii iii|i|i i l i 11 i |ii^^ i i i i i i i i iiiiiiiiiiiiiiiiii iiiiiiiiiiiiieiciidiiiiii iiiiiiiiiiiiii iiiiiliiiiiii^^iiiiii iiiiiiiiiiiiiiiiiiii iiliiiii i iiiiipiiiliiiiiiiliiii iiiiiiiiiiiiiiiiii iiiii|iii|i|i-iiiiii iiAVQiii|iiiii i ii-iiiiiiigt-iiii ^^
iiiiiiiiiiiiiiii iiiiiiiiiiiiiiiiiiiiiiiiiiiiii iiiiiiiiiiiiiiiiiiiiii I i i i i i i i i||i|i|||iiiiiiiiiiiiiiii|iiii iii-|iiilaquo|i3[i|ii |||^|ii^|i|^|iii i (3 i i ^ ^ l i i illjliii^jiii^ iieip|i(iii|i iiiiiiiiiiiiiiiiiiii i^|iii|(iiiijiii|)|r^ iiii-iiliiiiiiiiiiiii ||i |illlli|i i|li|i|ii iiiiiiiiiiiiiiiiii iiiiiiiiiii|tiiiiiiiiiiiiiiiiiii iiiiiiiiiiiifiiiiiiiiii iiiiiiiiiiiiiiiiilaquoiiiiiii iiiiiiiiiiilliiiiiiiiiiiiiiii i (laquoy^ iiiiiiiiiiiii(Wiiiiiiiii iiiiiiiii i lK^ iiiiiiiiliiiiiiiiiiiiiiiii (ugl)iii iiMiiiiiii VOLATILE ORGANICS
112-Trichloroethane 5 J 25 U 1 u 1 u 1 u 1 u 1 u 5 NC NC 420
1122-Tetrachloroethane 16 J 25 U 1 u 1 u 1 u 1 u 1 u NC NC 2400 110
Chloroform 4 J 25 U 1 u 1 u 1 u I u 1 u NC 28900 1240 157
Vinyl Chloride 10 u 50 U 1 u 1 u 1 u 1 u I u 2 NC NC 5250
11-Dichloroethene 10 u 25 U 1 u 1 u 1 u I u 1 u 7 11600 NC 19
12-Dichlorocthene (total) 200 D 97 1 u I u 1 u 1 u 1 70 11600 NC 1400000
Trichloroethene 860 D 430 1 u 1 u 1 u I u 2 5 45000 21900 920
Tetrachloroethene 5 J 25 U 1 u 1 u 1 u 1 u 1 U 5 5280 840 89
Xylenes (total) 1 J 25 U 1 u 1 u 01 J I u I U 10000 NC NC NC
Chlorobenzene 5 J 25 U 1 u 1 u 1 u 1 u I u NC NC NC NC
SEMIVOLATILE ORGANICS
Pentachlorophenol 25 U ND 25 U 25 U 25 U 25 U 25 U 1 20 13 NC
Chlorobenzenes(total) 250 50 NC
13-Dichlorobcnzene 3 J 2 10 U 10 U 10 u 10 U 10 U 600 NC NC 2600
14-Dichlorobenzene 17 9 10 U 10 U 10 u 10 U 10 U 75 NC NC 2600
12-Dichlorobenzene 7 J 5 10 U 10 U 10 u 10 U 10 U 600 NC NC 17000
124-Trichlorobenzene 2400 D 50 10 u 10 u 10 u 10 u 10 U 9 250 50 NC
PESTICIDESPCBS
Aroclor-1254 36 J 32 01 u 01 u OI u OI u NA 05 20 0014 00045
Heptachlor 0074 J NA NA NA NA NA NA 04 052 00038 00029
Aldrin 017 J NA NA NA NA NA NA NC 3 NC 000079
Heptachlor Epoxide 0045 J NA NA NA NA NA NA 02 NC NC NC
gamma-Chlordane | 0056 J NA NA NA NA NA NA 2 24 00043 00048
Notes
Discharge levels are AWQC (10-5 risk) since the treatment discharge rate of 100 gpm is higher than the flowrate of Meadow Brook
Compounds presented are only those detected in the untreated groundwater sample
NA = Not analyzed J = Estimated value due to validation criteria
NC = No criteria exists for the compound D = The reported value is from the diluted analysis
U = Undetected at specified detection limit P = Proposed MCL
Table 1-17 shows a comparison of effluent to effluent discharge levels based on discharge to c Meadow Brook assuming a dilution factor on one If the treated groundwater was discharged
to Meadow Brook effluent discharge levels for arsenic would be exceeded Since arsenic is
a difficult compound to remove in a groundwater treatment plant it is concluded that
Meadow Brook may not be usable as a discharge point
Table 1-18 presents concentrations of organic contaminants in untreated groundwater from
MW-IA the precipitated and filtered effluent the effluent following both aeration and
carbon and the effluent from carbon adsorption only These values are compared to MCLs
and effluent discharge levels Only one carbon dose for the carbon only study the lowest
dose of 05 g carbon1000 ml groundwater is shown as a conservative example In both
cases using aeration and carbon and carbon alone organic contaminants were removed to
below MCLs and to below discharge levels Therefore aeration at an air-to-water ratio of
251 and a carbon dose of 05 g carbon1000 ml groundwater effectively removed volatile
organics semivolatile organics and PCBs from the groundwater
c It is expected that a maximum air-to-water ratio at 251 will be effective for an air stripper
onsite because full-scale air strippers are many times more efficient than the bench scale
models This is due to the greater surface area and turbulence found in the stripper The
off-gas from the air stripper will have to be treated to meet applicable standards either by a
catalytic oxidation unit or a vapor phase carbon adsorption system
Since no vinyl chloride was present in MW-IA and vinyl chloride is a difficult compound to
remove with carbon adsorption tests were performed with groundwater from ME-8 which
contained 210 xg1 vinyl chloride These results were presented in Table 1-13 which shows
that air stripping at an air-to-water ratio of 251 is effective in removing vinyl chloride In
order to reach the MCL of 2 figl for vinyl chloride an air stripper is required Carbon
adsorption alone would not remove vinyl chloride down to the MCL If the treated
groundwater is discharged to the Neponset River instead of being reinjected an air stripper
to remove vinyl chloride is not necessary since the discharge level is 111300 xg1
35 c
Table 1-19 shows a comparison between the organic concentrations in treatability study c effluents and effluent discharge levels based on discharge to Meadow Brook All volatile and
semivolatile organic compounds are removed to the effluent discharge levels It is
impossible to determine if PCBs were effectively removed since the most stringent discharge
level is 0014 xgL and the detection limit in the study is 01 xgL Discharge to Meadow
Brook may not be feasible due to 1) the treatability study cannot prove that PCBs are
removed to effluent discharge levels and 2) arsenic concentrations in the treated effluent
were higher than effluent discharge levels (based on a dilution factor of one)
The preliminary results of the sludge analysis indicate that the sludge is nonhazardous under
RCRA and TSCA Once the fiill scale groundwater treatment system is on line samples of
the sludge should be reanalyzed to confirm the preliminary results and to further assess the
disposal options
In summary the results of the treatability study indicate that groimdwater from the Norwood
PCB site can be treated effectively to allow discharge to either the Neponset River or r gtlaquo^ reinjection back into the aquifer If treated groundwater is reinjected the treatment plant
must include an air stripper to remove vinyl chloride If treated groundwater is discharged
to the Neponset River an air stripper is not necessary to meet discharge levels however the
use of Best Available Technology (BAT) may be required which would necessitate the
inclusion of an air stripper A cost comparison between an air stripper combined with
liquid-phase carbon versus liquid-phase carbon alone was performed and reported in the
Modeling Report The conclusion was there is not a significant difference in cost the
present worth assuming a discount factor of 8 and a 16-year period of perfonnance was
135 vs 102 million dollars (see Volume 2 Section 3) These costs will be evaluated
further during the design phase of the project The efficiracy at the full scale plant can be
optimized to ensure that at no time will the effluent from the plant exceed any applicable
groundwater or surface water standard
36 C
Section Two
c
c
20 ROCKS
21 Introduction and Objectives
There are several sources of rocks potentially contaminated with PCBs present on the Grant
Gear property portion of the Norwood PCB site Three different sources of rocks were
collected for analysis from the Grant Gear property The three rock sources included
overburden rocks from a trench west of the Grant Gear facility and below the interim
remedial cap crushed stone from the interim remedial cap west of the Grant Gear facility
and pea stone from the upper and lower roofs of the Grant Gear facility Throughout this
section rocks collected from on top of the interim remedial cap will be referred to as cap
rocks and overburden rocks wUl be referred to as trench rocks The rock collected from the
roof were analyzed under Work Plan 1 and are discussed in the Building Investigation
Report
The objective of this portion of the predesign work was threefold
bull To determine the PCB contamination if any on the different sources of rocks
bull To assess the feasibility of dry tumbling as a remedial altemative for the rocks
bull To assess the feasibility of water washing as a remedial altemative for the rocks
The dry tumblingwater washing was conducted on rocks that were reported to be too large
to be remediated with overburden soils by the solvent extraction technique
22 Description of Work
Samples of the three sources of rocks were collected by Metcalf amp Eddy personnel on
January 8-10 1992 Refer to Figure 1-1 for the locations of the trench and the cap rock
37 c
sampling points The samples were delivered to ENSECO laboratory in Cambridge
c Massachusetts and stored in a refrigerator at 4degC prior to sample preparation and analysis
Metcalf amp Eddy performed the sample preparation portion of the PCB analysis Rock
samples were weighed and gently placed in precleaned two liter glass beakers A quality
control surrogate compound was then added to each sample or method blank for subsequent
percent recovery determination The rocks were then immersed in extraction solvent
consisting of 30 percent acetone and 70 percent hexane by volume iEach sample and blank
was heated to 50degC and intermittently swirled by hand for a thirty minute extraction time
The extracts were then dried using sodium sulfate concentrated to 10 milliliters final volume
and submitted to ENSECO for PCB analysis using EPA SW846 Method 8080
The trench rocks were divided into three size categories with average diameters of one inch
two inches and three inches The rock size is an important consideration for the solvent
extraction remediation technique
^s^^ The three trench rock sizes and six cap rock samples were analyzed initially to determine the
extent of PCB contamination As outlined in the Quality Assurance Project Plan a second
portion of the cap rock sample with the highest initial PCB concentration was subjected to
water washing remediation and analyzed for PCBs Separate portions of the trench rock
samples were subjected to dry tumbling for ten and thirty minute intervals and water washing
for ten and thirty minute intervals The remediated rocks were then analyzed for PCBs
The dry tumbling and water washing were performed using an electronic rotary device The
rock samples were placed in clean two liter plastic sampling containers with screw cap
closures Laboratory distilled deionized water was poured into the water wash test
containers while the dry tumble samples had only the rocks enclosed
38 c
c 23 RESULTS
The one-inch average diameter trench rocks were initially contaminated with 1800 mgkg of
Aroclor 1254 Because the one-inch trench rocks were above the 10 mgkg cleanup standard
sample portions of the rocks were processed step by step through each of the four
remediations Although an eighty five percent reduction in PCB contamination was achieved
between the initial and final remediation samples the final concentration of 270 mgkg is still
well above the cleanup standard The results however showed a trend with the highest
concentration of PCBs detected on the initial sample lower PCB concentrations with the
ten-minute remediation and the lowest PCB concentrations achieved with the longest
thirty-minute remediation as expected The results for the one-inch trench rocks are
presented in Table 2-1
The two-inch average diameter rocks showed results similar to those of the one inch size
The initial sample had a concentration of 2500 mgkg of Aroclor 1254 The best
remediation result obtained was 450 mgkg for the ten-minute water wash sample A thirty c minute water wash sample for the two-inch trench rocks was not conducted when it became
apparent that a 10 mgkg cleanup level could not be obtained Because the 10 mgkg cleanup
level was not achievable the thirty minute water washing of two-inch rocks was not
conducted to minimize the level of effort and analytical costs The PCB result for the
thirty-minute dry screened sample 1900 mgkg Aroclor 1254 was higher than expected
This result was counter to the trend that was expected and observed with the one-inch rocks
and it demonstrates the non-homogenous nature of the rock samples This trend breaking
analytical result caused by the heterogenous or nonuniform nature of the rock sample matrix
was not repeated because the cleanup level could not be achieved The results for the
two-inch trench rock samples are presented in Table 2-1
The three-inch average diameter trench rocks yielded markedly different analytical results
The initial sample prepared with minimal on- site screening had a PCB concentration of
75 mgkg below the cleanup standard of 10 mgkg Although the initial result was below
39 c
TABLE 2-1 TRENCH ROCK WASHING RESULTS
Trench Rocks 1 inch Average Diameter
PCB Concentration
Sample mgKg
Initial sample 1800
Ten minute dry screened 620
Ten minute water wash 880
Thirty minute dry screened 290
Thirty minute water wash 270
Trench Rocks 2 inch Average Diameter
PCB Concentration
Sample mgKg
Initial sample 2500
Ten minute dry screened 490
Ten minute water wash 450
Thirty minute dry screened 1900
Trench Rocks 3 inch Average Diameter
PCB Concentration Sample mgKg
Initial sample 750
Ten min dry screened 210
Ten min water wash 025 UJ
Aroclor 1254 was the only PCB detected UJ - The sample was nondetect for PCBs to the estimated detection limit
of 025 mgKg
40
the cleanup standard it was close enough to warrant the first ten minute dry tumble c remediation step The first remediation step with a PCB concentration of 21 mgkg
confirmed that the three-inch trench rocks are less contaminated than their smaller
counterparts The three-inch ten-minute water washed sample was not submitted for fiill
quality control PCB analysis in an effort to minimize analytical costs The ten-minute water
washed sample result is from a partial quality control PCB screening analysis and is reported
as estimated Because of the lag time in tumaround of analytical results this sample had
been prepared extracted and screened and the information was available therefore it is
presented herein The results for the three inch average diameter rocks are presented in
Table 2-1
Six samples of cap rocks were collected and analyzed for PCBs AU of the results were less
than 02 mgkg or 200 xgkg For these cap rock samples an action level of 50 xgkg was
established in the Quality Assurance Project Plan The 50 xgkg value is an action level
established by EPA for this study only and is not a cleanup level identified in the ROD The
action if the results exceeded 50 igkg was to water wash the most highly PCB contaminated c sample Water washing was performed on cap rock sample number two The initial result
for this sample was 150 xgkg while the ten minute water washed sample yielded 24 igkg
Aroclor 1254 The cap rock results showed fairly consistent PCB concentrations in the range
of 50 to 150 igkg Aroclor 1254 The results are presented in Table 2-2
24 CONCLUSIONS
The cap rock samples were all determined to have PCB concentrations approximately one
hundred times less than the cleanup level of 10 mgkg Water washing conducted on the
most contaminated cap rock sample removed approximately eighty five percent of the PCBs
initially present These cap rock samples contained some fine soil like material which was
perhaps windblown carried on tmck tires or created by friction This material contributed
to the measured PCB concentrations for the cap rock samples
41 c
c TABLE 2-2 INTERIM REMEDIAL CAP ROCKS ANALYTICAL RESULTS
LOCAiSifi iiiiiiiiiiiiiii--iiiiiiiiiiiiiiiiiiiiidiiiiiiliiiiiiiii^ 10 minute Water Wash iiiii|ijii|iiii|iii^ PCB Concentration (ligKg)
1 120 NA
2 150 24
3 110 NA
4 31 U NA
5 86 NA
6 71 NA
Notes Aroclor 1254 was the only PCB detected U - Sample was nondetect for PCBs to the reported
detection limit - The highest initial PCB concentration cap rock sample was
subjected to a ten minute water wash remediation
42
C
The results of the rock tumbling and water washing demonstrate that this form of remediation r will not achieve the cleanup level of 10 mgkg for the one-inch and two-inch average
diameter overburden rocks The three inch rocks are below the cleanup level without
remediation It should be noted that these overburden rock samples were coUected from one
of the most highly contaminated areas at the site based on the remedial investigation results
These samples therefore represent worst case conditions
The dry tumbling remediation steps did not remove aU of the adhered soU particles as
anticipated This adhered highly PCB contaminated soU contributed to the measured rock
surface PCB concentration because the PCBs were extracted from the soU as weU as the rock
surface during sample preparation
The water wash remediation was effective in removing aU of the adhered soU The results
indicate that the rock surface and near surfaces have been contaminated with PCBs which
cannot be removed by water washing but are extractable with acetonehexane
c During the trench rock coUection ample one-inch and two-inch average diameter rocks were
avaUable at shaUow depths The trench had to be dug deeper to obtain the three inch size
rocks Because of the relative immobiUty of PCBs in soU the PCB concentration decreases
with depth as reported in the remedial investigation This decrease in PCB concentration
with depth is part of the explanation as to why the three inch rocks showed less
contamination than the smaUer sizes Also a factor is the surface area to mass ratio As the
mass of the rock increases the surface area to mass ratio decreases Since the PCBs are on
the surface or near surface of the rocks as the relative surface area decreases with size or
mass the reported concentration wiU decrease correspondingly
During the trench excavation and overburden rock coUection a two- to three-inch lens of
dark oUy appearing materials was observed This material was analyzed with a PCB field
screening kit and found to contain in excess of 10000 mgkg PCBs Some of the one and
two-inch diameter rocks sampled appeared dark in color Because it was not known whether
43 c
c
the dark rocks were naturaUy colored or from the tarry lens and to keep the study unbiased
these dark rocks were sampled randomly with the remaining rocks The dark appearing
rocks were estimated to comprise approximately five percent of the one and two-inch rock
sizes Inclusion of highly contaminated rocks in the samples would boost the reported PCB
concentrations
Altemative remedial measures other than rock tumbUng and water washing include detergent
and water washing organic solvent washing or steam cleaning Although preUminary
indications from the solvent extraction vendors are that only up to one inch size rocks can be
handled the possibiUty of designing a treatment system to handle larger rocks wiU be
explored during the design phase of this project If the size of the rocks precludes them
from remediation by solvent extraction along with contaminated soUds a rock cmsher wiU be
employed to reduce the contaminated rocks to a size that can be handled Although other
altematives for rock remediation might work solvent extraction with contaminated soUs or
rock cmshing foUowed by solvent extraction appear to be the easiest most cost effective
means to achieve the cleanup standards Whichever remedial altemative is selected rock
washing would only be necessary on rocks with average diameters between one and two
inches coUected from soU highly contaminated with PCBs A very rough estimate of rocks
onsite between one- and two-inch diameters is approximately 5000 tons No remediation of
the rocks is necessary if the solvent extraction technology can handle two-inch size rocks
44 c
c
c
TABLE 1-4 TREATABILITY STUDY SAMPLING AND ANALYSIS SUMMARY
Number Bench Scale Process
Groundwater Treatability Study
Initial Groundwater
Preliminary Polymer Testing
Precipitation Supemant
FUtration Effluent
Metals Sludge Precipitated and FUtered Effluent with Groundwater CoUected with BaUer
Air Stripping Effluent
Air Stripped Carbon Adsorption Effluent
Non Air Stripped Carbon Effluent
Sludge Sample
Rock Washing Study
Initial Rocks Initial Gravel from roof Stone from Cap Washed Rocks Washed Stones
system for volatUes semivolatUes PCBs and metals AU interim samples were analyzed at
ENSECO in Cambridge Massachusetts AU data was vaUdated by MampE according to the
QAPP
1221 Groundwater Sample CoUection Groundwater for this study was coUected from
weUs MW-IA and ME-8 as shown on Figure 1-2 iMW-lA was chosen as a sampling
location because it was determined to be one of the most contaminated weUs on-site based
on previous investigations During the course of the treatabiUty study a decision was made
to obtain samples from ME-8 because results of the most recent sampling effort conducted by
ICF indicated that groundwater from this weU contained approximately 200 xgL vinyl
chloride whereas groundwater from MW-IA no longer contained any quantifiable amount
Removal of vinyl chloride by aeration needed to be demonstrated during this investigation
because vinyl chloride is not effectively removed by carbon adsorption
Groundwater samples were obtained on four separate occasions during the study as shown in
Table 1-5 On each occasion the groundwater was coUected in accordance with the Field
Sampling Plan Three weU volumes of water were purged from the weU using a centrifiigal
pump before any samples were coUected The pH temperature and conductivity of the
purge water was measured after each weU volume untU the measured values differed by less
than 10 for three consecutive samples to ensure the sample drawn was representative of the
water in the aquifer Samples for the metals precipitation and filtration study were coUected
using a centrifugal pump Samples for the air stripping and carbon adsorption study were
coUected with a teflon baUer to minimize aeration and possible loss of volatUes during
sample coUection
The samples were coUected in one gallon amber glass bottles and stored at 4degC Each
sample bottle wasfiUed to exclude a headspace in the bottle
e 10
200 200
SCALE IN FEET
D CAP ROCK SAMPLE LOCATION
bull WELLS
nOURE 1-2 GROUNDWATER AND TRENCH AND CAP
ROCK SAMPLING LOCATIONS
11
E T C A L F a EDDY
c TABLE 1-5 GROUNDWATER SAMPLING SUMMARY
Mode of Date WeU Amount Sampled pH Temp degC Conductivity SampUng
11392 MW-IA 10 gallons 62 8deg 220 umhocm pump
12792 MW-IA 16 gaUons 62 8deg 220 umhocm baUer
20392 MW-IA 16 gallons 62 8deg 220 umhocm baUer
20592 ME-8 2 gallons 64 8deg 230 umhocm baUer
1222 Precipitation Testing
General Chemical precipitation for the removal of metals was evaluated at three pH values
and three polymer dosages to determine the effectiveness of the treatment A preliminary
evaluation of different coagulants and polymers was conducted at three pH values by
r Metcalf amp Eddy personnel and a leading polymer vendor to determine which chemicals could
potentiaUy be used to precipitate groundwater Based on the results from the preliminary
evaluation jar tests were conducted by Metcalf amp Eddy personnel to aid in the determination
of the chemical dosages required to optimize the effectiveness of precipitation
Polymer and Coagulent Testing Polymer testing was performed by Metcalf amp Eddy and a
leading polymer vendor at the ENSECO laboratory faciUty in Cambridge Massachusetts
The effectiveness of anionic cationic and nonioiuc polymer was evaluated at three pH
values The best polymer was determined to be Drewfloc 2270 a low charge anionic high
molecular weight polymer This polymer was used in jar tests 1 through 5 The best
coagulent was determined to be Charge Pack 12 (CP-12) a higher charge cationic low
molecular weight coagulent The CP-12 coagulent was used in jar tests 1 through 5
described under jar testing
12 c
InitiaUy the effects of varying the pH of the groundwater sample was investigated Tests c were conducted at pH values of 80 90 and 100 with sodium hydroxide which had the best
settling characteristics based on visual observation and turbidity measurement Each polymer
was then tested at pH = 100 to evaluate Us effectiveness under optimum pH conditions
A formula of polymer and coagulant addition was developed based on visual observations
suspended soUds and turbidity analyses performed on each sample generated during the
investigation The anionic polymer effectively flocculated the existing smaU suspended
particles and the addkion of cationic coagulant removed iron and color when the pH was
raised to 100
Jar Testing Five jar tests were performed using the polymer and coagulants determined to
be effective during preliminary testing Jar tests 1 and 4 were conducted as dupUcates at
ph 10 Jar test 2 was conducted at pH 9 jar test 3 was conducted at pH 8 and jar test 5 was
conducted at pH 10 On each occasion prior to beginning the jar test the raw groundwater
was brought tol5deg-17degCina warm water bath The temperature was held constant to c eliminate the effects of temperature on reaction rates and solubUity
The foUowing is a description of activities conducted during the jar tests fti through 4 See
Figure 1-1 for details Four samples were evaluated during each jar test For each jar test
four 15 Uter beakers were fiUed with 1 Uter of raw groundwater The beakers were placed
on the stirrer platform and the paddles were lowered into the sample The jar stirrer was
operated at 80 revolutions per minute (rpm) The pH was then adjusted to the desired value
(pH = 10 9 8 10 for Tests 1 2 3 4) with a lime slurry in two samples and with a
sodium hydroxide solution (25) in the remaining two samples Lime was added to
investigate its effects on the precipitate and to evaluate its effectiveness in pH adjustment
The cationic coagulant was then added to each sample untU the concentration in solution was
30 mgL The solution was stirred at 80 rpm for 2 minutes to ensure complete mixing The
polymer was then added to one sample pH adjusted with sodium hydroxide and one sample
pH adjusted with lime Mixing continued for two minutes Next the solution was stirred
13 c
slowly orflocculated for five minutes at 20 rpm FinaUy the solutions were aUowed to
c settle for 10 minutes Visual observations were recorded and samples were submitted for
suspended soUds turbidity and metals analyses
Jar test 5 was performed to assess the removal of manganese and aluminum by preaeration
and permanganate additions (see Figure 1-1) Because no significant benefit was observed in
the previous tests when lime was used instead of sodium hydroxide sodium hydroxide was
used to adjust the pH in aU four samples to a pH of 100 in jar test 5 Only sodium
hydroxide was added to the groundwater in the first jar to determine the removal of
manganese and aluminum attributable to the formation of an insoluble salt at high pH
Sodium hydroxide and polymer were added to the second jar to evaluate the effectiveness of
the polymer Sodium hydroxide polymer and coagulant were added to sample 4 The
supemate from sample 4 was then fUtered This was performed to determine if the required
removal efficiencies could be achieved by chemical precipitation and filtration
Permanganate was added to sample 3 in addition to sodium hydroxide coagulant and
polymer to determine if the manganese and aluminum present could be chemicaUy oxidized c to a less soluble state which would enhance the efficiency of fUtration The supemate was
then siphoned off using clean tygon tubing and a syringe into the sample containers
Samples were submitted for metals suspended soUds and turbidity as illustrated on
Figure 1-1
1223 Filtration Testing A bench-scale filtration study was perfonned to determine the
optimum pore size of filter media that could effectively remove the suspended soUds in the
precipitated groundwater The determination of the removal efficiency for each filter was
based on the concentration of suspended soUds and turbidity of the filtered water The time
required to filter the groundwater was also evaluated
Prior to filtration the metals in the groundwater were precipitated and coagulent and polymer
were added using the optimum conditions developed during the precipitation study The
optimum conditions consisted of pH adjustment to 10 with sodium hydroxide addition of
14 c
coagulent CP-12 to a concentration of one percent and addition of Drewfloc 2270 polymer to
c a concentration of 10 mgl Three grades (10 xm 5 xm and 1 xm pore sizes) of filter
paper were used with a Buchner ftmnel to filter aUquots of the precipitated groundwater
Samples of the filtered water were submitted to ENSECO for suspended soUds and turbidity
analysis
A sample of the metal hydroxide sludge was coUected during the treatability study The
sludge sample was submitted to the CLP system for PCB and metals analysis so that a
characterization of the sludge could be made and disposal options could be evaluated
1224 Air Stripping Testing Precipitated fUtered groundwater was aerated at three
different air to water ratios to determine the most effective stripping ratio To ensure that
worst case volatUe organic compound concentrations were present in the samples for this
study some modifications were made in how the sample was coUected and treated First
the groundwater was coUected with a baUer to prevent the loss of volatUes AdditionaUy the
water was fUtered under positive pressure foUowing the precipitation step to minimize the c loss of volatUes that would result if the water was filtered using a vacuum pump
An aquarium pump tygon tubing and aeration stone with a glass-fiber fUter cartridge was
used to aerate 1-Uter aUquots of precipitated and filtered groundwater The aeration flow
rate was caUbrated by filling a graduated cylinder with air that had been filled with tap water
and inverted in a water bath The air was diffused at 375 missec into 1-Uter aUquots of
groundwater and the time measured as iUustrated in Table 1-6 The aerated groundwater was
submitted to ENSECO for volatUe organics analysis
1225 Carbon Adsorption Testing The effectiveness of activated carbon for the removal
of organic compounds in the groundwater at the site was evaluated The carbon used was
the powdered activated 325 mesh carbon suppUed by Calgon Corporation The groundwater
samples used for this investigation were obtained and filtered as described in the air stripping
15 c
c
c
TABLE 1-6 AERATION TEST OPERATIONS
Air to Water Ratio Volume Volume of by Volume of Water Air Reqd Min of Aeration
251 1000 ml 25000 ml 111 501 1000 ml 50000 ml 222 751 1000 ml 75000 ml 333
section of this report to minimize the loss of volatUes A total of twelve samples were mn
during this investigation The necessity of air stripping was investigated by comparing the
resuUs from four samples that were air stripped to seven samples that were treated identicaUy
with the exception of air stripping AU samples for the air stripping comparison went
through the precipitation filtration and carbon adsorption processes AdditionaUy one
sample was prepared with no carbon added to serve as an untreated sample The samples are
summarized in Table 1-7 Each groundwater sample was prepared and mixed with a
predetermined dose of Calgon powdered 325 mesh activated carbon and placed m an open
Erlenmyer flask on a shaker table for a two-hour time period at 180 rpm A rotary shaker
table capable of accommodating twelve (12)-1000 ml Erlenmyer flasks was used Effluent
was fUtered with a barrel filter using a glass-fiber pre-fUter and a Whatman 45 micron
membrane The effluent clear and odorless in aU cases was added to sample containers
preserved and packed for shipment to CLP laboratories Since the shaker table could
accommodate 12 flasks a total of approximately 4 gaUons of effluent was generated during
each mn Several mns were performed to generate adequate quantities of sample for
analysis accordmg to Table 1-7 Groundwater was simUarly prepared for submittal to
Aquatec Lab in Burlington Vermont for chronic toxicity testing Three (3) shipments of
approximately 2 gaUons each were made
r 16
C) o o TABLE 1-7 CLP TREATABILITY STUDY SAMPLING SUMMARY
Dose g of Carbon Required of mis in gs Carbon
Sample ID 1000 ml of GW Analysis Volume mis Flasks Flasks in each
Precipitation Filtration Aeration amp Carbon
AC-1 05 V SV MET 3400 3 1067 054 AC-2 20 V SV PCB 4400 4 1100 22 AC-3 50 V SV MET 3400 3 1133 57 AC-4 100 V SV PCB 4400 4 1100 110 AC-5 Trip Blank 0 V
Precipitation Filtration amp Carbon
C-0 0 V 500 1 500 0
C-1 05 V SV MET 3200 3 1067 053
c-2 10 V PCB 2200 2 1100 11
C-3 20 V SV CT 29000 24 1250 25
C-4 50 V SV PCB 4400 4 1100 55
C-17 70 V MET 1200 1 1200 70
C-18 100 V SV 2200 2 1100 110
C-13 Treatability Blank 0 V PCB 2200 0 0 0
C-20 Trip Blank 0 V 0
C-10 Duplicate of C-1 05 SV 2000 2 1000 05
C-1 05 (MSMSD) 500 1 500 025
C-11 Duplicate of C-1 05 MET 1000 1 1000 05
C-20 Duplicate of C-2 10 V PCB (MSMSD)
4400 4 1100 11
C-16 Duplicate of C-4 50 PCB 2000 2 1000 50
C-6 0 PCB 2000 2 1000 0
17
o o n TABLE 1-7 (Continued) CLP TREATABILITY STUDY SAMPLING SUMMARY
Dose g of Carbon Required of mis in gs Carbon
Sample ID 1000 ml of GW Analysis Volume mis Flasks Flasks in each
Precipitation amp Filtration
PPF-1 V SV MET PCB 2000 2 1000 0
Sludge
Sludge-1 0 MET PCB 0
V = VolatUe organics SV = Semivolatile organics MET = Metals PCB = Polychlorinated biphenyls CT = Chronic toxicity MSMSD = Matrix spikematrix spike dup D = DupUcate TB = Trip blank PPF = Precipitated and pressure filtered
(to minimize volatUes loss as opposed to vacuum filtration)
18
c
c
123 Results
1231 Precipitation Testing
Polymer Testing Preliminary polymer and coagulant testing was conducted to determine
the type of polymer and coagulant that could be employed to treat groundwater from the site
The Drewfloc polymer and the Drew CP-12 cationic coagulant were chosen as the most
effective types InitiaUy the effect of varying the pH of the groundwater sample was
investigated The resuUs of tests conducted at pH values of 80 90 and 100 are presented
on Table 1-8 As the pH value was raised the quaUty of the floe improved The sample
raised to a pH level of 100 with sodium hydroxide exhibited the best settling characteristics
based on the color turbidity soUds and the quaUty of the floe
The effects of varying the polymer dose was then investigated at pH=100 The cationic
coagulant added to a concentration of 30 ppm after pH adjustment and prior to polymer
addition produced the clearest supemate based on color turbidity and suspended soUds
results Table 1-8 also summarizes the results from this investigation
Jar Testing Four jar tests were performed to evaluate the effectiveness of chemical
precipitation for the removal of metals in groundwater from weU MW-IA The analytical
results from the jar test are presented in Table 1-9 The greatest metal reductions occurred
when the pH was 100 Samples for which the pH was adjusted with lime showed better
removal of barium manganese and sodium concentrations than those samples for which the
pH was adjusted with sodium hydroxide Samples for which the pH was adjusted with
sodium hydroxide showed greater declines in the concentrations of calcium and magnesium
No significant effect was observed on the removal of cobalt iron lead aluminum potassium
and zinc when lime or sodium hydroxide was used to raise the pH The observation that
samples for which the pH was adjusted with sodium hydroxide had elevated concentrations of
19 c
c TABLE 1-8 PRELIMINARY POLYMER TESTING RESULTS
Description of Supemate
Procedure pH ColorSoUds
mgl Turbidity
NTU Floe SettleabUity
Varymg pH
Raw Groundwater pH adjustedNaOH pH adjustedNaOH pH adjustedNaOH
62 80 90 100
YeUowbrownYeUowbrownYeUowbrownYeUowbrown
450 gt50 gt gt 5 0 gt gt50
58 SUght mst pin floe medium
gt medium
None Slow Faster Fastest
Varying polymer dose pH adjustment wNaOH
pH adjustedno polymer
100 YeUowbrown gt gt50 gt medium Fast
Above wpolymerat 1 ppm
100 Light yeUow lt 10 35 large 18 Fast
c Polymer at 5 ppm 100
Polymer at 1 ppm 100 wcoag 30 ppm
Light yeUow
Very Ught
lt 10
lt 10 yeUow
32
30
Large 18
Targe 18
Fast
Fast
n 20
o o n TABLE 1-9 F U L L - S C A L E TREATABILITY STUDY JAR T E S T R E S U L T S
Results in mgL
SAMPLE ID iiiiiiiiiiiiiiiiiiiiMW JAiSiiii iiiJTililiiiiiiiiiiii iiiJTil^iiiiiii iiiiiiiiiiTIi3iiiiiiiii iiiii^ii^li^iiiiiiiiiiiiii^iiri^iiiiisiiiiiiiiiiiiimii iiiiiJT4^iiiiiiiiiiiiiinP4i4iiiiiiiiiii iiiiiJT2iiliiiiiiiiiiiiT2^iiiiiii |i|S^ iiiiiiiiiiiiiiiiiiiiiiiiiiiiilM ii iiiiiiiiiiiiiiiiiiiiJlt iiiiiiiiii iiiiiiiiii-iiiiiiii iiiiiiiii=iiiiiiiiiiiiiliiiiii iiiiiiiiiiiiiiiiiiiiiiliiiiiiiiiiiiiiiiiiiiiiiiiiliiiiiiiiiiiiiM ii^iiiiiiiiiiiii6iiiiiiiiiiiiiiiiiiijqiiiiii mmsectlsectMimamp0^
Zinc 0488 002 U 002 U 002 U 002 U 002 U 002 U 002 U 002 U 002 U 002 U
E S A M P L E ID iiiiiiiiiiiiiiiiiiiiJT2i3iiiiiiiiiiiiiiiii ^T2-4iiiiiiiii iiiiiiiiJ^alliiiiiiiiiiiii iii^Ta^iiiiiiiiiiii iiiiiiiiit3|3iiiiiiiiiiiii iiilT3Tr4iiiiiiiiiiiiiii rrs-i iiiiiiiiiiiiiiJTSl iiiiiiiiiiiiiii iiiiiitJiJiiiiiiiiiii iiiiiiWs-4iiiiiiiiiiiii iiiiiiiJT5r-5ii|iiiiiiii
iiiiiiiiliiiiiiiiiiiiiiiiiBSsiii iiiiiiiiiiiiiiiiiiiiiilgtHiiiiiiiiiiii iiiiiiNaOHiiiiiiii iiiiiiiiiiii)iliimiiiiiiiii iiiiiiiiSiiriiiisiiiiiiiiii iiiiiiiiNiliiiiiiiiii iiiii iNapHiiiiiiiiiiiii iiiiiiiiiiiiiiiifloiiiiiiiii iiii^iiiiiiiiiii iiiiiiii NiitQHiiiiiiiii iiiiiiiiiWftOHiiiiiiii wmm iii^iiiiiiiisiiiiiiiAli|ilii iiiiiiiiiiixiiiiiEal3i iltgtoi PolyCoag C o a g u l a n t PolyCoag Coagulant iiiiiiii iiiiiii iiiiiii)|sihyii^iiiiiiii PolyCoag PolyCoag iiiPoij^iii^il ANALYTES Aerated KMn04
Barium 0073 0072 010 010 010 010 NA NA NA NA NA Calcium 247 247 571 574 273 277 NA NA NA NA NA Cobalt 001 U 001 U 0017 0018 0017 0019 NA NA NA NA NA Iron 01 U Ol U 016 023 016 043 NA NA NA NA NA Lead 0005 U 0005 U 0005 U 0005 U 0005 U 0005 U NA NA NA NA NA Magnesium 44 44 50 51 50 50 NA NA NA NA NA Manganese 35 33 43 43 44 44 063 086 099 094 14 Potassium 5 U 5 U 5 U 5 U 5 U 5 U NA NA NA NA NA Sodium 423 477 170 169 502 508 NA NA NA NA NA Zinc 002 U 002 U 0082 011 015 016 NA NA NA NA NA
Notes Only metals detected in untreated groundwater from MWIA are presented NA = Not Analyzed
U = undetected at specified detection limit JTI = Jar Test 1
c
c
sodium in the treated water was expected This is because sodium is a component of sodium
hydroxide Similarly the elevated concentrations of calcium observed in samples for
whichthe pH was adjusted wUh lime are due to the calcium component in lime Jar test 5
was conducted to assess the effect that precipitation and chemical oxidation had on the
removal of manganese and aluminum The results of this investigation are also presented in
Table 1-9 The results indicate that greater reductions of aluminum and manganese cannot
be achieved with aeration or by the addition of a chemical oxidant such as permanganate
A sample of the metal hydroxide sludge a residual that wiU be generated during the
groundwater treatment was analyzed for metals and PCBs This sample of sludge was
generated by treating contaminated groundwater with precipitation and filtration using the
optimum treatment parameters The metals results indicate that the sludge would not be
considered hazardous under RCRA using the toxicity characteristic leaching procedure
(TCLP) A TCLP was not performed on the sludge however based on 1) the concentration
of the metals in the sludge 2) assuming a 100 leachability and 3) incoiporating a 20-fold
dUution for a soUd matrix analyzed by TCLP this sludge would not be considered hazardous
under RCRA The PCB analysis of the sludge showed that Aroclor 1254 was the only
detected PCB at a concentration of 31 mgkg The TSCA limit for PCBs in waste is
50 mgkg indicating that this sludge would not be hazardous under TSCA The results for
this sludge represent a preliminary characterization and once the fuU scale treatment system
is on line the sludge analysis wiU need further testing to confirm these preliminary results
and to make a further assessment of the disposal options The analytical resuUs for the
sludge are presented in Table 1-10
1232 FUtration Testing A bench-scale filtration study was performed to determine the
optimum particle retention grade or mesh of filter media that could effectively remove the
suspended soUds in the precipitated groundwater The results of the analysis on the fUtrate
are presented in Table 1-11
n 22
c
c
TABLE 1-10 PRECIPITATED METAL HYDROXIDE SLUDGE RESULTS Results in mgkg
i||ipiiiii|iiiiiiiiiiiiiiiii^^iiiili|ii^^^ TCLP or TSCA L i n i l t s i Tfesi-iiiiiiiiiiiiiiisiiiiii^iiiiiiSvHiij^ in Solid Matrices ii iiiiS WM3KT2S
METALS
Aluminum Antimony Arsemc Barium Beryllium
Cadmium Calcium Chromium Cobalt Copper Iron Lead Magnesium Manganese Mercury Nickel Selenium Silver Sodium Thallium Vanadium Zinc
PCBs
Aroclor 1254
41100 231 195 346 5767
9120 338
25 114
39000 694 5260 2730
03313
04
8960 08
561446
31
U U
U
J
U U U R
U U J
J
NC NC 100
2000 NC 20
NC 100 NC NC NC 100 NC NC
4 NC 20
100 NC NC NC NC
50
Notes = TCLP Limits incorporated a 1 to 20 dilution factor for solid matrices Aroclor 1254 was the only PCB detected The remaining six Aroclors
were nondetect at a quantitation limit of 36 mgkg NC = No criteria exists for this compound U = Undetected at speciiied detection limit
L J = Estimated value due to validation criteria R = The result is rejected
23
c
c
TABLE 1-11 FILTRATION STUDY RESULTS
Media Rating Speed Suspended SoUds Turbidity
Raw 45 mgl 578 Course 10 um 200 mls5 sec lt5 mgl 16 NTU Medium 5 um 200 mls7 sec lt5 mgl 19 NTU Fine 1 um 200 mls23 sec lt5 mgl 18 NTU
Since there was virtuaUy no difference in the quaUty of effluents but substantial increase in
time to filter with the fine filter paper the medium 5 micron paper was chosen to prepare
sample for ftirther study
1233 Air Stripping Precipitated fUtered groundwater was aerated at 3 different air to
water ratios to evaluate the effectiveness of air stripping for the removal of volatUe organic
compounds in the groundwater Tables 1-12 and 1-13 shows the analytical results for
groundwater samples obtained from weUs MW-IA and ME-8 respectively No volatUe
organic compounds were detected in samples that were aerated at a 501 air to water ratio
Aeration of precipitated filtered groundwater obtained from weU ME-8 removed aU of the
vinyl chloride at an air to water ratio of 251
1234 Carbon Adsorption The effectiveness of carbon adsorption for the removal of
organic compounds in the groundwater was evaluated The analytical results are presented in
Table 1-14 At the lowest carbon dosage only 1 xg1 of cis-12-dichloroethene and
2 xg1 of trichloroethene remained No site-related volatUe organic compounds were detected
in samples which were treated with higher doses of carbon Toluene and
dibromochloromethane were detected in sample C-4 however these two compounds were
not detected in the raw groundwater and must therefore be a result of lab contamination
24 c
c TABLE 1-12 FULL SCALE TREATABILITY STUDY AIR STRIPPING RESULTS IN ugL FOR WELL MWIA
Methylene Chloride 10 u 4 U 5 U 5 U 4 U 4 U 2 U 4 U
cis-12-Dichloroethene 200 D 1 U 1 06 J 06 J 1 U 1 U 1 U
Chloroform 4 J 1 U 1 U 1 U 1 U 12 J 1 U 1 U
12-Dichloroethane 10 U 2 1 u 1 U 1 U 1 U 1 U 03 J
Carbon Tetrachloride 10 u 1 U 1 u 1 U 1 U 1 U 1 U 01 J
Trichloroethene 860 D 1 U 2 06 J 06 J 02 J 1 U 1 U
Toluene 10 U 020 J 1 U 1 U 1 U 007 J 25 1 U
Dibromochloromethane 10 U 1 U 1 U 1 U 1 U 1 U 14 1 U
Chlorobenzene 5 J 1 U 1 U 1 U 1 U 1 U 1 U 1 U
Ethylbenzene 10 U 1 U 1 U 1 U 1 U 1 U 1 U 1 U
Total Xylenes 1 J 1 U 1 U 1 U I U 1 U 1 U 1 U
Styrene 10 U 1 U 1 u 1 U 1 U 1 U 09 J 1 U
124-Trichloroben2ene 2400 D 4 1 u 1 U 1 U 1 U 1 U 1 U
123-Trichloroben2ene NA 5 1 u 1 U 1 U 1 U 1 U 1 U ^
SEMIVOLATILE ORG ANICS
Diethylphthalate 10 U 2 J 10 u 10 U 10 u Di-n-butylphthalate 10 U 1 J 10 u 10 U 10 u
Bis(2-ethylhexyl)phthal ate 10 U 10 U 10 u 4 J 2 J
Notes
Only volatile and semivolatile organics detected in any sample are included
No PCBs were detected in any effluent sample at a detection limit of 01 ugL influent was 36 J ugL
C-ID = Duplicate of C-1
U = Undetected at specified detection limit
J = Estimated value due to validation criteria
D = Duplicate
NA = Not Analyzed
= Value is for total 12-Dichlorocthene
i| f|iiiiiiiiiiiiiii^ti8ili| WSk
3 U 2 u 8 U
1 U 1 u 1 U
1 U 1 u 1 U
04 J 1 U 1 U
1 U 1 u 1 U
03 J 008 J 1 U
1 U 1 u 1 U
1 U 1 u 1 U
02 J 1 U 1 U
005 J 1 U 1 U
02 J OI J 1 u 1 U 1 U 1 u 1 U 1 U 1 u 1 U 1 U 1 u
10 U
10 u
2 J
27
c
The effectiveness of combining aeration and carbon adsorption to remove organic c contaminants was also investigated These results are also summarized in Table 1-15 No
organic compounds were detected m any of the samples generated during this investigation
124 Conclusions The results of the groundwater treatability study demonstrate that
treatment consisting of precipitation fUtration air stripping with vapor phase controls and
carbon adsorption appear able to meet cleanup levels estabUshed for the site Figure 1-3 is a
schematic representation of the proposed system The ROD stipulates that treated
groundwater wUl be reinjected to the aquifer onsite in this case MCLs are the cleanup
levels An altemative to be evaluated is discharging the treated groundwater to a surface
water body either Meadow Brook or the Neponset River In this case cleanup levels are
estabUshed as effluent discharge levels Effluent discharge levels are calculated by
multiplying the ambient water quaUty criteria (AWQC) values for each compound by a
dUution factor The dUution factor for the Neponset River is based on a 100-gpm treatment
discharge rate and a Neponset River 7010 of 2020 gpm The dUution factor for Meadow
Brook is 1 since the treatment discharge rate is greater than the flow of the brook therefore
effluent discharge levels for Meadow Brook are set at AWQC
Tables 1-16 through 1-19 compare effluent discharge levels for both the Neponset River and
Meadow Brook to carbon adsorption effluent from the groundwater treatability study
Table 1-16 summarizes the concentration of metals in untreated groundwater the metals
concentrations remaining foUowing precipitation and filtration the metals concentration
foUowing aeration and carbon adsorption the metals concentrations foUowing caition
adsorption only the MCLs and the effluent discharge levels based on discharge to the
Neponset River The only metal effluent concentration which exceeds the MCLs is
aluminum the MCL for aluminum however is a secondary MCL which is nonenforceable
No metals concentrations in the effluent exceed any of the effluent discharge levels
n 28
c TABLE 1-15 FULL-SCALE TREATABILITY STUDY AERATION AND CARBON ADSORPTION RESULTS Results in ugL
iiiiii|Mpt-HiiDiiii-iiiiii^iiiiiiiiiiii iii bullbullbull^(6-^1 iiiiii-iiiiiiiii iiiiiiiiii^g-2iiiiiiiiiii|i
l | | | ibyNigtii i i i i | i i i i i i i | ivi
VOLATILE ORGANICS
Mediylene Chloride 6 U 4 U Carbon Tetrachloride 1 U 01 J Toluene 02 J 1 u Total Xylenes 1 U 1 u Acetone 5 U 5 U 2-Butanone 5 U 5 U 2-Hexanone 5 U 5 U 4-Methy 1-2-pentanone 5 U 5 U Carbon Disulfide 1 U 1 U
c Notes Only volatile organics detected in any sample are included U = undetected at specified detection limit J = value is estimated due to validation criteria
iiiiiA61iiiiiiiiiiiii
3 U 1 U
02 J 01 J
5 U 5 J 5 U
5 U 1 U
i|AGii[ijiiifii
3 U U
01 J 1 U 5 U 5 U 5 U 5 U 1 U
i^^^iiiiiic|ii[|ili
10
1 u 1 u 1 u 5 U 5 J
5 U 5 U 1 U
29
c
o o o
o
Gas Phase GAC or Catalytic Oxidation
To ^ Ambient
Air
To Groundwater Recharge or
Raw Treated ) Neponset River Groundwater Groundwater Influent Holding Tank J
Solids for Offsite Disposal
(NOTE Air stripper not necessary if discharge to Neponset)
FIGURE 1-3 PROPOSED GROUNDWATER TREATMENT SYSTEM SCHEMATIC
2483JP
o n o TABLE 1-16 COMPARISON OF INORGANIC FULL-SCALE TREATABILITY STUDY RESULTS TO MCLS AND DISCHARGE LEVELS
[i^i^^^^ iiiiiiijiMf|iilaquo4 Precipitation Aeration and Carbon AdsorpUoi iiiiiiiiiiiiiiiiiiiiiiritliiiiin
iiiii iiSiiii|iiiiiiiiiiiiiiiii and Filtration M^ Iiiiiiiiiiiiii iiiiiiiii|iiii|i|iiiiiiiiiii liiiijlliiiii
iiiiiiiiiiiiiiiiiiiii iiiiiiiiiiiiii i i i i i i i|ii||iiiiiiiiiiiiiiiiiiiiiiiii iiiiiiiiiiiiiiiilii Giliii iiiii ii iiiii i iiiic iD|i laquoi|iiiiiiii iiiiitiiiiciiiiiiiiiiiii
Discharge levels calculated by multiplying AWQC by a dilution factor based on a 100 gpm treatment discharge rate and a Neponset River 7Q10 of 2020 gpm
U = Undetected at specified detection limit
J = Estimated value due to validation criteria
NC = No criteria exists for the compound
P = Proposed MCL
S = Secondary MCL
n n o TABLE 1-17 COMPARISON OF INORGANIC FULL-SCALE TREATABILITY STUDY RESULTS TO MCLS AND DISCHARGE LEVELS
DISCHARGE TO MEADOW BROOK
[isjiiiiiiiiiiiiiiii-ii |iiiiiiiiiiiiiiiiiiiiiiiiiiiiiiiiiiiiiiiiiiiiiii iiiiiiiiiiiiiiiiiiiiiiiiiiiiii iiiiiiiiiiiiiiiiiiiiiiii- iiiiiiiiiiiiiiiiiiiiiiiiiiiiiiiiii ^iiiiiiiiiiiiiiiiiiiiiiiiiiiiiiiiii bull immMmii^^ F- piiiipiiiiil i i i i i i i i i i i AcraUon and Caibon AdsorpUon iii iii iiii i i i i l l l i i i i i i ^ ^ i p t ^ sectffllM^ ^ ^
Ajumin iw u i 358 bull490 z ii 240 i--lJi iiiiiiiiiiiJ^3iiitJi i i iii i3 lliiiiiiiiii iiii|ii]^(Ciiiiiiiiiii-iii-iiiiiiii5iiiii-iiiiiiiiNC^ Antimony 2i ij NA 44 U i44 U 44 U 44 U 44 U 10 P 88 30 8600
Ariseiaic- iiiiiiiiiiiiiiiiiiiiii8iiiiiiiiiiiiiii iiiiiiiiii-iis- - iiiiiiiiii- 1 u 71 J i-iiiiiy3|ili-uj - i i i 9 l i j i iii--5Qiiiiiiiiiiiiii iiiiii NC- NC - iL | Barium 247 32 106 U 65 U 597 49 U 131 IJ 2006 NC NC NC
Blaquoay|Hiiraquosi-- bullbullbull--bull i-iiiii-iiiiii3iiiiiiliiiiiiii -iiiiiiiiiiiNAi-iiiiiii I u -- 1 U iiiiiiiiiliilliiiiii-ii|iyi- iiiii iiiiiiiiiiiiiiiiii ii|i|40 - 53-bullbull13|shyCadmium ( S i u bull bull bull bull bull bull bull bull bull N A 4 UJ 4 UJ bullr^^ 4UJ 4UJ 5 682 038 170 Cai lc turn i bull- iiiiii3PiOCfiii iiiiiiiiiiii iiiiiiiiii^iiiiiiiiiiiiii 9650 i 8360 iiii7886iiiiiiiiiiiiiiiiiiiiiiii^iiiiiiii-ii6^^ iiiiii5isNltiiiiiiiiiiiiiiiiiii iiiiiiNC NGi NC Chromium 315 NA 8 J 7 UJ 7 u j 7 uj 7 iirj 160 16 11 3206
CO i-iii-iiii 33iitiii-iiiiii ii-iiiii-i-Jfiiiiii--iiii - bull bull 4 U Z 4 U- iiiiiiiiiiiiiilii-uiiiiiiiiiiiiiiiiiiiiiii4iitjiii-iiiiiiiiiii4 iiiiii-ii Nltiiiiiiiiiiiiiiiiiiiiii i l i iNc-- -NCi^-NCi
P ^ i bull bull Copper 6 4 i NA 128 U 179 U bull64Uj 9 U --256--u-- 1300 48 36 NC
Jtaa- iiiiiiiiiiii ltJOlt iiiiiiiiiii isiiiiiiiJQiii-i - z 6AS U ii232U-^^ bulliiiiiiiiiiiiiiiiiiiiuiiiiiiiiiiiiiiiiiiiiiiiiiiiiiiiiiii2 ipit|iiiiii iiiiii3pQiiiiJiiiilii liiiNC- v 1000- bull- NCi head 253 5^U^ 35 U 46 U 21 U 12 U J 2^4 u 14 054 NCis |Magnlaquoaiuiai iiiiiiiiiiilaquo)6iiiiiiiiiiiii iiiiiiiiiiii|lS)6iiiiiiiiiiiiii 3700 7060i V^ bulliiiMiiiiiiiiiiiiiiiiiii3Jpiiiiiii7^0iiiii^^^ i iiigtKSiiiiiiiiiiiiiiii bulliii I N C bull N C Ncjii Manganese 4810 bull356 62 U 18 UJ 23 U 35 U 53 U 56 S NC NC 106
Wtercuryi iiiiiiiiiiiiiiiiiiiiiiiiyiiiMiiiiiii iiiiiiiiiiiiiiiiiNAiiiiiii i P-2 U bullbull 0 2 U-- iiiiiiiiiiiiiiiiOi|iiittiiiiiii|iiiii 6iiiiit|iiiiiiiiiiiiiQ|iit|iiiiii iiiii|i|iiiiiiiiiii iiii|iii24- -- oon --0i|i Nickel 281 isrA 181 UJ 244 UJ 269 uil 17 U 356 il 166 P 643 33 3800
Potraquoslaquolum -iiiiiiiiiii4liS0iiiiiiiiii iiiiiiiiiiiii PPQiiiiU i 2200 U i ii 2620 XT | |i |owiiyiiiiii | |(^iiiiiiiiiii^ iiiiiiiiiiiiiiiW|iiiiiiiiiiiiii iii iii|ip--i NC- bullbullbull-KCii Selenium 20 U NA 32 U 13 UJ 1 6 u 1 UJ i u 5 6 266 50 6800 Sflycri i-i- iiiiiiiiiiiiiiiiiiiiiiiiiiiiiiiiiiiiiii iiiiiiiiiiiiiiiiiii iiii- i-4U bull -^M- U iii bull i i i i | | i | | i i i i |-i i | i | l | i i i i | i i i i iiiii-i ^66iiiiiiiiiiiiiii i|iP37 -0i2iNi Sodium 1 2 3 6 6 6 9 5 5 6 6 99000 lOlOOO 99866 106066 74566 NC NC NC NC
I m iiiiiiiiiiiiiiiiiiiiii||jriiiiii||iii|i|iii|| | ii46Q ^40- -bull-3iThaUJiiiitt - iiiiiiiiiiiiiiiiiiiiiiiiiiliiiiiiiiii iiiiiiiiiiiiiiNAii- I UJ ^ iiiiiiiiiiiiiiiiii Vanadium 439 NA 5 U 83 UJ 5 U 5 IJ 0 IJJ NC NC NC NC
Ziiicii^ iiiiiiii-iiiii- 488iiiiiiiiiiiiii iiiiiiiiiiii6iiu 151 U 67 UJ iiiii iiiiiiiiiiiiiiiil52iU- iiiiiiiii2 liiiiiiiiiii iiJiOQ()ii- Siiiiiiii iiiiiiiiii|6 bull bull33 - N C i
Notes
Discharge levels are AWQC (10-5 risk) since the treatment discharge rate of 100 gpm is higher than the flowrate of Meadow Brook
U = Undetected at specified detection limit
J = Estimated value due to validation criteria
NC = No criteria eus ts for the compound
P = Proposed MCL
S = Secondary MCL
o n o TABLE 1-18 COMPARISON OF ORGANIC FULL-SCALE TREATABILITY STUDY RESULTS TO MCLS AND DISCHARGE LEVELS - DISCHARGE TO THE NEPONSET RIVER
||x|o | bull iiii||i||il|A iiiiii iiiiiiiiliiiiiiiiiiili ii5iiPo|laquo|o|i iii||l|i|i||ii||y E^ly1 C DoteslOO ii i^i|raquoiiipltii=(iiiii|iii iiii i i w i M w iiiiiiilliHiJLYiiii iiiiWiiiiii iiiiiiiiiiiiii ii iiiiiiiiiiiiiiiiiiii iiiiii iiii iiiiiiiiiii iiiiiiiiiiiiiiiiii iiiiiiiiiililiiiiiiiiiliiiiii bulliiiiii lagaiiiiiiiii iiiiiiiiiiiiiiiiiiiiiiiiiiiiiiiii (ugL) iiiiiiii^iiiiiiiiii iiiiiiiiiiiiipiiiii iiUiiiiiii^ WmnKiiiiiii i(iiiiiiii i iii iiiiiiiiiiMiiiiii VOLATILE ORGANICS
112-Trichlorocthane 5 J 25 U 1 u 1 u 1 U 1 u 1 u 5 NC NC 8904
1122-TetrachIororthane 16 J 25 U 1 u I u I U 1 u 1 u NC NC 50880 2332
Chloroform 4 J 25 U 1 u 1 u 1 U I u 1 u NC 612680 26288 3328
Vinyl Chloride 10 U 50 U I u 1 u 1 u 1 u 1 u 2 NC NC 111300
11-DichIoroethene 10 U 25 U 1 u 1 u 1 u I u 1 u 7 245920 0 403
12-Dichloroethene (total) 200 D 97 1 u 1 u 1 u 1 u 1 70 245920 NC 29680000
Trichloroethene 860 D 430 1 u I u 1 u 1 u 2 5 954000 464280 19504
Tetrachloroethene 5 J 25 U 1 u I u 1 u 1 u 1 u 5 111936 17808 1876
Xylenes (total) 1 J 25 U 1 u 1 u 01 J 1 u I u lOOOO NC NC NC
Chlorobenzene 5 J 25 U 1 u 1 u 1 u 1 u I U NC NC NC NC
SEMIVOLATILE ORGANICS
Pentachlorophenol 25 U ND 25 U 25 U 25 U 25 U 25 U I 424 276 NC
Chlorobenzenes(total) 5300 1060 NC
13-Dichlorobenzene 3 J 2 10 U 10 U 10 U 10 U 10 U 600 NC NC 55120
14-Dichlorobenzene 17 9 10 U 10 U 10 U 10 U 10 U 75 NC NC 55120
12-Dichlorobciizcne 7 J 5 10 U 10 U 10 U 10 U 10 U 600 NC NC 360400
124-Trichlorobenzene 2400 D 50 10 u 10 u 10 U 10 u 10 U 9 5300 1060 NC
PESTICIDESPCBS
Arocloi-1254 36 J 32 NA 01 u NA OI u NA 05 42 03 01
Heptachlor 0074 J NA NA NA NA NA NA 04 11 01 01
Aldrin 017 J NA NA NA NA NA NA NC 64 NC 002
Heptachlor Epoxide 0045 J NA NA NA NA NA NA 02 NC NC NC
gamma-Chlordane 0056 J NA NA NA NA NA NA 2 51 OI 01
Notes
Discharge levels calculated by multiplying AWQC (10-S risk) by a dilution factor based on a 100 gpm treatment discharge rate and a Neponset River 7Q10 of 2020 gpm
Compounds presented are only those detected in the untreated groundwater sample
NA = Not analyzed J = Estimated value due to validation criteria
NC = No criteria exists for the compound D = The reported value is from the diluted analysis
U = Undetected at specified detection limit P = Proposed MCL
o n o TABLE 1-19 COMPARISON OF ORGANIC FULL-SCALE TREATABILITY STUDY RESULTS TO MCLS AND DISCHARGE LEVELS - DISCHARGE TO MEADOW BROOK
i 1 liiiisisi i ii iii iii|i|i i l i 11 i |ii^^ i i i i i i i i iiiiiiiiiiiiiiiiii iiiiiiiiiiiiieiciidiiiiii iiiiiiiiiiiiii iiiiiliiiiiii^^iiiiii iiiiiiiiiiiiiiiiiiii iiliiiii i iiiiipiiiliiiiiiiliiii iiiiiiiiiiiiiiiiii iiiii|iii|i|i-iiiiii iiAVQiii|iiiii i ii-iiiiiiigt-iiii ^^
iiiiiiiiiiiiiiii iiiiiiiiiiiiiiiiiiiiiiiiiiiiii iiiiiiiiiiiiiiiiiiiiii I i i i i i i i i||i|i|||iiiiiiiiiiiiiiii|iiii iii-|iiilaquo|i3[i|ii |||^|ii^|i|^|iii i (3 i i ^ ^ l i i illjliii^jiii^ iieip|i(iii|i iiiiiiiiiiiiiiiiiiii i^|iii|(iiiijiii|)|r^ iiii-iiliiiiiiiiiiiii ||i |illlli|i i|li|i|ii iiiiiiiiiiiiiiiiii iiiiiiiiiii|tiiiiiiiiiiiiiiiiiii iiiiiiiiiiiifiiiiiiiiii iiiiiiiiiiiiiiiiilaquoiiiiiii iiiiiiiiiiilliiiiiiiiiiiiiiii i (laquoy^ iiiiiiiiiiiii(Wiiiiiiiii iiiiiiiii i lK^ iiiiiiiiliiiiiiiiiiiiiiiii (ugl)iii iiMiiiiiii VOLATILE ORGANICS
112-Trichloroethane 5 J 25 U 1 u 1 u 1 u 1 u 1 u 5 NC NC 420
1122-Tetrachloroethane 16 J 25 U 1 u 1 u 1 u 1 u 1 u NC NC 2400 110
Chloroform 4 J 25 U 1 u 1 u 1 u I u 1 u NC 28900 1240 157
Vinyl Chloride 10 u 50 U 1 u 1 u 1 u 1 u I u 2 NC NC 5250
11-Dichloroethene 10 u 25 U 1 u 1 u 1 u I u 1 u 7 11600 NC 19
12-Dichlorocthene (total) 200 D 97 1 u I u 1 u 1 u 1 70 11600 NC 1400000
Trichloroethene 860 D 430 1 u 1 u 1 u I u 2 5 45000 21900 920
Tetrachloroethene 5 J 25 U 1 u 1 u 1 u 1 u 1 U 5 5280 840 89
Xylenes (total) 1 J 25 U 1 u 1 u 01 J I u I U 10000 NC NC NC
Chlorobenzene 5 J 25 U 1 u 1 u 1 u 1 u I u NC NC NC NC
SEMIVOLATILE ORGANICS
Pentachlorophenol 25 U ND 25 U 25 U 25 U 25 U 25 U 1 20 13 NC
Chlorobenzenes(total) 250 50 NC
13-Dichlorobcnzene 3 J 2 10 U 10 U 10 u 10 U 10 U 600 NC NC 2600
14-Dichlorobenzene 17 9 10 U 10 U 10 u 10 U 10 U 75 NC NC 2600
12-Dichlorobenzene 7 J 5 10 U 10 U 10 u 10 U 10 U 600 NC NC 17000
124-Trichlorobenzene 2400 D 50 10 u 10 u 10 u 10 u 10 U 9 250 50 NC
PESTICIDESPCBS
Aroclor-1254 36 J 32 01 u 01 u OI u OI u NA 05 20 0014 00045
Heptachlor 0074 J NA NA NA NA NA NA 04 052 00038 00029
Aldrin 017 J NA NA NA NA NA NA NC 3 NC 000079
Heptachlor Epoxide 0045 J NA NA NA NA NA NA 02 NC NC NC
gamma-Chlordane | 0056 J NA NA NA NA NA NA 2 24 00043 00048
Notes
Discharge levels are AWQC (10-5 risk) since the treatment discharge rate of 100 gpm is higher than the flowrate of Meadow Brook
Compounds presented are only those detected in the untreated groundwater sample
NA = Not analyzed J = Estimated value due to validation criteria
NC = No criteria exists for the compound D = The reported value is from the diluted analysis
U = Undetected at specified detection limit P = Proposed MCL
Table 1-17 shows a comparison of effluent to effluent discharge levels based on discharge to c Meadow Brook assuming a dilution factor on one If the treated groundwater was discharged
to Meadow Brook effluent discharge levels for arsenic would be exceeded Since arsenic is
a difficult compound to remove in a groundwater treatment plant it is concluded that
Meadow Brook may not be usable as a discharge point
Table 1-18 presents concentrations of organic contaminants in untreated groundwater from
MW-IA the precipitated and filtered effluent the effluent following both aeration and
carbon and the effluent from carbon adsorption only These values are compared to MCLs
and effluent discharge levels Only one carbon dose for the carbon only study the lowest
dose of 05 g carbon1000 ml groundwater is shown as a conservative example In both
cases using aeration and carbon and carbon alone organic contaminants were removed to
below MCLs and to below discharge levels Therefore aeration at an air-to-water ratio of
251 and a carbon dose of 05 g carbon1000 ml groundwater effectively removed volatile
organics semivolatile organics and PCBs from the groundwater
c It is expected that a maximum air-to-water ratio at 251 will be effective for an air stripper
onsite because full-scale air strippers are many times more efficient than the bench scale
models This is due to the greater surface area and turbulence found in the stripper The
off-gas from the air stripper will have to be treated to meet applicable standards either by a
catalytic oxidation unit or a vapor phase carbon adsorption system
Since no vinyl chloride was present in MW-IA and vinyl chloride is a difficult compound to
remove with carbon adsorption tests were performed with groundwater from ME-8 which
contained 210 xg1 vinyl chloride These results were presented in Table 1-13 which shows
that air stripping at an air-to-water ratio of 251 is effective in removing vinyl chloride In
order to reach the MCL of 2 figl for vinyl chloride an air stripper is required Carbon
adsorption alone would not remove vinyl chloride down to the MCL If the treated
groundwater is discharged to the Neponset River instead of being reinjected an air stripper
to remove vinyl chloride is not necessary since the discharge level is 111300 xg1
35 c
Table 1-19 shows a comparison between the organic concentrations in treatability study c effluents and effluent discharge levels based on discharge to Meadow Brook All volatile and
semivolatile organic compounds are removed to the effluent discharge levels It is
impossible to determine if PCBs were effectively removed since the most stringent discharge
level is 0014 xgL and the detection limit in the study is 01 xgL Discharge to Meadow
Brook may not be feasible due to 1) the treatability study cannot prove that PCBs are
removed to effluent discharge levels and 2) arsenic concentrations in the treated effluent
were higher than effluent discharge levels (based on a dilution factor of one)
The preliminary results of the sludge analysis indicate that the sludge is nonhazardous under
RCRA and TSCA Once the fiill scale groundwater treatment system is on line samples of
the sludge should be reanalyzed to confirm the preliminary results and to further assess the
disposal options
In summary the results of the treatability study indicate that groimdwater from the Norwood
PCB site can be treated effectively to allow discharge to either the Neponset River or r gtlaquo^ reinjection back into the aquifer If treated groundwater is reinjected the treatment plant
must include an air stripper to remove vinyl chloride If treated groundwater is discharged
to the Neponset River an air stripper is not necessary to meet discharge levels however the
use of Best Available Technology (BAT) may be required which would necessitate the
inclusion of an air stripper A cost comparison between an air stripper combined with
liquid-phase carbon versus liquid-phase carbon alone was performed and reported in the
Modeling Report The conclusion was there is not a significant difference in cost the
present worth assuming a discount factor of 8 and a 16-year period of perfonnance was
135 vs 102 million dollars (see Volume 2 Section 3) These costs will be evaluated
further during the design phase of the project The efficiracy at the full scale plant can be
optimized to ensure that at no time will the effluent from the plant exceed any applicable
groundwater or surface water standard
36 C
Section Two
c
c
20 ROCKS
21 Introduction and Objectives
There are several sources of rocks potentially contaminated with PCBs present on the Grant
Gear property portion of the Norwood PCB site Three different sources of rocks were
collected for analysis from the Grant Gear property The three rock sources included
overburden rocks from a trench west of the Grant Gear facility and below the interim
remedial cap crushed stone from the interim remedial cap west of the Grant Gear facility
and pea stone from the upper and lower roofs of the Grant Gear facility Throughout this
section rocks collected from on top of the interim remedial cap will be referred to as cap
rocks and overburden rocks wUl be referred to as trench rocks The rock collected from the
roof were analyzed under Work Plan 1 and are discussed in the Building Investigation
Report
The objective of this portion of the predesign work was threefold
bull To determine the PCB contamination if any on the different sources of rocks
bull To assess the feasibility of dry tumbling as a remedial altemative for the rocks
bull To assess the feasibility of water washing as a remedial altemative for the rocks
The dry tumblingwater washing was conducted on rocks that were reported to be too large
to be remediated with overburden soils by the solvent extraction technique
22 Description of Work
Samples of the three sources of rocks were collected by Metcalf amp Eddy personnel on
January 8-10 1992 Refer to Figure 1-1 for the locations of the trench and the cap rock
37 c
sampling points The samples were delivered to ENSECO laboratory in Cambridge
c Massachusetts and stored in a refrigerator at 4degC prior to sample preparation and analysis
Metcalf amp Eddy performed the sample preparation portion of the PCB analysis Rock
samples were weighed and gently placed in precleaned two liter glass beakers A quality
control surrogate compound was then added to each sample or method blank for subsequent
percent recovery determination The rocks were then immersed in extraction solvent
consisting of 30 percent acetone and 70 percent hexane by volume iEach sample and blank
was heated to 50degC and intermittently swirled by hand for a thirty minute extraction time
The extracts were then dried using sodium sulfate concentrated to 10 milliliters final volume
and submitted to ENSECO for PCB analysis using EPA SW846 Method 8080
The trench rocks were divided into three size categories with average diameters of one inch
two inches and three inches The rock size is an important consideration for the solvent
extraction remediation technique
^s^^ The three trench rock sizes and six cap rock samples were analyzed initially to determine the
extent of PCB contamination As outlined in the Quality Assurance Project Plan a second
portion of the cap rock sample with the highest initial PCB concentration was subjected to
water washing remediation and analyzed for PCBs Separate portions of the trench rock
samples were subjected to dry tumbling for ten and thirty minute intervals and water washing
for ten and thirty minute intervals The remediated rocks were then analyzed for PCBs
The dry tumbling and water washing were performed using an electronic rotary device The
rock samples were placed in clean two liter plastic sampling containers with screw cap
closures Laboratory distilled deionized water was poured into the water wash test
containers while the dry tumble samples had only the rocks enclosed
38 c
c 23 RESULTS
The one-inch average diameter trench rocks were initially contaminated with 1800 mgkg of
Aroclor 1254 Because the one-inch trench rocks were above the 10 mgkg cleanup standard
sample portions of the rocks were processed step by step through each of the four
remediations Although an eighty five percent reduction in PCB contamination was achieved
between the initial and final remediation samples the final concentration of 270 mgkg is still
well above the cleanup standard The results however showed a trend with the highest
concentration of PCBs detected on the initial sample lower PCB concentrations with the
ten-minute remediation and the lowest PCB concentrations achieved with the longest
thirty-minute remediation as expected The results for the one-inch trench rocks are
presented in Table 2-1
The two-inch average diameter rocks showed results similar to those of the one inch size
The initial sample had a concentration of 2500 mgkg of Aroclor 1254 The best
remediation result obtained was 450 mgkg for the ten-minute water wash sample A thirty c minute water wash sample for the two-inch trench rocks was not conducted when it became
apparent that a 10 mgkg cleanup level could not be obtained Because the 10 mgkg cleanup
level was not achievable the thirty minute water washing of two-inch rocks was not
conducted to minimize the level of effort and analytical costs The PCB result for the
thirty-minute dry screened sample 1900 mgkg Aroclor 1254 was higher than expected
This result was counter to the trend that was expected and observed with the one-inch rocks
and it demonstrates the non-homogenous nature of the rock samples This trend breaking
analytical result caused by the heterogenous or nonuniform nature of the rock sample matrix
was not repeated because the cleanup level could not be achieved The results for the
two-inch trench rock samples are presented in Table 2-1
The three-inch average diameter trench rocks yielded markedly different analytical results
The initial sample prepared with minimal on- site screening had a PCB concentration of
75 mgkg below the cleanup standard of 10 mgkg Although the initial result was below
39 c
TABLE 2-1 TRENCH ROCK WASHING RESULTS
Trench Rocks 1 inch Average Diameter
PCB Concentration
Sample mgKg
Initial sample 1800
Ten minute dry screened 620
Ten minute water wash 880
Thirty minute dry screened 290
Thirty minute water wash 270
Trench Rocks 2 inch Average Diameter
PCB Concentration
Sample mgKg
Initial sample 2500
Ten minute dry screened 490
Ten minute water wash 450
Thirty minute dry screened 1900
Trench Rocks 3 inch Average Diameter
PCB Concentration Sample mgKg
Initial sample 750
Ten min dry screened 210
Ten min water wash 025 UJ
Aroclor 1254 was the only PCB detected UJ - The sample was nondetect for PCBs to the estimated detection limit
of 025 mgKg
40
the cleanup standard it was close enough to warrant the first ten minute dry tumble c remediation step The first remediation step with a PCB concentration of 21 mgkg
confirmed that the three-inch trench rocks are less contaminated than their smaller
counterparts The three-inch ten-minute water washed sample was not submitted for fiill
quality control PCB analysis in an effort to minimize analytical costs The ten-minute water
washed sample result is from a partial quality control PCB screening analysis and is reported
as estimated Because of the lag time in tumaround of analytical results this sample had
been prepared extracted and screened and the information was available therefore it is
presented herein The results for the three inch average diameter rocks are presented in
Table 2-1
Six samples of cap rocks were collected and analyzed for PCBs AU of the results were less
than 02 mgkg or 200 xgkg For these cap rock samples an action level of 50 xgkg was
established in the Quality Assurance Project Plan The 50 xgkg value is an action level
established by EPA for this study only and is not a cleanup level identified in the ROD The
action if the results exceeded 50 igkg was to water wash the most highly PCB contaminated c sample Water washing was performed on cap rock sample number two The initial result
for this sample was 150 xgkg while the ten minute water washed sample yielded 24 igkg
Aroclor 1254 The cap rock results showed fairly consistent PCB concentrations in the range
of 50 to 150 igkg Aroclor 1254 The results are presented in Table 2-2
24 CONCLUSIONS
The cap rock samples were all determined to have PCB concentrations approximately one
hundred times less than the cleanup level of 10 mgkg Water washing conducted on the
most contaminated cap rock sample removed approximately eighty five percent of the PCBs
initially present These cap rock samples contained some fine soil like material which was
perhaps windblown carried on tmck tires or created by friction This material contributed
to the measured PCB concentrations for the cap rock samples
41 c
c TABLE 2-2 INTERIM REMEDIAL CAP ROCKS ANALYTICAL RESULTS
LOCAiSifi iiiiiiiiiiiiiii--iiiiiiiiiiiiiiiiiiiiidiiiiiiliiiiiiiii^ 10 minute Water Wash iiiii|ijii|iiii|iii^ PCB Concentration (ligKg)
1 120 NA
2 150 24
3 110 NA
4 31 U NA
5 86 NA
6 71 NA
Notes Aroclor 1254 was the only PCB detected U - Sample was nondetect for PCBs to the reported
detection limit - The highest initial PCB concentration cap rock sample was
subjected to a ten minute water wash remediation
42
C
The results of the rock tumbling and water washing demonstrate that this form of remediation r will not achieve the cleanup level of 10 mgkg for the one-inch and two-inch average
diameter overburden rocks The three inch rocks are below the cleanup level without
remediation It should be noted that these overburden rock samples were coUected from one
of the most highly contaminated areas at the site based on the remedial investigation results
These samples therefore represent worst case conditions
The dry tumbling remediation steps did not remove aU of the adhered soU particles as
anticipated This adhered highly PCB contaminated soU contributed to the measured rock
surface PCB concentration because the PCBs were extracted from the soU as weU as the rock
surface during sample preparation
The water wash remediation was effective in removing aU of the adhered soU The results
indicate that the rock surface and near surfaces have been contaminated with PCBs which
cannot be removed by water washing but are extractable with acetonehexane
c During the trench rock coUection ample one-inch and two-inch average diameter rocks were
avaUable at shaUow depths The trench had to be dug deeper to obtain the three inch size
rocks Because of the relative immobiUty of PCBs in soU the PCB concentration decreases
with depth as reported in the remedial investigation This decrease in PCB concentration
with depth is part of the explanation as to why the three inch rocks showed less
contamination than the smaUer sizes Also a factor is the surface area to mass ratio As the
mass of the rock increases the surface area to mass ratio decreases Since the PCBs are on
the surface or near surface of the rocks as the relative surface area decreases with size or
mass the reported concentration wiU decrease correspondingly
During the trench excavation and overburden rock coUection a two- to three-inch lens of
dark oUy appearing materials was observed This material was analyzed with a PCB field
screening kit and found to contain in excess of 10000 mgkg PCBs Some of the one and
two-inch diameter rocks sampled appeared dark in color Because it was not known whether
43 c
c
the dark rocks were naturaUy colored or from the tarry lens and to keep the study unbiased
these dark rocks were sampled randomly with the remaining rocks The dark appearing
rocks were estimated to comprise approximately five percent of the one and two-inch rock
sizes Inclusion of highly contaminated rocks in the samples would boost the reported PCB
concentrations
Altemative remedial measures other than rock tumbUng and water washing include detergent
and water washing organic solvent washing or steam cleaning Although preUminary
indications from the solvent extraction vendors are that only up to one inch size rocks can be
handled the possibiUty of designing a treatment system to handle larger rocks wiU be
explored during the design phase of this project If the size of the rocks precludes them
from remediation by solvent extraction along with contaminated soUds a rock cmsher wiU be
employed to reduce the contaminated rocks to a size that can be handled Although other
altematives for rock remediation might work solvent extraction with contaminated soUs or
rock cmshing foUowed by solvent extraction appear to be the easiest most cost effective
means to achieve the cleanup standards Whichever remedial altemative is selected rock
washing would only be necessary on rocks with average diameters between one and two
inches coUected from soU highly contaminated with PCBs A very rough estimate of rocks
onsite between one- and two-inch diameters is approximately 5000 tons No remediation of
the rocks is necessary if the solvent extraction technology can handle two-inch size rocks
44 c
c
c
system for volatUes semivolatUes PCBs and metals AU interim samples were analyzed at
ENSECO in Cambridge Massachusetts AU data was vaUdated by MampE according to the
QAPP
1221 Groundwater Sample CoUection Groundwater for this study was coUected from
weUs MW-IA and ME-8 as shown on Figure 1-2 iMW-lA was chosen as a sampling
location because it was determined to be one of the most contaminated weUs on-site based
on previous investigations During the course of the treatabiUty study a decision was made
to obtain samples from ME-8 because results of the most recent sampling effort conducted by
ICF indicated that groundwater from this weU contained approximately 200 xgL vinyl
chloride whereas groundwater from MW-IA no longer contained any quantifiable amount
Removal of vinyl chloride by aeration needed to be demonstrated during this investigation
because vinyl chloride is not effectively removed by carbon adsorption
Groundwater samples were obtained on four separate occasions during the study as shown in
Table 1-5 On each occasion the groundwater was coUected in accordance with the Field
Sampling Plan Three weU volumes of water were purged from the weU using a centrifiigal
pump before any samples were coUected The pH temperature and conductivity of the
purge water was measured after each weU volume untU the measured values differed by less
than 10 for three consecutive samples to ensure the sample drawn was representative of the
water in the aquifer Samples for the metals precipitation and filtration study were coUected
using a centrifugal pump Samples for the air stripping and carbon adsorption study were
coUected with a teflon baUer to minimize aeration and possible loss of volatUes during
sample coUection
The samples were coUected in one gallon amber glass bottles and stored at 4degC Each
sample bottle wasfiUed to exclude a headspace in the bottle
e 10
200 200
SCALE IN FEET
D CAP ROCK SAMPLE LOCATION
bull WELLS
nOURE 1-2 GROUNDWATER AND TRENCH AND CAP
ROCK SAMPLING LOCATIONS
11
E T C A L F a EDDY
c TABLE 1-5 GROUNDWATER SAMPLING SUMMARY
Mode of Date WeU Amount Sampled pH Temp degC Conductivity SampUng
11392 MW-IA 10 gallons 62 8deg 220 umhocm pump
12792 MW-IA 16 gaUons 62 8deg 220 umhocm baUer
20392 MW-IA 16 gallons 62 8deg 220 umhocm baUer
20592 ME-8 2 gallons 64 8deg 230 umhocm baUer
1222 Precipitation Testing
General Chemical precipitation for the removal of metals was evaluated at three pH values
and three polymer dosages to determine the effectiveness of the treatment A preliminary
evaluation of different coagulants and polymers was conducted at three pH values by
r Metcalf amp Eddy personnel and a leading polymer vendor to determine which chemicals could
potentiaUy be used to precipitate groundwater Based on the results from the preliminary
evaluation jar tests were conducted by Metcalf amp Eddy personnel to aid in the determination
of the chemical dosages required to optimize the effectiveness of precipitation
Polymer and Coagulent Testing Polymer testing was performed by Metcalf amp Eddy and a
leading polymer vendor at the ENSECO laboratory faciUty in Cambridge Massachusetts
The effectiveness of anionic cationic and nonioiuc polymer was evaluated at three pH
values The best polymer was determined to be Drewfloc 2270 a low charge anionic high
molecular weight polymer This polymer was used in jar tests 1 through 5 The best
coagulent was determined to be Charge Pack 12 (CP-12) a higher charge cationic low
molecular weight coagulent The CP-12 coagulent was used in jar tests 1 through 5
described under jar testing
12 c
InitiaUy the effects of varying the pH of the groundwater sample was investigated Tests c were conducted at pH values of 80 90 and 100 with sodium hydroxide which had the best
settling characteristics based on visual observation and turbidity measurement Each polymer
was then tested at pH = 100 to evaluate Us effectiveness under optimum pH conditions
A formula of polymer and coagulant addition was developed based on visual observations
suspended soUds and turbidity analyses performed on each sample generated during the
investigation The anionic polymer effectively flocculated the existing smaU suspended
particles and the addkion of cationic coagulant removed iron and color when the pH was
raised to 100
Jar Testing Five jar tests were performed using the polymer and coagulants determined to
be effective during preliminary testing Jar tests 1 and 4 were conducted as dupUcates at
ph 10 Jar test 2 was conducted at pH 9 jar test 3 was conducted at pH 8 and jar test 5 was
conducted at pH 10 On each occasion prior to beginning the jar test the raw groundwater
was brought tol5deg-17degCina warm water bath The temperature was held constant to c eliminate the effects of temperature on reaction rates and solubUity
The foUowing is a description of activities conducted during the jar tests fti through 4 See
Figure 1-1 for details Four samples were evaluated during each jar test For each jar test
four 15 Uter beakers were fiUed with 1 Uter of raw groundwater The beakers were placed
on the stirrer platform and the paddles were lowered into the sample The jar stirrer was
operated at 80 revolutions per minute (rpm) The pH was then adjusted to the desired value
(pH = 10 9 8 10 for Tests 1 2 3 4) with a lime slurry in two samples and with a
sodium hydroxide solution (25) in the remaining two samples Lime was added to
investigate its effects on the precipitate and to evaluate its effectiveness in pH adjustment
The cationic coagulant was then added to each sample untU the concentration in solution was
30 mgL The solution was stirred at 80 rpm for 2 minutes to ensure complete mixing The
polymer was then added to one sample pH adjusted with sodium hydroxide and one sample
pH adjusted with lime Mixing continued for two minutes Next the solution was stirred
13 c
slowly orflocculated for five minutes at 20 rpm FinaUy the solutions were aUowed to
c settle for 10 minutes Visual observations were recorded and samples were submitted for
suspended soUds turbidity and metals analyses
Jar test 5 was performed to assess the removal of manganese and aluminum by preaeration
and permanganate additions (see Figure 1-1) Because no significant benefit was observed in
the previous tests when lime was used instead of sodium hydroxide sodium hydroxide was
used to adjust the pH in aU four samples to a pH of 100 in jar test 5 Only sodium
hydroxide was added to the groundwater in the first jar to determine the removal of
manganese and aluminum attributable to the formation of an insoluble salt at high pH
Sodium hydroxide and polymer were added to the second jar to evaluate the effectiveness of
the polymer Sodium hydroxide polymer and coagulant were added to sample 4 The
supemate from sample 4 was then fUtered This was performed to determine if the required
removal efficiencies could be achieved by chemical precipitation and filtration
Permanganate was added to sample 3 in addition to sodium hydroxide coagulant and
polymer to determine if the manganese and aluminum present could be chemicaUy oxidized c to a less soluble state which would enhance the efficiency of fUtration The supemate was
then siphoned off using clean tygon tubing and a syringe into the sample containers
Samples were submitted for metals suspended soUds and turbidity as illustrated on
Figure 1-1
1223 Filtration Testing A bench-scale filtration study was perfonned to determine the
optimum pore size of filter media that could effectively remove the suspended soUds in the
precipitated groundwater The determination of the removal efficiency for each filter was
based on the concentration of suspended soUds and turbidity of the filtered water The time
required to filter the groundwater was also evaluated
Prior to filtration the metals in the groundwater were precipitated and coagulent and polymer
were added using the optimum conditions developed during the precipitation study The
optimum conditions consisted of pH adjustment to 10 with sodium hydroxide addition of
14 c
coagulent CP-12 to a concentration of one percent and addition of Drewfloc 2270 polymer to
c a concentration of 10 mgl Three grades (10 xm 5 xm and 1 xm pore sizes) of filter
paper were used with a Buchner ftmnel to filter aUquots of the precipitated groundwater
Samples of the filtered water were submitted to ENSECO for suspended soUds and turbidity
analysis
A sample of the metal hydroxide sludge was coUected during the treatability study The
sludge sample was submitted to the CLP system for PCB and metals analysis so that a
characterization of the sludge could be made and disposal options could be evaluated
1224 Air Stripping Testing Precipitated fUtered groundwater was aerated at three
different air to water ratios to determine the most effective stripping ratio To ensure that
worst case volatUe organic compound concentrations were present in the samples for this
study some modifications were made in how the sample was coUected and treated First
the groundwater was coUected with a baUer to prevent the loss of volatUes AdditionaUy the
water was fUtered under positive pressure foUowing the precipitation step to minimize the c loss of volatUes that would result if the water was filtered using a vacuum pump
An aquarium pump tygon tubing and aeration stone with a glass-fiber fUter cartridge was
used to aerate 1-Uter aUquots of precipitated and filtered groundwater The aeration flow
rate was caUbrated by filling a graduated cylinder with air that had been filled with tap water
and inverted in a water bath The air was diffused at 375 missec into 1-Uter aUquots of
groundwater and the time measured as iUustrated in Table 1-6 The aerated groundwater was
submitted to ENSECO for volatUe organics analysis
1225 Carbon Adsorption Testing The effectiveness of activated carbon for the removal
of organic compounds in the groundwater at the site was evaluated The carbon used was
the powdered activated 325 mesh carbon suppUed by Calgon Corporation The groundwater
samples used for this investigation were obtained and filtered as described in the air stripping
15 c
c
c
TABLE 1-6 AERATION TEST OPERATIONS
Air to Water Ratio Volume Volume of by Volume of Water Air Reqd Min of Aeration
251 1000 ml 25000 ml 111 501 1000 ml 50000 ml 222 751 1000 ml 75000 ml 333
section of this report to minimize the loss of volatUes A total of twelve samples were mn
during this investigation The necessity of air stripping was investigated by comparing the
resuUs from four samples that were air stripped to seven samples that were treated identicaUy
with the exception of air stripping AU samples for the air stripping comparison went
through the precipitation filtration and carbon adsorption processes AdditionaUy one
sample was prepared with no carbon added to serve as an untreated sample The samples are
summarized in Table 1-7 Each groundwater sample was prepared and mixed with a
predetermined dose of Calgon powdered 325 mesh activated carbon and placed m an open
Erlenmyer flask on a shaker table for a two-hour time period at 180 rpm A rotary shaker
table capable of accommodating twelve (12)-1000 ml Erlenmyer flasks was used Effluent
was fUtered with a barrel filter using a glass-fiber pre-fUter and a Whatman 45 micron
membrane The effluent clear and odorless in aU cases was added to sample containers
preserved and packed for shipment to CLP laboratories Since the shaker table could
accommodate 12 flasks a total of approximately 4 gaUons of effluent was generated during
each mn Several mns were performed to generate adequate quantities of sample for
analysis accordmg to Table 1-7 Groundwater was simUarly prepared for submittal to
Aquatec Lab in Burlington Vermont for chronic toxicity testing Three (3) shipments of
approximately 2 gaUons each were made
r 16
C) o o TABLE 1-7 CLP TREATABILITY STUDY SAMPLING SUMMARY
Dose g of Carbon Required of mis in gs Carbon
Sample ID 1000 ml of GW Analysis Volume mis Flasks Flasks in each
Precipitation Filtration Aeration amp Carbon
AC-1 05 V SV MET 3400 3 1067 054 AC-2 20 V SV PCB 4400 4 1100 22 AC-3 50 V SV MET 3400 3 1133 57 AC-4 100 V SV PCB 4400 4 1100 110 AC-5 Trip Blank 0 V
Precipitation Filtration amp Carbon
C-0 0 V 500 1 500 0
C-1 05 V SV MET 3200 3 1067 053
c-2 10 V PCB 2200 2 1100 11
C-3 20 V SV CT 29000 24 1250 25
C-4 50 V SV PCB 4400 4 1100 55
C-17 70 V MET 1200 1 1200 70
C-18 100 V SV 2200 2 1100 110
C-13 Treatability Blank 0 V PCB 2200 0 0 0
C-20 Trip Blank 0 V 0
C-10 Duplicate of C-1 05 SV 2000 2 1000 05
C-1 05 (MSMSD) 500 1 500 025
C-11 Duplicate of C-1 05 MET 1000 1 1000 05
C-20 Duplicate of C-2 10 V PCB (MSMSD)
4400 4 1100 11
C-16 Duplicate of C-4 50 PCB 2000 2 1000 50
C-6 0 PCB 2000 2 1000 0
17
o o n TABLE 1-7 (Continued) CLP TREATABILITY STUDY SAMPLING SUMMARY
Dose g of Carbon Required of mis in gs Carbon
Sample ID 1000 ml of GW Analysis Volume mis Flasks Flasks in each
Precipitation amp Filtration
PPF-1 V SV MET PCB 2000 2 1000 0
Sludge
Sludge-1 0 MET PCB 0
V = VolatUe organics SV = Semivolatile organics MET = Metals PCB = Polychlorinated biphenyls CT = Chronic toxicity MSMSD = Matrix spikematrix spike dup D = DupUcate TB = Trip blank PPF = Precipitated and pressure filtered
(to minimize volatUes loss as opposed to vacuum filtration)
18
c
c
123 Results
1231 Precipitation Testing
Polymer Testing Preliminary polymer and coagulant testing was conducted to determine
the type of polymer and coagulant that could be employed to treat groundwater from the site
The Drewfloc polymer and the Drew CP-12 cationic coagulant were chosen as the most
effective types InitiaUy the effect of varying the pH of the groundwater sample was
investigated The resuUs of tests conducted at pH values of 80 90 and 100 are presented
on Table 1-8 As the pH value was raised the quaUty of the floe improved The sample
raised to a pH level of 100 with sodium hydroxide exhibited the best settling characteristics
based on the color turbidity soUds and the quaUty of the floe
The effects of varying the polymer dose was then investigated at pH=100 The cationic
coagulant added to a concentration of 30 ppm after pH adjustment and prior to polymer
addition produced the clearest supemate based on color turbidity and suspended soUds
results Table 1-8 also summarizes the results from this investigation
Jar Testing Four jar tests were performed to evaluate the effectiveness of chemical
precipitation for the removal of metals in groundwater from weU MW-IA The analytical
results from the jar test are presented in Table 1-9 The greatest metal reductions occurred
when the pH was 100 Samples for which the pH was adjusted with lime showed better
removal of barium manganese and sodium concentrations than those samples for which the
pH was adjusted with sodium hydroxide Samples for which the pH was adjusted with
sodium hydroxide showed greater declines in the concentrations of calcium and magnesium
No significant effect was observed on the removal of cobalt iron lead aluminum potassium
and zinc when lime or sodium hydroxide was used to raise the pH The observation that
samples for which the pH was adjusted with sodium hydroxide had elevated concentrations of
19 c
c TABLE 1-8 PRELIMINARY POLYMER TESTING RESULTS
Description of Supemate
Procedure pH ColorSoUds
mgl Turbidity
NTU Floe SettleabUity
Varymg pH
Raw Groundwater pH adjustedNaOH pH adjustedNaOH pH adjustedNaOH
62 80 90 100
YeUowbrownYeUowbrownYeUowbrownYeUowbrown
450 gt50 gt gt 5 0 gt gt50
58 SUght mst pin floe medium
gt medium
None Slow Faster Fastest
Varying polymer dose pH adjustment wNaOH
pH adjustedno polymer
100 YeUowbrown gt gt50 gt medium Fast
Above wpolymerat 1 ppm
100 Light yeUow lt 10 35 large 18 Fast
c Polymer at 5 ppm 100
Polymer at 1 ppm 100 wcoag 30 ppm
Light yeUow
Very Ught
lt 10
lt 10 yeUow
32
30
Large 18
Targe 18
Fast
Fast
n 20
o o n TABLE 1-9 F U L L - S C A L E TREATABILITY STUDY JAR T E S T R E S U L T S
Results in mgL
SAMPLE ID iiiiiiiiiiiiiiiiiiiiMW JAiSiiii iiiJTililiiiiiiiiiiii iiiJTil^iiiiiii iiiiiiiiiiTIi3iiiiiiiii iiiii^ii^li^iiiiiiiiiiiiii^iiri^iiiiisiiiiiiiiiiiiimii iiiiiJT4^iiiiiiiiiiiiiinP4i4iiiiiiiiiii iiiiiJT2iiliiiiiiiiiiiiT2^iiiiiii |i|S^ iiiiiiiiiiiiiiiiiiiiiiiiiiiiilM ii iiiiiiiiiiiiiiiiiiiiJlt iiiiiiiiii iiiiiiiiii-iiiiiiii iiiiiiiii=iiiiiiiiiiiiiliiiiii iiiiiiiiiiiiiiiiiiiiiiliiiiiiiiiiiiiiiiiiiiiiiiiiliiiiiiiiiiiiiM ii^iiiiiiiiiiiii6iiiiiiiiiiiiiiiiiiijqiiiiii mmsectlsectMimamp0^
Zinc 0488 002 U 002 U 002 U 002 U 002 U 002 U 002 U 002 U 002 U 002 U
E S A M P L E ID iiiiiiiiiiiiiiiiiiiiJT2i3iiiiiiiiiiiiiiiii ^T2-4iiiiiiiii iiiiiiiiJ^alliiiiiiiiiiiii iii^Ta^iiiiiiiiiiii iiiiiiiiit3|3iiiiiiiiiiiii iiilT3Tr4iiiiiiiiiiiiiii rrs-i iiiiiiiiiiiiiiJTSl iiiiiiiiiiiiiii iiiiiitJiJiiiiiiiiiii iiiiiiWs-4iiiiiiiiiiiii iiiiiiiJT5r-5ii|iiiiiiii
iiiiiiiiliiiiiiiiiiiiiiiiiBSsiii iiiiiiiiiiiiiiiiiiiiiilgtHiiiiiiiiiiii iiiiiiNaOHiiiiiiii iiiiiiiiiiii)iliimiiiiiiiii iiiiiiiiSiiriiiisiiiiiiiiii iiiiiiiiNiliiiiiiiiii iiiii iNapHiiiiiiiiiiiii iiiiiiiiiiiiiiiifloiiiiiiiii iiii^iiiiiiiiiii iiiiiiii NiitQHiiiiiiiii iiiiiiiiiWftOHiiiiiiii wmm iii^iiiiiiiisiiiiiiiAli|ilii iiiiiiiiiiixiiiiiEal3i iltgtoi PolyCoag C o a g u l a n t PolyCoag Coagulant iiiiiiii iiiiiii iiiiiii)|sihyii^iiiiiiii PolyCoag PolyCoag iiiPoij^iii^il ANALYTES Aerated KMn04
Barium 0073 0072 010 010 010 010 NA NA NA NA NA Calcium 247 247 571 574 273 277 NA NA NA NA NA Cobalt 001 U 001 U 0017 0018 0017 0019 NA NA NA NA NA Iron 01 U Ol U 016 023 016 043 NA NA NA NA NA Lead 0005 U 0005 U 0005 U 0005 U 0005 U 0005 U NA NA NA NA NA Magnesium 44 44 50 51 50 50 NA NA NA NA NA Manganese 35 33 43 43 44 44 063 086 099 094 14 Potassium 5 U 5 U 5 U 5 U 5 U 5 U NA NA NA NA NA Sodium 423 477 170 169 502 508 NA NA NA NA NA Zinc 002 U 002 U 0082 011 015 016 NA NA NA NA NA
Notes Only metals detected in untreated groundwater from MWIA are presented NA = Not Analyzed
U = undetected at specified detection limit JTI = Jar Test 1
c
c
sodium in the treated water was expected This is because sodium is a component of sodium
hydroxide Similarly the elevated concentrations of calcium observed in samples for
whichthe pH was adjusted wUh lime are due to the calcium component in lime Jar test 5
was conducted to assess the effect that precipitation and chemical oxidation had on the
removal of manganese and aluminum The results of this investigation are also presented in
Table 1-9 The results indicate that greater reductions of aluminum and manganese cannot
be achieved with aeration or by the addition of a chemical oxidant such as permanganate
A sample of the metal hydroxide sludge a residual that wiU be generated during the
groundwater treatment was analyzed for metals and PCBs This sample of sludge was
generated by treating contaminated groundwater with precipitation and filtration using the
optimum treatment parameters The metals results indicate that the sludge would not be
considered hazardous under RCRA using the toxicity characteristic leaching procedure
(TCLP) A TCLP was not performed on the sludge however based on 1) the concentration
of the metals in the sludge 2) assuming a 100 leachability and 3) incoiporating a 20-fold
dUution for a soUd matrix analyzed by TCLP this sludge would not be considered hazardous
under RCRA The PCB analysis of the sludge showed that Aroclor 1254 was the only
detected PCB at a concentration of 31 mgkg The TSCA limit for PCBs in waste is
50 mgkg indicating that this sludge would not be hazardous under TSCA The results for
this sludge represent a preliminary characterization and once the fuU scale treatment system
is on line the sludge analysis wiU need further testing to confirm these preliminary results
and to make a further assessment of the disposal options The analytical resuUs for the
sludge are presented in Table 1-10
1232 FUtration Testing A bench-scale filtration study was performed to determine the
optimum particle retention grade or mesh of filter media that could effectively remove the
suspended soUds in the precipitated groundwater The results of the analysis on the fUtrate
are presented in Table 1-11
n 22
c
c
TABLE 1-10 PRECIPITATED METAL HYDROXIDE SLUDGE RESULTS Results in mgkg
i||ipiiiii|iiiiiiiiiiiiiiiii^^iiiili|ii^^^ TCLP or TSCA L i n i l t s i Tfesi-iiiiiiiiiiiiiiisiiiiii^iiiiiiSvHiij^ in Solid Matrices ii iiiiS WM3KT2S
METALS
Aluminum Antimony Arsemc Barium Beryllium
Cadmium Calcium Chromium Cobalt Copper Iron Lead Magnesium Manganese Mercury Nickel Selenium Silver Sodium Thallium Vanadium Zinc
PCBs
Aroclor 1254
41100 231 195 346 5767
9120 338
25 114
39000 694 5260 2730
03313
04
8960 08
561446
31
U U
U
J
U U U R
U U J
J
NC NC 100
2000 NC 20
NC 100 NC NC NC 100 NC NC
4 NC 20
100 NC NC NC NC
50
Notes = TCLP Limits incorporated a 1 to 20 dilution factor for solid matrices Aroclor 1254 was the only PCB detected The remaining six Aroclors
were nondetect at a quantitation limit of 36 mgkg NC = No criteria exists for this compound U = Undetected at speciiied detection limit
L J = Estimated value due to validation criteria R = The result is rejected
23
c
c
TABLE 1-11 FILTRATION STUDY RESULTS
Media Rating Speed Suspended SoUds Turbidity
Raw 45 mgl 578 Course 10 um 200 mls5 sec lt5 mgl 16 NTU Medium 5 um 200 mls7 sec lt5 mgl 19 NTU Fine 1 um 200 mls23 sec lt5 mgl 18 NTU
Since there was virtuaUy no difference in the quaUty of effluents but substantial increase in
time to filter with the fine filter paper the medium 5 micron paper was chosen to prepare
sample for ftirther study
1233 Air Stripping Precipitated fUtered groundwater was aerated at 3 different air to
water ratios to evaluate the effectiveness of air stripping for the removal of volatUe organic
compounds in the groundwater Tables 1-12 and 1-13 shows the analytical results for
groundwater samples obtained from weUs MW-IA and ME-8 respectively No volatUe
organic compounds were detected in samples that were aerated at a 501 air to water ratio
Aeration of precipitated filtered groundwater obtained from weU ME-8 removed aU of the
vinyl chloride at an air to water ratio of 251
1234 Carbon Adsorption The effectiveness of carbon adsorption for the removal of
organic compounds in the groundwater was evaluated The analytical results are presented in
Table 1-14 At the lowest carbon dosage only 1 xg1 of cis-12-dichloroethene and
2 xg1 of trichloroethene remained No site-related volatUe organic compounds were detected
in samples which were treated with higher doses of carbon Toluene and
dibromochloromethane were detected in sample C-4 however these two compounds were
not detected in the raw groundwater and must therefore be a result of lab contamination
24 c
c TABLE 1-12 FULL SCALE TREATABILITY STUDY AIR STRIPPING RESULTS IN ugL FOR WELL MWIA
Methylene Chloride 10 u 4 U 5 U 5 U 4 U 4 U 2 U 4 U
cis-12-Dichloroethene 200 D 1 U 1 06 J 06 J 1 U 1 U 1 U
Chloroform 4 J 1 U 1 U 1 U 1 U 12 J 1 U 1 U
12-Dichloroethane 10 U 2 1 u 1 U 1 U 1 U 1 U 03 J
Carbon Tetrachloride 10 u 1 U 1 u 1 U 1 U 1 U 1 U 01 J
Trichloroethene 860 D 1 U 2 06 J 06 J 02 J 1 U 1 U
Toluene 10 U 020 J 1 U 1 U 1 U 007 J 25 1 U
Dibromochloromethane 10 U 1 U 1 U 1 U 1 U 1 U 14 1 U
Chlorobenzene 5 J 1 U 1 U 1 U 1 U 1 U 1 U 1 U
Ethylbenzene 10 U 1 U 1 U 1 U 1 U 1 U 1 U 1 U
Total Xylenes 1 J 1 U 1 U 1 U I U 1 U 1 U 1 U
Styrene 10 U 1 U 1 u 1 U 1 U 1 U 09 J 1 U
124-Trichloroben2ene 2400 D 4 1 u 1 U 1 U 1 U 1 U 1 U
123-Trichloroben2ene NA 5 1 u 1 U 1 U 1 U 1 U 1 U ^
SEMIVOLATILE ORG ANICS
Diethylphthalate 10 U 2 J 10 u 10 U 10 u Di-n-butylphthalate 10 U 1 J 10 u 10 U 10 u
Bis(2-ethylhexyl)phthal ate 10 U 10 U 10 u 4 J 2 J
Notes
Only volatile and semivolatile organics detected in any sample are included
No PCBs were detected in any effluent sample at a detection limit of 01 ugL influent was 36 J ugL
C-ID = Duplicate of C-1
U = Undetected at specified detection limit
J = Estimated value due to validation criteria
D = Duplicate
NA = Not Analyzed
= Value is for total 12-Dichlorocthene
i| f|iiiiiiiiiiiiiii^ti8ili| WSk
3 U 2 u 8 U
1 U 1 u 1 U
1 U 1 u 1 U
04 J 1 U 1 U
1 U 1 u 1 U
03 J 008 J 1 U
1 U 1 u 1 U
1 U 1 u 1 U
02 J 1 U 1 U
005 J 1 U 1 U
02 J OI J 1 u 1 U 1 U 1 u 1 U 1 U 1 u 1 U 1 U 1 u
10 U
10 u
2 J
27
c
The effectiveness of combining aeration and carbon adsorption to remove organic c contaminants was also investigated These results are also summarized in Table 1-15 No
organic compounds were detected m any of the samples generated during this investigation
124 Conclusions The results of the groundwater treatability study demonstrate that
treatment consisting of precipitation fUtration air stripping with vapor phase controls and
carbon adsorption appear able to meet cleanup levels estabUshed for the site Figure 1-3 is a
schematic representation of the proposed system The ROD stipulates that treated
groundwater wUl be reinjected to the aquifer onsite in this case MCLs are the cleanup
levels An altemative to be evaluated is discharging the treated groundwater to a surface
water body either Meadow Brook or the Neponset River In this case cleanup levels are
estabUshed as effluent discharge levels Effluent discharge levels are calculated by
multiplying the ambient water quaUty criteria (AWQC) values for each compound by a
dUution factor The dUution factor for the Neponset River is based on a 100-gpm treatment
discharge rate and a Neponset River 7010 of 2020 gpm The dUution factor for Meadow
Brook is 1 since the treatment discharge rate is greater than the flow of the brook therefore
effluent discharge levels for Meadow Brook are set at AWQC
Tables 1-16 through 1-19 compare effluent discharge levels for both the Neponset River and
Meadow Brook to carbon adsorption effluent from the groundwater treatability study
Table 1-16 summarizes the concentration of metals in untreated groundwater the metals
concentrations remaining foUowing precipitation and filtration the metals concentration
foUowing aeration and carbon adsorption the metals concentrations foUowing caition
adsorption only the MCLs and the effluent discharge levels based on discharge to the
Neponset River The only metal effluent concentration which exceeds the MCLs is
aluminum the MCL for aluminum however is a secondary MCL which is nonenforceable
No metals concentrations in the effluent exceed any of the effluent discharge levels
n 28
c TABLE 1-15 FULL-SCALE TREATABILITY STUDY AERATION AND CARBON ADSORPTION RESULTS Results in ugL
iiiiii|Mpt-HiiDiiii-iiiiii^iiiiiiiiiiii iii bullbullbull^(6-^1 iiiiii-iiiiiiiii iiiiiiiiii^g-2iiiiiiiiiii|i
l | | | ibyNigtii i i i i | i i i i i i i | ivi
VOLATILE ORGANICS
Mediylene Chloride 6 U 4 U Carbon Tetrachloride 1 U 01 J Toluene 02 J 1 u Total Xylenes 1 U 1 u Acetone 5 U 5 U 2-Butanone 5 U 5 U 2-Hexanone 5 U 5 U 4-Methy 1-2-pentanone 5 U 5 U Carbon Disulfide 1 U 1 U
c Notes Only volatile organics detected in any sample are included U = undetected at specified detection limit J = value is estimated due to validation criteria
iiiiiA61iiiiiiiiiiiii
3 U 1 U
02 J 01 J
5 U 5 J 5 U
5 U 1 U
i|AGii[ijiiifii
3 U U
01 J 1 U 5 U 5 U 5 U 5 U 1 U
i^^^iiiiiic|ii[|ili
10
1 u 1 u 1 u 5 U 5 J
5 U 5 U 1 U
29
c
o o o
o
Gas Phase GAC or Catalytic Oxidation
To ^ Ambient
Air
To Groundwater Recharge or
Raw Treated ) Neponset River Groundwater Groundwater Influent Holding Tank J
Solids for Offsite Disposal
(NOTE Air stripper not necessary if discharge to Neponset)
FIGURE 1-3 PROPOSED GROUNDWATER TREATMENT SYSTEM SCHEMATIC
2483JP
o n o TABLE 1-16 COMPARISON OF INORGANIC FULL-SCALE TREATABILITY STUDY RESULTS TO MCLS AND DISCHARGE LEVELS
[i^i^^^^ iiiiiiijiMf|iilaquo4 Precipitation Aeration and Carbon AdsorpUoi iiiiiiiiiiiiiiiiiiiiiiritliiiiin
iiiii iiSiiii|iiiiiiiiiiiiiiiii and Filtration M^ Iiiiiiiiiiiiii iiiiiiiii|iiii|i|iiiiiiiiiii liiiijlliiiii
iiiiiiiiiiiiiiiiiiiii iiiiiiiiiiiiii i i i i i i i|ii||iiiiiiiiiiiiiiiiiiiiiiiii iiiiiiiiiiiiiiiilii Giliii iiiii ii iiiii i iiiic iD|i laquoi|iiiiiiii iiiiitiiiiciiiiiiiiiiiii
Discharge levels calculated by multiplying AWQC by a dilution factor based on a 100 gpm treatment discharge rate and a Neponset River 7Q10 of 2020 gpm
U = Undetected at specified detection limit
J = Estimated value due to validation criteria
NC = No criteria exists for the compound
P = Proposed MCL
S = Secondary MCL
n n o TABLE 1-17 COMPARISON OF INORGANIC FULL-SCALE TREATABILITY STUDY RESULTS TO MCLS AND DISCHARGE LEVELS
DISCHARGE TO MEADOW BROOK
[isjiiiiiiiiiiiiiiii-ii |iiiiiiiiiiiiiiiiiiiiiiiiiiiiiiiiiiiiiiiiiiiiiii iiiiiiiiiiiiiiiiiiiiiiiiiiiiii iiiiiiiiiiiiiiiiiiiiiiii- iiiiiiiiiiiiiiiiiiiiiiiiiiiiiiiiii ^iiiiiiiiiiiiiiiiiiiiiiiiiiiiiiiiii bull immMmii^^ F- piiiipiiiiil i i i i i i i i i i i AcraUon and Caibon AdsorpUon iii iii iiii i i i i l l l i i i i i i ^ ^ i p t ^ sectffllM^ ^ ^
Ajumin iw u i 358 bull490 z ii 240 i--lJi iiiiiiiiiiiJ^3iiitJi i i iii i3 lliiiiiiiiii iiii|ii]^(Ciiiiiiiiiii-iii-iiiiiiii5iiiii-iiiiiiiiNC^ Antimony 2i ij NA 44 U i44 U 44 U 44 U 44 U 10 P 88 30 8600
Ariseiaic- iiiiiiiiiiiiiiiiiiiiii8iiiiiiiiiiiiiii iiiiiiiiii-iis- - iiiiiiiiii- 1 u 71 J i-iiiiiy3|ili-uj - i i i 9 l i j i iii--5Qiiiiiiiiiiiiii iiiiii NC- NC - iL | Barium 247 32 106 U 65 U 597 49 U 131 IJ 2006 NC NC NC
Blaquoay|Hiiraquosi-- bullbullbull--bull i-iiiii-iiiiii3iiiiiiliiiiiiii -iiiiiiiiiiiNAi-iiiiiii I u -- 1 U iiiiiiiiiliilliiiiii-ii|iyi- iiiii iiiiiiiiiiiiiiiiii ii|i|40 - 53-bullbull13|shyCadmium ( S i u bull bull bull bull bull bull bull bull bull N A 4 UJ 4 UJ bullr^^ 4UJ 4UJ 5 682 038 170 Cai lc turn i bull- iiiiii3PiOCfiii iiiiiiiiiiii iiiiiiiiii^iiiiiiiiiiiiii 9650 i 8360 iiii7886iiiiiiiiiiiiiiiiiiiiiiii^iiiiiiii-ii6^^ iiiiii5isNltiiiiiiiiiiiiiiiiiii iiiiiiNC NGi NC Chromium 315 NA 8 J 7 UJ 7 u j 7 uj 7 iirj 160 16 11 3206
CO i-iii-iiii 33iitiii-iiiiii ii-iiiii-i-Jfiiiiii--iiii - bull bull 4 U Z 4 U- iiiiiiiiiiiiiilii-uiiiiiiiiiiiiiiiiiiiiiii4iitjiii-iiiiiiiiiii4 iiiiii-ii Nltiiiiiiiiiiiiiiiiiiiiii i l i iNc-- -NCi^-NCi
P ^ i bull bull Copper 6 4 i NA 128 U 179 U bull64Uj 9 U --256--u-- 1300 48 36 NC
Jtaa- iiiiiiiiiiii ltJOlt iiiiiiiiiii isiiiiiiiJQiii-i - z 6AS U ii232U-^^ bulliiiiiiiiiiiiiiiiiiiiuiiiiiiiiiiiiiiiiiiiiiiiiiiiiiiiiiii2 ipit|iiiiii iiiiii3pQiiiiJiiiilii liiiNC- v 1000- bull- NCi head 253 5^U^ 35 U 46 U 21 U 12 U J 2^4 u 14 054 NCis |Magnlaquoaiuiai iiiiiiiiiiilaquo)6iiiiiiiiiiiii iiiiiiiiiiii|lS)6iiiiiiiiiiiiii 3700 7060i V^ bulliiiMiiiiiiiiiiiiiiiiiii3Jpiiiiiii7^0iiiii^^^ i iiigtKSiiiiiiiiiiiiiiii bulliii I N C bull N C Ncjii Manganese 4810 bull356 62 U 18 UJ 23 U 35 U 53 U 56 S NC NC 106
Wtercuryi iiiiiiiiiiiiiiiiiiiiiiiiyiiiMiiiiiii iiiiiiiiiiiiiiiiiNAiiiiiii i P-2 U bullbull 0 2 U-- iiiiiiiiiiiiiiiiOi|iiittiiiiiii|iiiii 6iiiiit|iiiiiiiiiiiiiQ|iit|iiiiii iiiii|i|iiiiiiiiiii iiii|iii24- -- oon --0i|i Nickel 281 isrA 181 UJ 244 UJ 269 uil 17 U 356 il 166 P 643 33 3800
Potraquoslaquolum -iiiiiiiiiii4liS0iiiiiiiiii iiiiiiiiiiiii PPQiiiiU i 2200 U i ii 2620 XT | |i |owiiyiiiiii | |(^iiiiiiiiiii^ iiiiiiiiiiiiiiiW|iiiiiiiiiiiiii iii iii|ip--i NC- bullbullbull-KCii Selenium 20 U NA 32 U 13 UJ 1 6 u 1 UJ i u 5 6 266 50 6800 Sflycri i-i- iiiiiiiiiiiiiiiiiiiiiiiiiiiiiiiiiiiiiii iiiiiiiiiiiiiiiiiii iiii- i-4U bull -^M- U iii bull i i i i | | i | | i i i i |-i i | i | l | i i i i | i i i i iiiii-i ^66iiiiiiiiiiiiiii i|iP37 -0i2iNi Sodium 1 2 3 6 6 6 9 5 5 6 6 99000 lOlOOO 99866 106066 74566 NC NC NC NC
I m iiiiiiiiiiiiiiiiiiiiii||jriiiiii||iii|i|iii|| | ii46Q ^40- -bull-3iThaUJiiiitt - iiiiiiiiiiiiiiiiiiiiiiiiiiliiiiiiiiii iiiiiiiiiiiiiiNAii- I UJ ^ iiiiiiiiiiiiiiiiii Vanadium 439 NA 5 U 83 UJ 5 U 5 IJ 0 IJJ NC NC NC NC
Ziiicii^ iiiiiiii-iiiii- 488iiiiiiiiiiiiii iiiiiiiiiiii6iiu 151 U 67 UJ iiiii iiiiiiiiiiiiiiiil52iU- iiiiiiiii2 liiiiiiiiiii iiJiOQ()ii- Siiiiiiii iiiiiiiiii|6 bull bull33 - N C i
Notes
Discharge levels are AWQC (10-5 risk) since the treatment discharge rate of 100 gpm is higher than the flowrate of Meadow Brook
U = Undetected at specified detection limit
J = Estimated value due to validation criteria
NC = No criteria eus ts for the compound
P = Proposed MCL
S = Secondary MCL
o n o TABLE 1-18 COMPARISON OF ORGANIC FULL-SCALE TREATABILITY STUDY RESULTS TO MCLS AND DISCHARGE LEVELS - DISCHARGE TO THE NEPONSET RIVER
||x|o | bull iiii||i||il|A iiiiii iiiiiiiiliiiiiiiiiiili ii5iiPo|laquo|o|i iii||l|i|i||ii||y E^ly1 C DoteslOO ii i^i|raquoiiipltii=(iiiii|iii iiii i i w i M w iiiiiiilliHiJLYiiii iiiiWiiiiii iiiiiiiiiiiiii ii iiiiiiiiiiiiiiiiiiii iiiiii iiii iiiiiiiiiii iiiiiiiiiiiiiiiiii iiiiiiiiiililiiiiiiiiiliiiiii bulliiiiii lagaiiiiiiiii iiiiiiiiiiiiiiiiiiiiiiiiiiiiiiiii (ugL) iiiiiiii^iiiiiiiiii iiiiiiiiiiiiipiiiii iiUiiiiiii^ WmnKiiiiiii i(iiiiiiii i iii iiiiiiiiiiMiiiiii VOLATILE ORGANICS
112-Trichlorocthane 5 J 25 U 1 u 1 u 1 U 1 u 1 u 5 NC NC 8904
1122-TetrachIororthane 16 J 25 U 1 u I u I U 1 u 1 u NC NC 50880 2332
Chloroform 4 J 25 U 1 u 1 u 1 U I u 1 u NC 612680 26288 3328
Vinyl Chloride 10 U 50 U I u 1 u 1 u 1 u 1 u 2 NC NC 111300
11-DichIoroethene 10 U 25 U 1 u 1 u 1 u I u 1 u 7 245920 0 403
12-Dichloroethene (total) 200 D 97 1 u 1 u 1 u 1 u 1 70 245920 NC 29680000
Trichloroethene 860 D 430 1 u I u 1 u 1 u 2 5 954000 464280 19504
Tetrachloroethene 5 J 25 U 1 u I u 1 u 1 u 1 u 5 111936 17808 1876
Xylenes (total) 1 J 25 U 1 u 1 u 01 J 1 u I u lOOOO NC NC NC
Chlorobenzene 5 J 25 U 1 u 1 u 1 u 1 u I U NC NC NC NC
SEMIVOLATILE ORGANICS
Pentachlorophenol 25 U ND 25 U 25 U 25 U 25 U 25 U I 424 276 NC
Chlorobenzenes(total) 5300 1060 NC
13-Dichlorobenzene 3 J 2 10 U 10 U 10 U 10 U 10 U 600 NC NC 55120
14-Dichlorobenzene 17 9 10 U 10 U 10 U 10 U 10 U 75 NC NC 55120
12-Dichlorobciizcne 7 J 5 10 U 10 U 10 U 10 U 10 U 600 NC NC 360400
124-Trichlorobenzene 2400 D 50 10 u 10 u 10 U 10 u 10 U 9 5300 1060 NC
PESTICIDESPCBS
Arocloi-1254 36 J 32 NA 01 u NA OI u NA 05 42 03 01
Heptachlor 0074 J NA NA NA NA NA NA 04 11 01 01
Aldrin 017 J NA NA NA NA NA NA NC 64 NC 002
Heptachlor Epoxide 0045 J NA NA NA NA NA NA 02 NC NC NC
gamma-Chlordane 0056 J NA NA NA NA NA NA 2 51 OI 01
Notes
Discharge levels calculated by multiplying AWQC (10-S risk) by a dilution factor based on a 100 gpm treatment discharge rate and a Neponset River 7Q10 of 2020 gpm
Compounds presented are only those detected in the untreated groundwater sample
NA = Not analyzed J = Estimated value due to validation criteria
NC = No criteria exists for the compound D = The reported value is from the diluted analysis
U = Undetected at specified detection limit P = Proposed MCL
o n o TABLE 1-19 COMPARISON OF ORGANIC FULL-SCALE TREATABILITY STUDY RESULTS TO MCLS AND DISCHARGE LEVELS - DISCHARGE TO MEADOW BROOK
i 1 liiiisisi i ii iii iii|i|i i l i 11 i |ii^^ i i i i i i i i iiiiiiiiiiiiiiiiii iiiiiiiiiiiiieiciidiiiiii iiiiiiiiiiiiii iiiiiliiiiiii^^iiiiii iiiiiiiiiiiiiiiiiiii iiliiiii i iiiiipiiiliiiiiiiliiii iiiiiiiiiiiiiiiiii iiiii|iii|i|i-iiiiii iiAVQiii|iiiii i ii-iiiiiiigt-iiii ^^
iiiiiiiiiiiiiiii iiiiiiiiiiiiiiiiiiiiiiiiiiiiii iiiiiiiiiiiiiiiiiiiiii I i i i i i i i i||i|i|||iiiiiiiiiiiiiiii|iiii iii-|iiilaquo|i3[i|ii |||^|ii^|i|^|iii i (3 i i ^ ^ l i i illjliii^jiii^ iieip|i(iii|i iiiiiiiiiiiiiiiiiiii i^|iii|(iiiijiii|)|r^ iiii-iiliiiiiiiiiiiii ||i |illlli|i i|li|i|ii iiiiiiiiiiiiiiiiii iiiiiiiiiii|tiiiiiiiiiiiiiiiiiii iiiiiiiiiiiifiiiiiiiiii iiiiiiiiiiiiiiiiilaquoiiiiiii iiiiiiiiiiilliiiiiiiiiiiiiiii i (laquoy^ iiiiiiiiiiiii(Wiiiiiiiii iiiiiiiii i lK^ iiiiiiiiliiiiiiiiiiiiiiiii (ugl)iii iiMiiiiiii VOLATILE ORGANICS
112-Trichloroethane 5 J 25 U 1 u 1 u 1 u 1 u 1 u 5 NC NC 420
1122-Tetrachloroethane 16 J 25 U 1 u 1 u 1 u 1 u 1 u NC NC 2400 110
Chloroform 4 J 25 U 1 u 1 u 1 u I u 1 u NC 28900 1240 157
Vinyl Chloride 10 u 50 U 1 u 1 u 1 u 1 u I u 2 NC NC 5250
11-Dichloroethene 10 u 25 U 1 u 1 u 1 u I u 1 u 7 11600 NC 19
12-Dichlorocthene (total) 200 D 97 1 u I u 1 u 1 u 1 70 11600 NC 1400000
Trichloroethene 860 D 430 1 u 1 u 1 u I u 2 5 45000 21900 920
Tetrachloroethene 5 J 25 U 1 u 1 u 1 u 1 u 1 U 5 5280 840 89
Xylenes (total) 1 J 25 U 1 u 1 u 01 J I u I U 10000 NC NC NC
Chlorobenzene 5 J 25 U 1 u 1 u 1 u 1 u I u NC NC NC NC
SEMIVOLATILE ORGANICS
Pentachlorophenol 25 U ND 25 U 25 U 25 U 25 U 25 U 1 20 13 NC
Chlorobenzenes(total) 250 50 NC
13-Dichlorobcnzene 3 J 2 10 U 10 U 10 u 10 U 10 U 600 NC NC 2600
14-Dichlorobenzene 17 9 10 U 10 U 10 u 10 U 10 U 75 NC NC 2600
12-Dichlorobenzene 7 J 5 10 U 10 U 10 u 10 U 10 U 600 NC NC 17000
124-Trichlorobenzene 2400 D 50 10 u 10 u 10 u 10 u 10 U 9 250 50 NC
PESTICIDESPCBS
Aroclor-1254 36 J 32 01 u 01 u OI u OI u NA 05 20 0014 00045
Heptachlor 0074 J NA NA NA NA NA NA 04 052 00038 00029
Aldrin 017 J NA NA NA NA NA NA NC 3 NC 000079
Heptachlor Epoxide 0045 J NA NA NA NA NA NA 02 NC NC NC
gamma-Chlordane | 0056 J NA NA NA NA NA NA 2 24 00043 00048
Notes
Discharge levels are AWQC (10-5 risk) since the treatment discharge rate of 100 gpm is higher than the flowrate of Meadow Brook
Compounds presented are only those detected in the untreated groundwater sample
NA = Not analyzed J = Estimated value due to validation criteria
NC = No criteria exists for the compound D = The reported value is from the diluted analysis
U = Undetected at specified detection limit P = Proposed MCL
Table 1-17 shows a comparison of effluent to effluent discharge levels based on discharge to c Meadow Brook assuming a dilution factor on one If the treated groundwater was discharged
to Meadow Brook effluent discharge levels for arsenic would be exceeded Since arsenic is
a difficult compound to remove in a groundwater treatment plant it is concluded that
Meadow Brook may not be usable as a discharge point
Table 1-18 presents concentrations of organic contaminants in untreated groundwater from
MW-IA the precipitated and filtered effluent the effluent following both aeration and
carbon and the effluent from carbon adsorption only These values are compared to MCLs
and effluent discharge levels Only one carbon dose for the carbon only study the lowest
dose of 05 g carbon1000 ml groundwater is shown as a conservative example In both
cases using aeration and carbon and carbon alone organic contaminants were removed to
below MCLs and to below discharge levels Therefore aeration at an air-to-water ratio of
251 and a carbon dose of 05 g carbon1000 ml groundwater effectively removed volatile
organics semivolatile organics and PCBs from the groundwater
c It is expected that a maximum air-to-water ratio at 251 will be effective for an air stripper
onsite because full-scale air strippers are many times more efficient than the bench scale
models This is due to the greater surface area and turbulence found in the stripper The
off-gas from the air stripper will have to be treated to meet applicable standards either by a
catalytic oxidation unit or a vapor phase carbon adsorption system
Since no vinyl chloride was present in MW-IA and vinyl chloride is a difficult compound to
remove with carbon adsorption tests were performed with groundwater from ME-8 which
contained 210 xg1 vinyl chloride These results were presented in Table 1-13 which shows
that air stripping at an air-to-water ratio of 251 is effective in removing vinyl chloride In
order to reach the MCL of 2 figl for vinyl chloride an air stripper is required Carbon
adsorption alone would not remove vinyl chloride down to the MCL If the treated
groundwater is discharged to the Neponset River instead of being reinjected an air stripper
to remove vinyl chloride is not necessary since the discharge level is 111300 xg1
35 c
Table 1-19 shows a comparison between the organic concentrations in treatability study c effluents and effluent discharge levels based on discharge to Meadow Brook All volatile and
semivolatile organic compounds are removed to the effluent discharge levels It is
impossible to determine if PCBs were effectively removed since the most stringent discharge
level is 0014 xgL and the detection limit in the study is 01 xgL Discharge to Meadow
Brook may not be feasible due to 1) the treatability study cannot prove that PCBs are
removed to effluent discharge levels and 2) arsenic concentrations in the treated effluent
were higher than effluent discharge levels (based on a dilution factor of one)
The preliminary results of the sludge analysis indicate that the sludge is nonhazardous under
RCRA and TSCA Once the fiill scale groundwater treatment system is on line samples of
the sludge should be reanalyzed to confirm the preliminary results and to further assess the
disposal options
In summary the results of the treatability study indicate that groimdwater from the Norwood
PCB site can be treated effectively to allow discharge to either the Neponset River or r gtlaquo^ reinjection back into the aquifer If treated groundwater is reinjected the treatment plant
must include an air stripper to remove vinyl chloride If treated groundwater is discharged
to the Neponset River an air stripper is not necessary to meet discharge levels however the
use of Best Available Technology (BAT) may be required which would necessitate the
inclusion of an air stripper A cost comparison between an air stripper combined with
liquid-phase carbon versus liquid-phase carbon alone was performed and reported in the
Modeling Report The conclusion was there is not a significant difference in cost the
present worth assuming a discount factor of 8 and a 16-year period of perfonnance was
135 vs 102 million dollars (see Volume 2 Section 3) These costs will be evaluated
further during the design phase of the project The efficiracy at the full scale plant can be
optimized to ensure that at no time will the effluent from the plant exceed any applicable
groundwater or surface water standard
36 C
Section Two
c
c
20 ROCKS
21 Introduction and Objectives
There are several sources of rocks potentially contaminated with PCBs present on the Grant
Gear property portion of the Norwood PCB site Three different sources of rocks were
collected for analysis from the Grant Gear property The three rock sources included
overburden rocks from a trench west of the Grant Gear facility and below the interim
remedial cap crushed stone from the interim remedial cap west of the Grant Gear facility
and pea stone from the upper and lower roofs of the Grant Gear facility Throughout this
section rocks collected from on top of the interim remedial cap will be referred to as cap
rocks and overburden rocks wUl be referred to as trench rocks The rock collected from the
roof were analyzed under Work Plan 1 and are discussed in the Building Investigation
Report
The objective of this portion of the predesign work was threefold
bull To determine the PCB contamination if any on the different sources of rocks
bull To assess the feasibility of dry tumbling as a remedial altemative for the rocks
bull To assess the feasibility of water washing as a remedial altemative for the rocks
The dry tumblingwater washing was conducted on rocks that were reported to be too large
to be remediated with overburden soils by the solvent extraction technique
22 Description of Work
Samples of the three sources of rocks were collected by Metcalf amp Eddy personnel on
January 8-10 1992 Refer to Figure 1-1 for the locations of the trench and the cap rock
37 c
sampling points The samples were delivered to ENSECO laboratory in Cambridge
c Massachusetts and stored in a refrigerator at 4degC prior to sample preparation and analysis
Metcalf amp Eddy performed the sample preparation portion of the PCB analysis Rock
samples were weighed and gently placed in precleaned two liter glass beakers A quality
control surrogate compound was then added to each sample or method blank for subsequent
percent recovery determination The rocks were then immersed in extraction solvent
consisting of 30 percent acetone and 70 percent hexane by volume iEach sample and blank
was heated to 50degC and intermittently swirled by hand for a thirty minute extraction time
The extracts were then dried using sodium sulfate concentrated to 10 milliliters final volume
and submitted to ENSECO for PCB analysis using EPA SW846 Method 8080
The trench rocks were divided into three size categories with average diameters of one inch
two inches and three inches The rock size is an important consideration for the solvent
extraction remediation technique
^s^^ The three trench rock sizes and six cap rock samples were analyzed initially to determine the
extent of PCB contamination As outlined in the Quality Assurance Project Plan a second
portion of the cap rock sample with the highest initial PCB concentration was subjected to
water washing remediation and analyzed for PCBs Separate portions of the trench rock
samples were subjected to dry tumbling for ten and thirty minute intervals and water washing
for ten and thirty minute intervals The remediated rocks were then analyzed for PCBs
The dry tumbling and water washing were performed using an electronic rotary device The
rock samples were placed in clean two liter plastic sampling containers with screw cap
closures Laboratory distilled deionized water was poured into the water wash test
containers while the dry tumble samples had only the rocks enclosed
38 c
c 23 RESULTS
The one-inch average diameter trench rocks were initially contaminated with 1800 mgkg of
Aroclor 1254 Because the one-inch trench rocks were above the 10 mgkg cleanup standard
sample portions of the rocks were processed step by step through each of the four
remediations Although an eighty five percent reduction in PCB contamination was achieved
between the initial and final remediation samples the final concentration of 270 mgkg is still
well above the cleanup standard The results however showed a trend with the highest
concentration of PCBs detected on the initial sample lower PCB concentrations with the
ten-minute remediation and the lowest PCB concentrations achieved with the longest
thirty-minute remediation as expected The results for the one-inch trench rocks are
presented in Table 2-1
The two-inch average diameter rocks showed results similar to those of the one inch size
The initial sample had a concentration of 2500 mgkg of Aroclor 1254 The best
remediation result obtained was 450 mgkg for the ten-minute water wash sample A thirty c minute water wash sample for the two-inch trench rocks was not conducted when it became
apparent that a 10 mgkg cleanup level could not be obtained Because the 10 mgkg cleanup
level was not achievable the thirty minute water washing of two-inch rocks was not
conducted to minimize the level of effort and analytical costs The PCB result for the
thirty-minute dry screened sample 1900 mgkg Aroclor 1254 was higher than expected
This result was counter to the trend that was expected and observed with the one-inch rocks
and it demonstrates the non-homogenous nature of the rock samples This trend breaking
analytical result caused by the heterogenous or nonuniform nature of the rock sample matrix
was not repeated because the cleanup level could not be achieved The results for the
two-inch trench rock samples are presented in Table 2-1
The three-inch average diameter trench rocks yielded markedly different analytical results
The initial sample prepared with minimal on- site screening had a PCB concentration of
75 mgkg below the cleanup standard of 10 mgkg Although the initial result was below
39 c
TABLE 2-1 TRENCH ROCK WASHING RESULTS
Trench Rocks 1 inch Average Diameter
PCB Concentration
Sample mgKg
Initial sample 1800
Ten minute dry screened 620
Ten minute water wash 880
Thirty minute dry screened 290
Thirty minute water wash 270
Trench Rocks 2 inch Average Diameter
PCB Concentration
Sample mgKg
Initial sample 2500
Ten minute dry screened 490
Ten minute water wash 450
Thirty minute dry screened 1900
Trench Rocks 3 inch Average Diameter
PCB Concentration Sample mgKg
Initial sample 750
Ten min dry screened 210
Ten min water wash 025 UJ
Aroclor 1254 was the only PCB detected UJ - The sample was nondetect for PCBs to the estimated detection limit
of 025 mgKg
40
the cleanup standard it was close enough to warrant the first ten minute dry tumble c remediation step The first remediation step with a PCB concentration of 21 mgkg
confirmed that the three-inch trench rocks are less contaminated than their smaller
counterparts The three-inch ten-minute water washed sample was not submitted for fiill
quality control PCB analysis in an effort to minimize analytical costs The ten-minute water
washed sample result is from a partial quality control PCB screening analysis and is reported
as estimated Because of the lag time in tumaround of analytical results this sample had
been prepared extracted and screened and the information was available therefore it is
presented herein The results for the three inch average diameter rocks are presented in
Table 2-1
Six samples of cap rocks were collected and analyzed for PCBs AU of the results were less
than 02 mgkg or 200 xgkg For these cap rock samples an action level of 50 xgkg was
established in the Quality Assurance Project Plan The 50 xgkg value is an action level
established by EPA for this study only and is not a cleanup level identified in the ROD The
action if the results exceeded 50 igkg was to water wash the most highly PCB contaminated c sample Water washing was performed on cap rock sample number two The initial result
for this sample was 150 xgkg while the ten minute water washed sample yielded 24 igkg
Aroclor 1254 The cap rock results showed fairly consistent PCB concentrations in the range
of 50 to 150 igkg Aroclor 1254 The results are presented in Table 2-2
24 CONCLUSIONS
The cap rock samples were all determined to have PCB concentrations approximately one
hundred times less than the cleanup level of 10 mgkg Water washing conducted on the
most contaminated cap rock sample removed approximately eighty five percent of the PCBs
initially present These cap rock samples contained some fine soil like material which was
perhaps windblown carried on tmck tires or created by friction This material contributed
to the measured PCB concentrations for the cap rock samples
41 c
c TABLE 2-2 INTERIM REMEDIAL CAP ROCKS ANALYTICAL RESULTS
LOCAiSifi iiiiiiiiiiiiiii--iiiiiiiiiiiiiiiiiiiiidiiiiiiliiiiiiiii^ 10 minute Water Wash iiiii|ijii|iiii|iii^ PCB Concentration (ligKg)
1 120 NA
2 150 24
3 110 NA
4 31 U NA
5 86 NA
6 71 NA
Notes Aroclor 1254 was the only PCB detected U - Sample was nondetect for PCBs to the reported
detection limit - The highest initial PCB concentration cap rock sample was
subjected to a ten minute water wash remediation
42
C
The results of the rock tumbling and water washing demonstrate that this form of remediation r will not achieve the cleanup level of 10 mgkg for the one-inch and two-inch average
diameter overburden rocks The three inch rocks are below the cleanup level without
remediation It should be noted that these overburden rock samples were coUected from one
of the most highly contaminated areas at the site based on the remedial investigation results
These samples therefore represent worst case conditions
The dry tumbling remediation steps did not remove aU of the adhered soU particles as
anticipated This adhered highly PCB contaminated soU contributed to the measured rock
surface PCB concentration because the PCBs were extracted from the soU as weU as the rock
surface during sample preparation
The water wash remediation was effective in removing aU of the adhered soU The results
indicate that the rock surface and near surfaces have been contaminated with PCBs which
cannot be removed by water washing but are extractable with acetonehexane
c During the trench rock coUection ample one-inch and two-inch average diameter rocks were
avaUable at shaUow depths The trench had to be dug deeper to obtain the three inch size
rocks Because of the relative immobiUty of PCBs in soU the PCB concentration decreases
with depth as reported in the remedial investigation This decrease in PCB concentration
with depth is part of the explanation as to why the three inch rocks showed less
contamination than the smaUer sizes Also a factor is the surface area to mass ratio As the
mass of the rock increases the surface area to mass ratio decreases Since the PCBs are on
the surface or near surface of the rocks as the relative surface area decreases with size or
mass the reported concentration wiU decrease correspondingly
During the trench excavation and overburden rock coUection a two- to three-inch lens of
dark oUy appearing materials was observed This material was analyzed with a PCB field
screening kit and found to contain in excess of 10000 mgkg PCBs Some of the one and
two-inch diameter rocks sampled appeared dark in color Because it was not known whether
43 c
c
the dark rocks were naturaUy colored or from the tarry lens and to keep the study unbiased
these dark rocks were sampled randomly with the remaining rocks The dark appearing
rocks were estimated to comprise approximately five percent of the one and two-inch rock
sizes Inclusion of highly contaminated rocks in the samples would boost the reported PCB
concentrations
Altemative remedial measures other than rock tumbUng and water washing include detergent
and water washing organic solvent washing or steam cleaning Although preUminary
indications from the solvent extraction vendors are that only up to one inch size rocks can be
handled the possibiUty of designing a treatment system to handle larger rocks wiU be
explored during the design phase of this project If the size of the rocks precludes them
from remediation by solvent extraction along with contaminated soUds a rock cmsher wiU be
employed to reduce the contaminated rocks to a size that can be handled Although other
altematives for rock remediation might work solvent extraction with contaminated soUs or
rock cmshing foUowed by solvent extraction appear to be the easiest most cost effective
means to achieve the cleanup standards Whichever remedial altemative is selected rock
washing would only be necessary on rocks with average diameters between one and two
inches coUected from soU highly contaminated with PCBs A very rough estimate of rocks
onsite between one- and two-inch diameters is approximately 5000 tons No remediation of
the rocks is necessary if the solvent extraction technology can handle two-inch size rocks
44 c
c
c
TABLE 1-6 AERATION TEST OPERATIONS
Air to Water Ratio Volume Volume of by Volume of Water Air Reqd Min of Aeration
251 1000 ml 25000 ml 111 501 1000 ml 50000 ml 222 751 1000 ml 75000 ml 333
section of this report to minimize the loss of volatUes A total of twelve samples were mn
during this investigation The necessity of air stripping was investigated by comparing the
resuUs from four samples that were air stripped to seven samples that were treated identicaUy
with the exception of air stripping AU samples for the air stripping comparison went
through the precipitation filtration and carbon adsorption processes AdditionaUy one
sample was prepared with no carbon added to serve as an untreated sample The samples are
summarized in Table 1-7 Each groundwater sample was prepared and mixed with a
predetermined dose of Calgon powdered 325 mesh activated carbon and placed m an open
Erlenmyer flask on a shaker table for a two-hour time period at 180 rpm A rotary shaker
table capable of accommodating twelve (12)-1000 ml Erlenmyer flasks was used Effluent
was fUtered with a barrel filter using a glass-fiber pre-fUter and a Whatman 45 micron
membrane The effluent clear and odorless in aU cases was added to sample containers
preserved and packed for shipment to CLP laboratories Since the shaker table could
accommodate 12 flasks a total of approximately 4 gaUons of effluent was generated during
each mn Several mns were performed to generate adequate quantities of sample for
analysis accordmg to Table 1-7 Groundwater was simUarly prepared for submittal to
Aquatec Lab in Burlington Vermont for chronic toxicity testing Three (3) shipments of
approximately 2 gaUons each were made
r 16
C) o o TABLE 1-7 CLP TREATABILITY STUDY SAMPLING SUMMARY
Dose g of Carbon Required of mis in gs Carbon
Sample ID 1000 ml of GW Analysis Volume mis Flasks Flasks in each
Precipitation Filtration Aeration amp Carbon
AC-1 05 V SV MET 3400 3 1067 054 AC-2 20 V SV PCB 4400 4 1100 22 AC-3 50 V SV MET 3400 3 1133 57 AC-4 100 V SV PCB 4400 4 1100 110 AC-5 Trip Blank 0 V
Precipitation Filtration amp Carbon
C-0 0 V 500 1 500 0
C-1 05 V SV MET 3200 3 1067 053
c-2 10 V PCB 2200 2 1100 11
C-3 20 V SV CT 29000 24 1250 25
C-4 50 V SV PCB 4400 4 1100 55
C-17 70 V MET 1200 1 1200 70
C-18 100 V SV 2200 2 1100 110
C-13 Treatability Blank 0 V PCB 2200 0 0 0
C-20 Trip Blank 0 V 0
C-10 Duplicate of C-1 05 SV 2000 2 1000 05
C-1 05 (MSMSD) 500 1 500 025
C-11 Duplicate of C-1 05 MET 1000 1 1000 05
C-20 Duplicate of C-2 10 V PCB (MSMSD)
4400 4 1100 11
C-16 Duplicate of C-4 50 PCB 2000 2 1000 50
C-6 0 PCB 2000 2 1000 0
17
o o n TABLE 1-7 (Continued) CLP TREATABILITY STUDY SAMPLING SUMMARY
Dose g of Carbon Required of mis in gs Carbon
Sample ID 1000 ml of GW Analysis Volume mis Flasks Flasks in each
Precipitation amp Filtration
PPF-1 V SV MET PCB 2000 2 1000 0
Sludge
Sludge-1 0 MET PCB 0
V = VolatUe organics SV = Semivolatile organics MET = Metals PCB = Polychlorinated biphenyls CT = Chronic toxicity MSMSD = Matrix spikematrix spike dup D = DupUcate TB = Trip blank PPF = Precipitated and pressure filtered
(to minimize volatUes loss as opposed to vacuum filtration)
18
c
c
123 Results
1231 Precipitation Testing
Polymer Testing Preliminary polymer and coagulant testing was conducted to determine
the type of polymer and coagulant that could be employed to treat groundwater from the site
The Drewfloc polymer and the Drew CP-12 cationic coagulant were chosen as the most
effective types InitiaUy the effect of varying the pH of the groundwater sample was
investigated The resuUs of tests conducted at pH values of 80 90 and 100 are presented
on Table 1-8 As the pH value was raised the quaUty of the floe improved The sample
raised to a pH level of 100 with sodium hydroxide exhibited the best settling characteristics
based on the color turbidity soUds and the quaUty of the floe
The effects of varying the polymer dose was then investigated at pH=100 The cationic
coagulant added to a concentration of 30 ppm after pH adjustment and prior to polymer
addition produced the clearest supemate based on color turbidity and suspended soUds
results Table 1-8 also summarizes the results from this investigation
Jar Testing Four jar tests were performed to evaluate the effectiveness of chemical
precipitation for the removal of metals in groundwater from weU MW-IA The analytical
results from the jar test are presented in Table 1-9 The greatest metal reductions occurred
when the pH was 100 Samples for which the pH was adjusted with lime showed better
removal of barium manganese and sodium concentrations than those samples for which the
pH was adjusted with sodium hydroxide Samples for which the pH was adjusted with
sodium hydroxide showed greater declines in the concentrations of calcium and magnesium
No significant effect was observed on the removal of cobalt iron lead aluminum potassium
and zinc when lime or sodium hydroxide was used to raise the pH The observation that
samples for which the pH was adjusted with sodium hydroxide had elevated concentrations of
19 c
c TABLE 1-8 PRELIMINARY POLYMER TESTING RESULTS
Description of Supemate
Procedure pH ColorSoUds
mgl Turbidity
NTU Floe SettleabUity
Varymg pH
Raw Groundwater pH adjustedNaOH pH adjustedNaOH pH adjustedNaOH
62 80 90 100
YeUowbrownYeUowbrownYeUowbrownYeUowbrown
450 gt50 gt gt 5 0 gt gt50
58 SUght mst pin floe medium
gt medium
None Slow Faster Fastest
Varying polymer dose pH adjustment wNaOH
pH adjustedno polymer
100 YeUowbrown gt gt50 gt medium Fast
Above wpolymerat 1 ppm
100 Light yeUow lt 10 35 large 18 Fast
c Polymer at 5 ppm 100
Polymer at 1 ppm 100 wcoag 30 ppm
Light yeUow
Very Ught
lt 10
lt 10 yeUow
32
30
Large 18
Targe 18
Fast
Fast
n 20
o o n TABLE 1-9 F U L L - S C A L E TREATABILITY STUDY JAR T E S T R E S U L T S
Results in mgL
SAMPLE ID iiiiiiiiiiiiiiiiiiiiMW JAiSiiii iiiJTililiiiiiiiiiiii iiiJTil^iiiiiii iiiiiiiiiiTIi3iiiiiiiii iiiii^ii^li^iiiiiiiiiiiiii^iiri^iiiiisiiiiiiiiiiiiimii iiiiiJT4^iiiiiiiiiiiiiinP4i4iiiiiiiiiii iiiiiJT2iiliiiiiiiiiiiiT2^iiiiiii |i|S^ iiiiiiiiiiiiiiiiiiiiiiiiiiiiilM ii iiiiiiiiiiiiiiiiiiiiJlt iiiiiiiiii iiiiiiiiii-iiiiiiii iiiiiiiii=iiiiiiiiiiiiiliiiiii iiiiiiiiiiiiiiiiiiiiiiliiiiiiiiiiiiiiiiiiiiiiiiiiliiiiiiiiiiiiiM ii^iiiiiiiiiiiii6iiiiiiiiiiiiiiiiiiijqiiiiii mmsectlsectMimamp0^
Zinc 0488 002 U 002 U 002 U 002 U 002 U 002 U 002 U 002 U 002 U 002 U
E S A M P L E ID iiiiiiiiiiiiiiiiiiiiJT2i3iiiiiiiiiiiiiiiii ^T2-4iiiiiiiii iiiiiiiiJ^alliiiiiiiiiiiii iii^Ta^iiiiiiiiiiii iiiiiiiiit3|3iiiiiiiiiiiii iiilT3Tr4iiiiiiiiiiiiiii rrs-i iiiiiiiiiiiiiiJTSl iiiiiiiiiiiiiii iiiiiitJiJiiiiiiiiiii iiiiiiWs-4iiiiiiiiiiiii iiiiiiiJT5r-5ii|iiiiiiii
iiiiiiiiliiiiiiiiiiiiiiiiiBSsiii iiiiiiiiiiiiiiiiiiiiiilgtHiiiiiiiiiiii iiiiiiNaOHiiiiiiii iiiiiiiiiiii)iliimiiiiiiiii iiiiiiiiSiiriiiisiiiiiiiiii iiiiiiiiNiliiiiiiiiii iiiii iNapHiiiiiiiiiiiii iiiiiiiiiiiiiiiifloiiiiiiiii iiii^iiiiiiiiiii iiiiiiii NiitQHiiiiiiiii iiiiiiiiiWftOHiiiiiiii wmm iii^iiiiiiiisiiiiiiiAli|ilii iiiiiiiiiiixiiiiiEal3i iltgtoi PolyCoag C o a g u l a n t PolyCoag Coagulant iiiiiiii iiiiiii iiiiiii)|sihyii^iiiiiiii PolyCoag PolyCoag iiiPoij^iii^il ANALYTES Aerated KMn04
Barium 0073 0072 010 010 010 010 NA NA NA NA NA Calcium 247 247 571 574 273 277 NA NA NA NA NA Cobalt 001 U 001 U 0017 0018 0017 0019 NA NA NA NA NA Iron 01 U Ol U 016 023 016 043 NA NA NA NA NA Lead 0005 U 0005 U 0005 U 0005 U 0005 U 0005 U NA NA NA NA NA Magnesium 44 44 50 51 50 50 NA NA NA NA NA Manganese 35 33 43 43 44 44 063 086 099 094 14 Potassium 5 U 5 U 5 U 5 U 5 U 5 U NA NA NA NA NA Sodium 423 477 170 169 502 508 NA NA NA NA NA Zinc 002 U 002 U 0082 011 015 016 NA NA NA NA NA
Notes Only metals detected in untreated groundwater from MWIA are presented NA = Not Analyzed
U = undetected at specified detection limit JTI = Jar Test 1
c
c
sodium in the treated water was expected This is because sodium is a component of sodium
hydroxide Similarly the elevated concentrations of calcium observed in samples for
whichthe pH was adjusted wUh lime are due to the calcium component in lime Jar test 5
was conducted to assess the effect that precipitation and chemical oxidation had on the
removal of manganese and aluminum The results of this investigation are also presented in
Table 1-9 The results indicate that greater reductions of aluminum and manganese cannot
be achieved with aeration or by the addition of a chemical oxidant such as permanganate
A sample of the metal hydroxide sludge a residual that wiU be generated during the
groundwater treatment was analyzed for metals and PCBs This sample of sludge was
generated by treating contaminated groundwater with precipitation and filtration using the
optimum treatment parameters The metals results indicate that the sludge would not be
considered hazardous under RCRA using the toxicity characteristic leaching procedure
(TCLP) A TCLP was not performed on the sludge however based on 1) the concentration
of the metals in the sludge 2) assuming a 100 leachability and 3) incoiporating a 20-fold
dUution for a soUd matrix analyzed by TCLP this sludge would not be considered hazardous
under RCRA The PCB analysis of the sludge showed that Aroclor 1254 was the only
detected PCB at a concentration of 31 mgkg The TSCA limit for PCBs in waste is
50 mgkg indicating that this sludge would not be hazardous under TSCA The results for
this sludge represent a preliminary characterization and once the fuU scale treatment system
is on line the sludge analysis wiU need further testing to confirm these preliminary results
and to make a further assessment of the disposal options The analytical resuUs for the
sludge are presented in Table 1-10
1232 FUtration Testing A bench-scale filtration study was performed to determine the
optimum particle retention grade or mesh of filter media that could effectively remove the
suspended soUds in the precipitated groundwater The results of the analysis on the fUtrate
are presented in Table 1-11
n 22
c
c
TABLE 1-10 PRECIPITATED METAL HYDROXIDE SLUDGE RESULTS Results in mgkg
i||ipiiiii|iiiiiiiiiiiiiiiii^^iiiili|ii^^^ TCLP or TSCA L i n i l t s i Tfesi-iiiiiiiiiiiiiiisiiiiii^iiiiiiSvHiij^ in Solid Matrices ii iiiiS WM3KT2S
METALS
Aluminum Antimony Arsemc Barium Beryllium
Cadmium Calcium Chromium Cobalt Copper Iron Lead Magnesium Manganese Mercury Nickel Selenium Silver Sodium Thallium Vanadium Zinc
PCBs
Aroclor 1254
41100 231 195 346 5767
9120 338
25 114
39000 694 5260 2730
03313
04
8960 08
561446
31
U U
U
J
U U U R
U U J
J
NC NC 100
2000 NC 20
NC 100 NC NC NC 100 NC NC
4 NC 20
100 NC NC NC NC
50
Notes = TCLP Limits incorporated a 1 to 20 dilution factor for solid matrices Aroclor 1254 was the only PCB detected The remaining six Aroclors
were nondetect at a quantitation limit of 36 mgkg NC = No criteria exists for this compound U = Undetected at speciiied detection limit
L J = Estimated value due to validation criteria R = The result is rejected
23
c
c
TABLE 1-11 FILTRATION STUDY RESULTS
Media Rating Speed Suspended SoUds Turbidity
Raw 45 mgl 578 Course 10 um 200 mls5 sec lt5 mgl 16 NTU Medium 5 um 200 mls7 sec lt5 mgl 19 NTU Fine 1 um 200 mls23 sec lt5 mgl 18 NTU
Since there was virtuaUy no difference in the quaUty of effluents but substantial increase in
time to filter with the fine filter paper the medium 5 micron paper was chosen to prepare
sample for ftirther study
1233 Air Stripping Precipitated fUtered groundwater was aerated at 3 different air to
water ratios to evaluate the effectiveness of air stripping for the removal of volatUe organic
compounds in the groundwater Tables 1-12 and 1-13 shows the analytical results for
groundwater samples obtained from weUs MW-IA and ME-8 respectively No volatUe
organic compounds were detected in samples that were aerated at a 501 air to water ratio
Aeration of precipitated filtered groundwater obtained from weU ME-8 removed aU of the
vinyl chloride at an air to water ratio of 251
1234 Carbon Adsorption The effectiveness of carbon adsorption for the removal of
organic compounds in the groundwater was evaluated The analytical results are presented in
Table 1-14 At the lowest carbon dosage only 1 xg1 of cis-12-dichloroethene and
2 xg1 of trichloroethene remained No site-related volatUe organic compounds were detected
in samples which were treated with higher doses of carbon Toluene and
dibromochloromethane were detected in sample C-4 however these two compounds were
not detected in the raw groundwater and must therefore be a result of lab contamination
24 c
c TABLE 1-12 FULL SCALE TREATABILITY STUDY AIR STRIPPING RESULTS IN ugL FOR WELL MWIA
Methylene Chloride 10 u 4 U 5 U 5 U 4 U 4 U 2 U 4 U
cis-12-Dichloroethene 200 D 1 U 1 06 J 06 J 1 U 1 U 1 U
Chloroform 4 J 1 U 1 U 1 U 1 U 12 J 1 U 1 U
12-Dichloroethane 10 U 2 1 u 1 U 1 U 1 U 1 U 03 J
Carbon Tetrachloride 10 u 1 U 1 u 1 U 1 U 1 U 1 U 01 J
Trichloroethene 860 D 1 U 2 06 J 06 J 02 J 1 U 1 U
Toluene 10 U 020 J 1 U 1 U 1 U 007 J 25 1 U
Dibromochloromethane 10 U 1 U 1 U 1 U 1 U 1 U 14 1 U
Chlorobenzene 5 J 1 U 1 U 1 U 1 U 1 U 1 U 1 U
Ethylbenzene 10 U 1 U 1 U 1 U 1 U 1 U 1 U 1 U
Total Xylenes 1 J 1 U 1 U 1 U I U 1 U 1 U 1 U
Styrene 10 U 1 U 1 u 1 U 1 U 1 U 09 J 1 U
124-Trichloroben2ene 2400 D 4 1 u 1 U 1 U 1 U 1 U 1 U
123-Trichloroben2ene NA 5 1 u 1 U 1 U 1 U 1 U 1 U ^
SEMIVOLATILE ORG ANICS
Diethylphthalate 10 U 2 J 10 u 10 U 10 u Di-n-butylphthalate 10 U 1 J 10 u 10 U 10 u
Bis(2-ethylhexyl)phthal ate 10 U 10 U 10 u 4 J 2 J
Notes
Only volatile and semivolatile organics detected in any sample are included
No PCBs were detected in any effluent sample at a detection limit of 01 ugL influent was 36 J ugL
C-ID = Duplicate of C-1
U = Undetected at specified detection limit
J = Estimated value due to validation criteria
D = Duplicate
NA = Not Analyzed
= Value is for total 12-Dichlorocthene
i| f|iiiiiiiiiiiiiii^ti8ili| WSk
3 U 2 u 8 U
1 U 1 u 1 U
1 U 1 u 1 U
04 J 1 U 1 U
1 U 1 u 1 U
03 J 008 J 1 U
1 U 1 u 1 U
1 U 1 u 1 U
02 J 1 U 1 U
005 J 1 U 1 U
02 J OI J 1 u 1 U 1 U 1 u 1 U 1 U 1 u 1 U 1 U 1 u
10 U
10 u
2 J
27
c
The effectiveness of combining aeration and carbon adsorption to remove organic c contaminants was also investigated These results are also summarized in Table 1-15 No
organic compounds were detected m any of the samples generated during this investigation
124 Conclusions The results of the groundwater treatability study demonstrate that
treatment consisting of precipitation fUtration air stripping with vapor phase controls and
carbon adsorption appear able to meet cleanup levels estabUshed for the site Figure 1-3 is a
schematic representation of the proposed system The ROD stipulates that treated
groundwater wUl be reinjected to the aquifer onsite in this case MCLs are the cleanup
levels An altemative to be evaluated is discharging the treated groundwater to a surface
water body either Meadow Brook or the Neponset River In this case cleanup levels are
estabUshed as effluent discharge levels Effluent discharge levels are calculated by
multiplying the ambient water quaUty criteria (AWQC) values for each compound by a
dUution factor The dUution factor for the Neponset River is based on a 100-gpm treatment
discharge rate and a Neponset River 7010 of 2020 gpm The dUution factor for Meadow
Brook is 1 since the treatment discharge rate is greater than the flow of the brook therefore
effluent discharge levels for Meadow Brook are set at AWQC
Tables 1-16 through 1-19 compare effluent discharge levels for both the Neponset River and
Meadow Brook to carbon adsorption effluent from the groundwater treatability study
Table 1-16 summarizes the concentration of metals in untreated groundwater the metals
concentrations remaining foUowing precipitation and filtration the metals concentration
foUowing aeration and carbon adsorption the metals concentrations foUowing caition
adsorption only the MCLs and the effluent discharge levels based on discharge to the
Neponset River The only metal effluent concentration which exceeds the MCLs is
aluminum the MCL for aluminum however is a secondary MCL which is nonenforceable
No metals concentrations in the effluent exceed any of the effluent discharge levels
n 28
c TABLE 1-15 FULL-SCALE TREATABILITY STUDY AERATION AND CARBON ADSORPTION RESULTS Results in ugL
iiiiii|Mpt-HiiDiiii-iiiiii^iiiiiiiiiiii iii bullbullbull^(6-^1 iiiiii-iiiiiiiii iiiiiiiiii^g-2iiiiiiiiiii|i
l | | | ibyNigtii i i i i | i i i i i i i | ivi
VOLATILE ORGANICS
Mediylene Chloride 6 U 4 U Carbon Tetrachloride 1 U 01 J Toluene 02 J 1 u Total Xylenes 1 U 1 u Acetone 5 U 5 U 2-Butanone 5 U 5 U 2-Hexanone 5 U 5 U 4-Methy 1-2-pentanone 5 U 5 U Carbon Disulfide 1 U 1 U
c Notes Only volatile organics detected in any sample are included U = undetected at specified detection limit J = value is estimated due to validation criteria
iiiiiA61iiiiiiiiiiiii
3 U 1 U
02 J 01 J
5 U 5 J 5 U
5 U 1 U
i|AGii[ijiiifii
3 U U
01 J 1 U 5 U 5 U 5 U 5 U 1 U
i^^^iiiiiic|ii[|ili
10
1 u 1 u 1 u 5 U 5 J
5 U 5 U 1 U
29
c
o o o
o
Gas Phase GAC or Catalytic Oxidation
To ^ Ambient
Air
To Groundwater Recharge or
Raw Treated ) Neponset River Groundwater Groundwater Influent Holding Tank J
Solids for Offsite Disposal
(NOTE Air stripper not necessary if discharge to Neponset)
FIGURE 1-3 PROPOSED GROUNDWATER TREATMENT SYSTEM SCHEMATIC
2483JP
o n o TABLE 1-16 COMPARISON OF INORGANIC FULL-SCALE TREATABILITY STUDY RESULTS TO MCLS AND DISCHARGE LEVELS
[i^i^^^^ iiiiiiijiMf|iilaquo4 Precipitation Aeration and Carbon AdsorpUoi iiiiiiiiiiiiiiiiiiiiiiritliiiiin
iiiii iiSiiii|iiiiiiiiiiiiiiiii and Filtration M^ Iiiiiiiiiiiiii iiiiiiiii|iiii|i|iiiiiiiiiii liiiijlliiiii
iiiiiiiiiiiiiiiiiiiii iiiiiiiiiiiiii i i i i i i i|ii||iiiiiiiiiiiiiiiiiiiiiiiii iiiiiiiiiiiiiiiilii Giliii iiiii ii iiiii i iiiic iD|i laquoi|iiiiiiii iiiiitiiiiciiiiiiiiiiiii
Discharge levels calculated by multiplying AWQC by a dilution factor based on a 100 gpm treatment discharge rate and a Neponset River 7Q10 of 2020 gpm
U = Undetected at specified detection limit
J = Estimated value due to validation criteria
NC = No criteria exists for the compound
P = Proposed MCL
S = Secondary MCL
n n o TABLE 1-17 COMPARISON OF INORGANIC FULL-SCALE TREATABILITY STUDY RESULTS TO MCLS AND DISCHARGE LEVELS
DISCHARGE TO MEADOW BROOK
[isjiiiiiiiiiiiiiiii-ii |iiiiiiiiiiiiiiiiiiiiiiiiiiiiiiiiiiiiiiiiiiiiiii iiiiiiiiiiiiiiiiiiiiiiiiiiiiii iiiiiiiiiiiiiiiiiiiiiiii- iiiiiiiiiiiiiiiiiiiiiiiiiiiiiiiiii ^iiiiiiiiiiiiiiiiiiiiiiiiiiiiiiiiii bull immMmii^^ F- piiiipiiiiil i i i i i i i i i i i AcraUon and Caibon AdsorpUon iii iii iiii i i i i l l l i i i i i i ^ ^ i p t ^ sectffllM^ ^ ^
Ajumin iw u i 358 bull490 z ii 240 i--lJi iiiiiiiiiiiJ^3iiitJi i i iii i3 lliiiiiiiiii iiii|ii]^(Ciiiiiiiiiii-iii-iiiiiiii5iiiii-iiiiiiiiNC^ Antimony 2i ij NA 44 U i44 U 44 U 44 U 44 U 10 P 88 30 8600
Ariseiaic- iiiiiiiiiiiiiiiiiiiiii8iiiiiiiiiiiiiii iiiiiiiiii-iis- - iiiiiiiiii- 1 u 71 J i-iiiiiy3|ili-uj - i i i 9 l i j i iii--5Qiiiiiiiiiiiiii iiiiii NC- NC - iL | Barium 247 32 106 U 65 U 597 49 U 131 IJ 2006 NC NC NC
Blaquoay|Hiiraquosi-- bullbullbull--bull i-iiiii-iiiiii3iiiiiiliiiiiiii -iiiiiiiiiiiNAi-iiiiiii I u -- 1 U iiiiiiiiiliilliiiiii-ii|iyi- iiiii iiiiiiiiiiiiiiiiii ii|i|40 - 53-bullbull13|shyCadmium ( S i u bull bull bull bull bull bull bull bull bull N A 4 UJ 4 UJ bullr^^ 4UJ 4UJ 5 682 038 170 Cai lc turn i bull- iiiiii3PiOCfiii iiiiiiiiiiii iiiiiiiiii^iiiiiiiiiiiiii 9650 i 8360 iiii7886iiiiiiiiiiiiiiiiiiiiiiii^iiiiiiii-ii6^^ iiiiii5isNltiiiiiiiiiiiiiiiiiii iiiiiiNC NGi NC Chromium 315 NA 8 J 7 UJ 7 u j 7 uj 7 iirj 160 16 11 3206
CO i-iii-iiii 33iitiii-iiiiii ii-iiiii-i-Jfiiiiii--iiii - bull bull 4 U Z 4 U- iiiiiiiiiiiiiilii-uiiiiiiiiiiiiiiiiiiiiiii4iitjiii-iiiiiiiiiii4 iiiiii-ii Nltiiiiiiiiiiiiiiiiiiiiii i l i iNc-- -NCi^-NCi
P ^ i bull bull Copper 6 4 i NA 128 U 179 U bull64Uj 9 U --256--u-- 1300 48 36 NC
Jtaa- iiiiiiiiiiii ltJOlt iiiiiiiiiii isiiiiiiiJQiii-i - z 6AS U ii232U-^^ bulliiiiiiiiiiiiiiiiiiiiuiiiiiiiiiiiiiiiiiiiiiiiiiiiiiiiiiii2 ipit|iiiiii iiiiii3pQiiiiJiiiilii liiiNC- v 1000- bull- NCi head 253 5^U^ 35 U 46 U 21 U 12 U J 2^4 u 14 054 NCis |Magnlaquoaiuiai iiiiiiiiiiilaquo)6iiiiiiiiiiiii iiiiiiiiiiii|lS)6iiiiiiiiiiiiii 3700 7060i V^ bulliiiMiiiiiiiiiiiiiiiiiii3Jpiiiiiii7^0iiiii^^^ i iiigtKSiiiiiiiiiiiiiiii bulliii I N C bull N C Ncjii Manganese 4810 bull356 62 U 18 UJ 23 U 35 U 53 U 56 S NC NC 106
Wtercuryi iiiiiiiiiiiiiiiiiiiiiiiiyiiiMiiiiiii iiiiiiiiiiiiiiiiiNAiiiiiii i P-2 U bullbull 0 2 U-- iiiiiiiiiiiiiiiiOi|iiittiiiiiii|iiiii 6iiiiit|iiiiiiiiiiiiiQ|iit|iiiiii iiiii|i|iiiiiiiiiii iiii|iii24- -- oon --0i|i Nickel 281 isrA 181 UJ 244 UJ 269 uil 17 U 356 il 166 P 643 33 3800
Potraquoslaquolum -iiiiiiiiiii4liS0iiiiiiiiii iiiiiiiiiiiii PPQiiiiU i 2200 U i ii 2620 XT | |i |owiiyiiiiii | |(^iiiiiiiiiii^ iiiiiiiiiiiiiiiW|iiiiiiiiiiiiii iii iii|ip--i NC- bullbullbull-KCii Selenium 20 U NA 32 U 13 UJ 1 6 u 1 UJ i u 5 6 266 50 6800 Sflycri i-i- iiiiiiiiiiiiiiiiiiiiiiiiiiiiiiiiiiiiiii iiiiiiiiiiiiiiiiiii iiii- i-4U bull -^M- U iii bull i i i i | | i | | i i i i |-i i | i | l | i i i i | i i i i iiiii-i ^66iiiiiiiiiiiiiii i|iP37 -0i2iNi Sodium 1 2 3 6 6 6 9 5 5 6 6 99000 lOlOOO 99866 106066 74566 NC NC NC NC
I m iiiiiiiiiiiiiiiiiiiiii||jriiiiii||iii|i|iii|| | ii46Q ^40- -bull-3iThaUJiiiitt - iiiiiiiiiiiiiiiiiiiiiiiiiiliiiiiiiiii iiiiiiiiiiiiiiNAii- I UJ ^ iiiiiiiiiiiiiiiiii Vanadium 439 NA 5 U 83 UJ 5 U 5 IJ 0 IJJ NC NC NC NC
Ziiicii^ iiiiiiii-iiiii- 488iiiiiiiiiiiiii iiiiiiiiiiii6iiu 151 U 67 UJ iiiii iiiiiiiiiiiiiiiil52iU- iiiiiiiii2 liiiiiiiiiii iiJiOQ()ii- Siiiiiiii iiiiiiiiii|6 bull bull33 - N C i
Notes
Discharge levels are AWQC (10-5 risk) since the treatment discharge rate of 100 gpm is higher than the flowrate of Meadow Brook
U = Undetected at specified detection limit
J = Estimated value due to validation criteria
NC = No criteria eus ts for the compound
P = Proposed MCL
S = Secondary MCL
o n o TABLE 1-18 COMPARISON OF ORGANIC FULL-SCALE TREATABILITY STUDY RESULTS TO MCLS AND DISCHARGE LEVELS - DISCHARGE TO THE NEPONSET RIVER
||x|o | bull iiii||i||il|A iiiiii iiiiiiiiliiiiiiiiiiili ii5iiPo|laquo|o|i iii||l|i|i||ii||y E^ly1 C DoteslOO ii i^i|raquoiiipltii=(iiiii|iii iiii i i w i M w iiiiiiilliHiJLYiiii iiiiWiiiiii iiiiiiiiiiiiii ii iiiiiiiiiiiiiiiiiiii iiiiii iiii iiiiiiiiiii iiiiiiiiiiiiiiiiii iiiiiiiiiililiiiiiiiiiliiiiii bulliiiiii lagaiiiiiiiii iiiiiiiiiiiiiiiiiiiiiiiiiiiiiiiii (ugL) iiiiiiii^iiiiiiiiii iiiiiiiiiiiiipiiiii iiUiiiiiii^ WmnKiiiiiii i(iiiiiiii i iii iiiiiiiiiiMiiiiii VOLATILE ORGANICS
112-Trichlorocthane 5 J 25 U 1 u 1 u 1 U 1 u 1 u 5 NC NC 8904
1122-TetrachIororthane 16 J 25 U 1 u I u I U 1 u 1 u NC NC 50880 2332
Chloroform 4 J 25 U 1 u 1 u 1 U I u 1 u NC 612680 26288 3328
Vinyl Chloride 10 U 50 U I u 1 u 1 u 1 u 1 u 2 NC NC 111300
11-DichIoroethene 10 U 25 U 1 u 1 u 1 u I u 1 u 7 245920 0 403
12-Dichloroethene (total) 200 D 97 1 u 1 u 1 u 1 u 1 70 245920 NC 29680000
Trichloroethene 860 D 430 1 u I u 1 u 1 u 2 5 954000 464280 19504
Tetrachloroethene 5 J 25 U 1 u I u 1 u 1 u 1 u 5 111936 17808 1876
Xylenes (total) 1 J 25 U 1 u 1 u 01 J 1 u I u lOOOO NC NC NC
Chlorobenzene 5 J 25 U 1 u 1 u 1 u 1 u I U NC NC NC NC
SEMIVOLATILE ORGANICS
Pentachlorophenol 25 U ND 25 U 25 U 25 U 25 U 25 U I 424 276 NC
Chlorobenzenes(total) 5300 1060 NC
13-Dichlorobenzene 3 J 2 10 U 10 U 10 U 10 U 10 U 600 NC NC 55120
14-Dichlorobenzene 17 9 10 U 10 U 10 U 10 U 10 U 75 NC NC 55120
12-Dichlorobciizcne 7 J 5 10 U 10 U 10 U 10 U 10 U 600 NC NC 360400
124-Trichlorobenzene 2400 D 50 10 u 10 u 10 U 10 u 10 U 9 5300 1060 NC
PESTICIDESPCBS
Arocloi-1254 36 J 32 NA 01 u NA OI u NA 05 42 03 01
Heptachlor 0074 J NA NA NA NA NA NA 04 11 01 01
Aldrin 017 J NA NA NA NA NA NA NC 64 NC 002
Heptachlor Epoxide 0045 J NA NA NA NA NA NA 02 NC NC NC
gamma-Chlordane 0056 J NA NA NA NA NA NA 2 51 OI 01
Notes
Discharge levels calculated by multiplying AWQC (10-S risk) by a dilution factor based on a 100 gpm treatment discharge rate and a Neponset River 7Q10 of 2020 gpm
Compounds presented are only those detected in the untreated groundwater sample
NA = Not analyzed J = Estimated value due to validation criteria
NC = No criteria exists for the compound D = The reported value is from the diluted analysis
U = Undetected at specified detection limit P = Proposed MCL
o n o TABLE 1-19 COMPARISON OF ORGANIC FULL-SCALE TREATABILITY STUDY RESULTS TO MCLS AND DISCHARGE LEVELS - DISCHARGE TO MEADOW BROOK
i 1 liiiisisi i ii iii iii|i|i i l i 11 i |ii^^ i i i i i i i i iiiiiiiiiiiiiiiiii iiiiiiiiiiiiieiciidiiiiii iiiiiiiiiiiiii iiiiiliiiiiii^^iiiiii iiiiiiiiiiiiiiiiiiii iiliiiii i iiiiipiiiliiiiiiiliiii iiiiiiiiiiiiiiiiii iiiii|iii|i|i-iiiiii iiAVQiii|iiiii i ii-iiiiiiigt-iiii ^^
iiiiiiiiiiiiiiii iiiiiiiiiiiiiiiiiiiiiiiiiiiiii iiiiiiiiiiiiiiiiiiiiii I i i i i i i i i||i|i|||iiiiiiiiiiiiiiii|iiii iii-|iiilaquo|i3[i|ii |||^|ii^|i|^|iii i (3 i i ^ ^ l i i illjliii^jiii^ iieip|i(iii|i iiiiiiiiiiiiiiiiiiii i^|iii|(iiiijiii|)|r^ iiii-iiliiiiiiiiiiiii ||i |illlli|i i|li|i|ii iiiiiiiiiiiiiiiiii iiiiiiiiiii|tiiiiiiiiiiiiiiiiiii iiiiiiiiiiiifiiiiiiiiii iiiiiiiiiiiiiiiiilaquoiiiiiii iiiiiiiiiiilliiiiiiiiiiiiiiii i (laquoy^ iiiiiiiiiiiii(Wiiiiiiiii iiiiiiiii i lK^ iiiiiiiiliiiiiiiiiiiiiiiii (ugl)iii iiMiiiiiii VOLATILE ORGANICS
112-Trichloroethane 5 J 25 U 1 u 1 u 1 u 1 u 1 u 5 NC NC 420
1122-Tetrachloroethane 16 J 25 U 1 u 1 u 1 u 1 u 1 u NC NC 2400 110
Chloroform 4 J 25 U 1 u 1 u 1 u I u 1 u NC 28900 1240 157
Vinyl Chloride 10 u 50 U 1 u 1 u 1 u 1 u I u 2 NC NC 5250
11-Dichloroethene 10 u 25 U 1 u 1 u 1 u I u 1 u 7 11600 NC 19
12-Dichlorocthene (total) 200 D 97 1 u I u 1 u 1 u 1 70 11600 NC 1400000
Trichloroethene 860 D 430 1 u 1 u 1 u I u 2 5 45000 21900 920
Tetrachloroethene 5 J 25 U 1 u 1 u 1 u 1 u 1 U 5 5280 840 89
Xylenes (total) 1 J 25 U 1 u 1 u 01 J I u I U 10000 NC NC NC
Chlorobenzene 5 J 25 U 1 u 1 u 1 u 1 u I u NC NC NC NC
SEMIVOLATILE ORGANICS
Pentachlorophenol 25 U ND 25 U 25 U 25 U 25 U 25 U 1 20 13 NC
Chlorobenzenes(total) 250 50 NC
13-Dichlorobcnzene 3 J 2 10 U 10 U 10 u 10 U 10 U 600 NC NC 2600
14-Dichlorobenzene 17 9 10 U 10 U 10 u 10 U 10 U 75 NC NC 2600
12-Dichlorobenzene 7 J 5 10 U 10 U 10 u 10 U 10 U 600 NC NC 17000
124-Trichlorobenzene 2400 D 50 10 u 10 u 10 u 10 u 10 U 9 250 50 NC
PESTICIDESPCBS
Aroclor-1254 36 J 32 01 u 01 u OI u OI u NA 05 20 0014 00045
Heptachlor 0074 J NA NA NA NA NA NA 04 052 00038 00029
Aldrin 017 J NA NA NA NA NA NA NC 3 NC 000079
Heptachlor Epoxide 0045 J NA NA NA NA NA NA 02 NC NC NC
gamma-Chlordane | 0056 J NA NA NA NA NA NA 2 24 00043 00048
Notes
Discharge levels are AWQC (10-5 risk) since the treatment discharge rate of 100 gpm is higher than the flowrate of Meadow Brook
Compounds presented are only those detected in the untreated groundwater sample
NA = Not analyzed J = Estimated value due to validation criteria
NC = No criteria exists for the compound D = The reported value is from the diluted analysis
U = Undetected at specified detection limit P = Proposed MCL
Table 1-17 shows a comparison of effluent to effluent discharge levels based on discharge to c Meadow Brook assuming a dilution factor on one If the treated groundwater was discharged
to Meadow Brook effluent discharge levels for arsenic would be exceeded Since arsenic is
a difficult compound to remove in a groundwater treatment plant it is concluded that
Meadow Brook may not be usable as a discharge point
Table 1-18 presents concentrations of organic contaminants in untreated groundwater from
MW-IA the precipitated and filtered effluent the effluent following both aeration and
carbon and the effluent from carbon adsorption only These values are compared to MCLs
and effluent discharge levels Only one carbon dose for the carbon only study the lowest
dose of 05 g carbon1000 ml groundwater is shown as a conservative example In both
cases using aeration and carbon and carbon alone organic contaminants were removed to
below MCLs and to below discharge levels Therefore aeration at an air-to-water ratio of
251 and a carbon dose of 05 g carbon1000 ml groundwater effectively removed volatile
organics semivolatile organics and PCBs from the groundwater
c It is expected that a maximum air-to-water ratio at 251 will be effective for an air stripper
onsite because full-scale air strippers are many times more efficient than the bench scale
models This is due to the greater surface area and turbulence found in the stripper The
off-gas from the air stripper will have to be treated to meet applicable standards either by a
catalytic oxidation unit or a vapor phase carbon adsorption system
Since no vinyl chloride was present in MW-IA and vinyl chloride is a difficult compound to
remove with carbon adsorption tests were performed with groundwater from ME-8 which
contained 210 xg1 vinyl chloride These results were presented in Table 1-13 which shows
that air stripping at an air-to-water ratio of 251 is effective in removing vinyl chloride In
order to reach the MCL of 2 figl for vinyl chloride an air stripper is required Carbon
adsorption alone would not remove vinyl chloride down to the MCL If the treated
groundwater is discharged to the Neponset River instead of being reinjected an air stripper
to remove vinyl chloride is not necessary since the discharge level is 111300 xg1
35 c
Table 1-19 shows a comparison between the organic concentrations in treatability study c effluents and effluent discharge levels based on discharge to Meadow Brook All volatile and
semivolatile organic compounds are removed to the effluent discharge levels It is
impossible to determine if PCBs were effectively removed since the most stringent discharge
level is 0014 xgL and the detection limit in the study is 01 xgL Discharge to Meadow
Brook may not be feasible due to 1) the treatability study cannot prove that PCBs are
removed to effluent discharge levels and 2) arsenic concentrations in the treated effluent
were higher than effluent discharge levels (based on a dilution factor of one)
The preliminary results of the sludge analysis indicate that the sludge is nonhazardous under
RCRA and TSCA Once the fiill scale groundwater treatment system is on line samples of
the sludge should be reanalyzed to confirm the preliminary results and to further assess the
disposal options
In summary the results of the treatability study indicate that groimdwater from the Norwood
PCB site can be treated effectively to allow discharge to either the Neponset River or r gtlaquo^ reinjection back into the aquifer If treated groundwater is reinjected the treatment plant
must include an air stripper to remove vinyl chloride If treated groundwater is discharged
to the Neponset River an air stripper is not necessary to meet discharge levels however the
use of Best Available Technology (BAT) may be required which would necessitate the
inclusion of an air stripper A cost comparison between an air stripper combined with
liquid-phase carbon versus liquid-phase carbon alone was performed and reported in the
Modeling Report The conclusion was there is not a significant difference in cost the
present worth assuming a discount factor of 8 and a 16-year period of perfonnance was
135 vs 102 million dollars (see Volume 2 Section 3) These costs will be evaluated
further during the design phase of the project The efficiracy at the full scale plant can be
optimized to ensure that at no time will the effluent from the plant exceed any applicable
groundwater or surface water standard
36 C
Section Two
c
c
20 ROCKS
21 Introduction and Objectives
There are several sources of rocks potentially contaminated with PCBs present on the Grant
Gear property portion of the Norwood PCB site Three different sources of rocks were
collected for analysis from the Grant Gear property The three rock sources included
overburden rocks from a trench west of the Grant Gear facility and below the interim
remedial cap crushed stone from the interim remedial cap west of the Grant Gear facility
and pea stone from the upper and lower roofs of the Grant Gear facility Throughout this
section rocks collected from on top of the interim remedial cap will be referred to as cap
rocks and overburden rocks wUl be referred to as trench rocks The rock collected from the
roof were analyzed under Work Plan 1 and are discussed in the Building Investigation
Report
The objective of this portion of the predesign work was threefold
bull To determine the PCB contamination if any on the different sources of rocks
bull To assess the feasibility of dry tumbling as a remedial altemative for the rocks
bull To assess the feasibility of water washing as a remedial altemative for the rocks
The dry tumblingwater washing was conducted on rocks that were reported to be too large
to be remediated with overburden soils by the solvent extraction technique
22 Description of Work
Samples of the three sources of rocks were collected by Metcalf amp Eddy personnel on
January 8-10 1992 Refer to Figure 1-1 for the locations of the trench and the cap rock
37 c
sampling points The samples were delivered to ENSECO laboratory in Cambridge
c Massachusetts and stored in a refrigerator at 4degC prior to sample preparation and analysis
Metcalf amp Eddy performed the sample preparation portion of the PCB analysis Rock
samples were weighed and gently placed in precleaned two liter glass beakers A quality
control surrogate compound was then added to each sample or method blank for subsequent
percent recovery determination The rocks were then immersed in extraction solvent
consisting of 30 percent acetone and 70 percent hexane by volume iEach sample and blank
was heated to 50degC and intermittently swirled by hand for a thirty minute extraction time
The extracts were then dried using sodium sulfate concentrated to 10 milliliters final volume
and submitted to ENSECO for PCB analysis using EPA SW846 Method 8080
The trench rocks were divided into three size categories with average diameters of one inch
two inches and three inches The rock size is an important consideration for the solvent
extraction remediation technique
^s^^ The three trench rock sizes and six cap rock samples were analyzed initially to determine the
extent of PCB contamination As outlined in the Quality Assurance Project Plan a second
portion of the cap rock sample with the highest initial PCB concentration was subjected to
water washing remediation and analyzed for PCBs Separate portions of the trench rock
samples were subjected to dry tumbling for ten and thirty minute intervals and water washing
for ten and thirty minute intervals The remediated rocks were then analyzed for PCBs
The dry tumbling and water washing were performed using an electronic rotary device The
rock samples were placed in clean two liter plastic sampling containers with screw cap
closures Laboratory distilled deionized water was poured into the water wash test
containers while the dry tumble samples had only the rocks enclosed
38 c
c 23 RESULTS
The one-inch average diameter trench rocks were initially contaminated with 1800 mgkg of
Aroclor 1254 Because the one-inch trench rocks were above the 10 mgkg cleanup standard
sample portions of the rocks were processed step by step through each of the four
remediations Although an eighty five percent reduction in PCB contamination was achieved
between the initial and final remediation samples the final concentration of 270 mgkg is still
well above the cleanup standard The results however showed a trend with the highest
concentration of PCBs detected on the initial sample lower PCB concentrations with the
ten-minute remediation and the lowest PCB concentrations achieved with the longest
thirty-minute remediation as expected The results for the one-inch trench rocks are
presented in Table 2-1
The two-inch average diameter rocks showed results similar to those of the one inch size
The initial sample had a concentration of 2500 mgkg of Aroclor 1254 The best
remediation result obtained was 450 mgkg for the ten-minute water wash sample A thirty c minute water wash sample for the two-inch trench rocks was not conducted when it became
apparent that a 10 mgkg cleanup level could not be obtained Because the 10 mgkg cleanup
level was not achievable the thirty minute water washing of two-inch rocks was not
conducted to minimize the level of effort and analytical costs The PCB result for the
thirty-minute dry screened sample 1900 mgkg Aroclor 1254 was higher than expected
This result was counter to the trend that was expected and observed with the one-inch rocks
and it demonstrates the non-homogenous nature of the rock samples This trend breaking
analytical result caused by the heterogenous or nonuniform nature of the rock sample matrix
was not repeated because the cleanup level could not be achieved The results for the
two-inch trench rock samples are presented in Table 2-1
The three-inch average diameter trench rocks yielded markedly different analytical results
The initial sample prepared with minimal on- site screening had a PCB concentration of
75 mgkg below the cleanup standard of 10 mgkg Although the initial result was below
39 c
TABLE 2-1 TRENCH ROCK WASHING RESULTS
Trench Rocks 1 inch Average Diameter
PCB Concentration
Sample mgKg
Initial sample 1800
Ten minute dry screened 620
Ten minute water wash 880
Thirty minute dry screened 290
Thirty minute water wash 270
Trench Rocks 2 inch Average Diameter
PCB Concentration
Sample mgKg
Initial sample 2500
Ten minute dry screened 490
Ten minute water wash 450
Thirty minute dry screened 1900
Trench Rocks 3 inch Average Diameter
PCB Concentration Sample mgKg
Initial sample 750
Ten min dry screened 210
Ten min water wash 025 UJ
Aroclor 1254 was the only PCB detected UJ - The sample was nondetect for PCBs to the estimated detection limit
of 025 mgKg
40
the cleanup standard it was close enough to warrant the first ten minute dry tumble c remediation step The first remediation step with a PCB concentration of 21 mgkg
confirmed that the three-inch trench rocks are less contaminated than their smaller
counterparts The three-inch ten-minute water washed sample was not submitted for fiill
quality control PCB analysis in an effort to minimize analytical costs The ten-minute water
washed sample result is from a partial quality control PCB screening analysis and is reported
as estimated Because of the lag time in tumaround of analytical results this sample had
been prepared extracted and screened and the information was available therefore it is
presented herein The results for the three inch average diameter rocks are presented in
Table 2-1
Six samples of cap rocks were collected and analyzed for PCBs AU of the results were less
than 02 mgkg or 200 xgkg For these cap rock samples an action level of 50 xgkg was
established in the Quality Assurance Project Plan The 50 xgkg value is an action level
established by EPA for this study only and is not a cleanup level identified in the ROD The
action if the results exceeded 50 igkg was to water wash the most highly PCB contaminated c sample Water washing was performed on cap rock sample number two The initial result
for this sample was 150 xgkg while the ten minute water washed sample yielded 24 igkg
Aroclor 1254 The cap rock results showed fairly consistent PCB concentrations in the range
of 50 to 150 igkg Aroclor 1254 The results are presented in Table 2-2
24 CONCLUSIONS
The cap rock samples were all determined to have PCB concentrations approximately one
hundred times less than the cleanup level of 10 mgkg Water washing conducted on the
most contaminated cap rock sample removed approximately eighty five percent of the PCBs
initially present These cap rock samples contained some fine soil like material which was
perhaps windblown carried on tmck tires or created by friction This material contributed
to the measured PCB concentrations for the cap rock samples
41 c
c TABLE 2-2 INTERIM REMEDIAL CAP ROCKS ANALYTICAL RESULTS
LOCAiSifi iiiiiiiiiiiiiii--iiiiiiiiiiiiiiiiiiiiidiiiiiiliiiiiiiii^ 10 minute Water Wash iiiii|ijii|iiii|iii^ PCB Concentration (ligKg)
1 120 NA
2 150 24
3 110 NA
4 31 U NA
5 86 NA
6 71 NA
Notes Aroclor 1254 was the only PCB detected U - Sample was nondetect for PCBs to the reported
detection limit - The highest initial PCB concentration cap rock sample was
subjected to a ten minute water wash remediation
42
C
The results of the rock tumbling and water washing demonstrate that this form of remediation r will not achieve the cleanup level of 10 mgkg for the one-inch and two-inch average
diameter overburden rocks The three inch rocks are below the cleanup level without
remediation It should be noted that these overburden rock samples were coUected from one
of the most highly contaminated areas at the site based on the remedial investigation results
These samples therefore represent worst case conditions
The dry tumbling remediation steps did not remove aU of the adhered soU particles as
anticipated This adhered highly PCB contaminated soU contributed to the measured rock
surface PCB concentration because the PCBs were extracted from the soU as weU as the rock
surface during sample preparation
The water wash remediation was effective in removing aU of the adhered soU The results
indicate that the rock surface and near surfaces have been contaminated with PCBs which
cannot be removed by water washing but are extractable with acetonehexane
c During the trench rock coUection ample one-inch and two-inch average diameter rocks were
avaUable at shaUow depths The trench had to be dug deeper to obtain the three inch size
rocks Because of the relative immobiUty of PCBs in soU the PCB concentration decreases
with depth as reported in the remedial investigation This decrease in PCB concentration
with depth is part of the explanation as to why the three inch rocks showed less
contamination than the smaUer sizes Also a factor is the surface area to mass ratio As the
mass of the rock increases the surface area to mass ratio decreases Since the PCBs are on
the surface or near surface of the rocks as the relative surface area decreases with size or
mass the reported concentration wiU decrease correspondingly
During the trench excavation and overburden rock coUection a two- to three-inch lens of
dark oUy appearing materials was observed This material was analyzed with a PCB field
screening kit and found to contain in excess of 10000 mgkg PCBs Some of the one and
two-inch diameter rocks sampled appeared dark in color Because it was not known whether
43 c
c
the dark rocks were naturaUy colored or from the tarry lens and to keep the study unbiased
these dark rocks were sampled randomly with the remaining rocks The dark appearing
rocks were estimated to comprise approximately five percent of the one and two-inch rock
sizes Inclusion of highly contaminated rocks in the samples would boost the reported PCB
concentrations
Altemative remedial measures other than rock tumbUng and water washing include detergent
and water washing organic solvent washing or steam cleaning Although preUminary
indications from the solvent extraction vendors are that only up to one inch size rocks can be
handled the possibiUty of designing a treatment system to handle larger rocks wiU be
explored during the design phase of this project If the size of the rocks precludes them
from remediation by solvent extraction along with contaminated soUds a rock cmsher wiU be
employed to reduce the contaminated rocks to a size that can be handled Although other
altematives for rock remediation might work solvent extraction with contaminated soUs or
rock cmshing foUowed by solvent extraction appear to be the easiest most cost effective
means to achieve the cleanup standards Whichever remedial altemative is selected rock
washing would only be necessary on rocks with average diameters between one and two
inches coUected from soU highly contaminated with PCBs A very rough estimate of rocks
onsite between one- and two-inch diameters is approximately 5000 tons No remediation of
the rocks is necessary if the solvent extraction technology can handle two-inch size rocks
44 c
c
c
123 Results
1231 Precipitation Testing
Polymer Testing Preliminary polymer and coagulant testing was conducted to determine
the type of polymer and coagulant that could be employed to treat groundwater from the site
The Drewfloc polymer and the Drew CP-12 cationic coagulant were chosen as the most
effective types InitiaUy the effect of varying the pH of the groundwater sample was
investigated The resuUs of tests conducted at pH values of 80 90 and 100 are presented
on Table 1-8 As the pH value was raised the quaUty of the floe improved The sample
raised to a pH level of 100 with sodium hydroxide exhibited the best settling characteristics
based on the color turbidity soUds and the quaUty of the floe
The effects of varying the polymer dose was then investigated at pH=100 The cationic
coagulant added to a concentration of 30 ppm after pH adjustment and prior to polymer
addition produced the clearest supemate based on color turbidity and suspended soUds
results Table 1-8 also summarizes the results from this investigation
Jar Testing Four jar tests were performed to evaluate the effectiveness of chemical
precipitation for the removal of metals in groundwater from weU MW-IA The analytical
results from the jar test are presented in Table 1-9 The greatest metal reductions occurred
when the pH was 100 Samples for which the pH was adjusted with lime showed better
removal of barium manganese and sodium concentrations than those samples for which the
pH was adjusted with sodium hydroxide Samples for which the pH was adjusted with
sodium hydroxide showed greater declines in the concentrations of calcium and magnesium
No significant effect was observed on the removal of cobalt iron lead aluminum potassium
and zinc when lime or sodium hydroxide was used to raise the pH The observation that
samples for which the pH was adjusted with sodium hydroxide had elevated concentrations of
19 c
c TABLE 1-8 PRELIMINARY POLYMER TESTING RESULTS
Description of Supemate
Procedure pH ColorSoUds
mgl Turbidity
NTU Floe SettleabUity
Varymg pH
Raw Groundwater pH adjustedNaOH pH adjustedNaOH pH adjustedNaOH
62 80 90 100
YeUowbrownYeUowbrownYeUowbrownYeUowbrown
450 gt50 gt gt 5 0 gt gt50
58 SUght mst pin floe medium
gt medium
None Slow Faster Fastest
Varying polymer dose pH adjustment wNaOH
pH adjustedno polymer
100 YeUowbrown gt gt50 gt medium Fast
Above wpolymerat 1 ppm
100 Light yeUow lt 10 35 large 18 Fast
c Polymer at 5 ppm 100
Polymer at 1 ppm 100 wcoag 30 ppm
Light yeUow
Very Ught
lt 10
lt 10 yeUow
32
30
Large 18
Targe 18
Fast
Fast
n 20
o o n TABLE 1-9 F U L L - S C A L E TREATABILITY STUDY JAR T E S T R E S U L T S
Results in mgL
SAMPLE ID iiiiiiiiiiiiiiiiiiiiMW JAiSiiii iiiJTililiiiiiiiiiiii iiiJTil^iiiiiii iiiiiiiiiiTIi3iiiiiiiii iiiii^ii^li^iiiiiiiiiiiiii^iiri^iiiiisiiiiiiiiiiiiimii iiiiiJT4^iiiiiiiiiiiiiinP4i4iiiiiiiiiii iiiiiJT2iiliiiiiiiiiiiiT2^iiiiiii |i|S^ iiiiiiiiiiiiiiiiiiiiiiiiiiiiilM ii iiiiiiiiiiiiiiiiiiiiJlt iiiiiiiiii iiiiiiiiii-iiiiiiii iiiiiiiii=iiiiiiiiiiiiiliiiiii iiiiiiiiiiiiiiiiiiiiiiliiiiiiiiiiiiiiiiiiiiiiiiiiliiiiiiiiiiiiiM ii^iiiiiiiiiiiii6iiiiiiiiiiiiiiiiiiijqiiiiii mmsectlsectMimamp0^
Zinc 0488 002 U 002 U 002 U 002 U 002 U 002 U 002 U 002 U 002 U 002 U
E S A M P L E ID iiiiiiiiiiiiiiiiiiiiJT2i3iiiiiiiiiiiiiiiii ^T2-4iiiiiiiii iiiiiiiiJ^alliiiiiiiiiiiii iii^Ta^iiiiiiiiiiii iiiiiiiiit3|3iiiiiiiiiiiii iiilT3Tr4iiiiiiiiiiiiiii rrs-i iiiiiiiiiiiiiiJTSl iiiiiiiiiiiiiii iiiiiitJiJiiiiiiiiiii iiiiiiWs-4iiiiiiiiiiiii iiiiiiiJT5r-5ii|iiiiiiii
iiiiiiiiliiiiiiiiiiiiiiiiiBSsiii iiiiiiiiiiiiiiiiiiiiiilgtHiiiiiiiiiiii iiiiiiNaOHiiiiiiii iiiiiiiiiiii)iliimiiiiiiiii iiiiiiiiSiiriiiisiiiiiiiiii iiiiiiiiNiliiiiiiiiii iiiii iNapHiiiiiiiiiiiii iiiiiiiiiiiiiiiifloiiiiiiiii iiii^iiiiiiiiiii iiiiiiii NiitQHiiiiiiiii iiiiiiiiiWftOHiiiiiiii wmm iii^iiiiiiiisiiiiiiiAli|ilii iiiiiiiiiiixiiiiiEal3i iltgtoi PolyCoag C o a g u l a n t PolyCoag Coagulant iiiiiiii iiiiiii iiiiiii)|sihyii^iiiiiiii PolyCoag PolyCoag iiiPoij^iii^il ANALYTES Aerated KMn04
Barium 0073 0072 010 010 010 010 NA NA NA NA NA Calcium 247 247 571 574 273 277 NA NA NA NA NA Cobalt 001 U 001 U 0017 0018 0017 0019 NA NA NA NA NA Iron 01 U Ol U 016 023 016 043 NA NA NA NA NA Lead 0005 U 0005 U 0005 U 0005 U 0005 U 0005 U NA NA NA NA NA Magnesium 44 44 50 51 50 50 NA NA NA NA NA Manganese 35 33 43 43 44 44 063 086 099 094 14 Potassium 5 U 5 U 5 U 5 U 5 U 5 U NA NA NA NA NA Sodium 423 477 170 169 502 508 NA NA NA NA NA Zinc 002 U 002 U 0082 011 015 016 NA NA NA NA NA
Notes Only metals detected in untreated groundwater from MWIA are presented NA = Not Analyzed
U = undetected at specified detection limit JTI = Jar Test 1
c
c
sodium in the treated water was expected This is because sodium is a component of sodium
hydroxide Similarly the elevated concentrations of calcium observed in samples for
whichthe pH was adjusted wUh lime are due to the calcium component in lime Jar test 5
was conducted to assess the effect that precipitation and chemical oxidation had on the
removal of manganese and aluminum The results of this investigation are also presented in
Table 1-9 The results indicate that greater reductions of aluminum and manganese cannot
be achieved with aeration or by the addition of a chemical oxidant such as permanganate
A sample of the metal hydroxide sludge a residual that wiU be generated during the
groundwater treatment was analyzed for metals and PCBs This sample of sludge was
generated by treating contaminated groundwater with precipitation and filtration using the
optimum treatment parameters The metals results indicate that the sludge would not be
considered hazardous under RCRA using the toxicity characteristic leaching procedure
(TCLP) A TCLP was not performed on the sludge however based on 1) the concentration
of the metals in the sludge 2) assuming a 100 leachability and 3) incoiporating a 20-fold
dUution for a soUd matrix analyzed by TCLP this sludge would not be considered hazardous
under RCRA The PCB analysis of the sludge showed that Aroclor 1254 was the only
detected PCB at a concentration of 31 mgkg The TSCA limit for PCBs in waste is
50 mgkg indicating that this sludge would not be hazardous under TSCA The results for
this sludge represent a preliminary characterization and once the fuU scale treatment system
is on line the sludge analysis wiU need further testing to confirm these preliminary results
and to make a further assessment of the disposal options The analytical resuUs for the
sludge are presented in Table 1-10
1232 FUtration Testing A bench-scale filtration study was performed to determine the
optimum particle retention grade or mesh of filter media that could effectively remove the
suspended soUds in the precipitated groundwater The results of the analysis on the fUtrate
are presented in Table 1-11
n 22
c
c
TABLE 1-10 PRECIPITATED METAL HYDROXIDE SLUDGE RESULTS Results in mgkg
i||ipiiiii|iiiiiiiiiiiiiiiii^^iiiili|ii^^^ TCLP or TSCA L i n i l t s i Tfesi-iiiiiiiiiiiiiiisiiiiii^iiiiiiSvHiij^ in Solid Matrices ii iiiiS WM3KT2S
METALS
Aluminum Antimony Arsemc Barium Beryllium
Cadmium Calcium Chromium Cobalt Copper Iron Lead Magnesium Manganese Mercury Nickel Selenium Silver Sodium Thallium Vanadium Zinc
PCBs
Aroclor 1254
41100 231 195 346 5767
9120 338
25 114
39000 694 5260 2730
03313
04
8960 08
561446
31
U U
U
J
U U U R
U U J
J
NC NC 100
2000 NC 20
NC 100 NC NC NC 100 NC NC
4 NC 20
100 NC NC NC NC
50
Notes = TCLP Limits incorporated a 1 to 20 dilution factor for solid matrices Aroclor 1254 was the only PCB detected The remaining six Aroclors
were nondetect at a quantitation limit of 36 mgkg NC = No criteria exists for this compound U = Undetected at speciiied detection limit
L J = Estimated value due to validation criteria R = The result is rejected
23
c
c
TABLE 1-11 FILTRATION STUDY RESULTS
Media Rating Speed Suspended SoUds Turbidity
Raw 45 mgl 578 Course 10 um 200 mls5 sec lt5 mgl 16 NTU Medium 5 um 200 mls7 sec lt5 mgl 19 NTU Fine 1 um 200 mls23 sec lt5 mgl 18 NTU
Since there was virtuaUy no difference in the quaUty of effluents but substantial increase in
time to filter with the fine filter paper the medium 5 micron paper was chosen to prepare
sample for ftirther study
1233 Air Stripping Precipitated fUtered groundwater was aerated at 3 different air to
water ratios to evaluate the effectiveness of air stripping for the removal of volatUe organic
compounds in the groundwater Tables 1-12 and 1-13 shows the analytical results for
groundwater samples obtained from weUs MW-IA and ME-8 respectively No volatUe
organic compounds were detected in samples that were aerated at a 501 air to water ratio
Aeration of precipitated filtered groundwater obtained from weU ME-8 removed aU of the
vinyl chloride at an air to water ratio of 251
1234 Carbon Adsorption The effectiveness of carbon adsorption for the removal of
organic compounds in the groundwater was evaluated The analytical results are presented in
Table 1-14 At the lowest carbon dosage only 1 xg1 of cis-12-dichloroethene and
2 xg1 of trichloroethene remained No site-related volatUe organic compounds were detected
in samples which were treated with higher doses of carbon Toluene and
dibromochloromethane were detected in sample C-4 however these two compounds were
not detected in the raw groundwater and must therefore be a result of lab contamination
24 c
c TABLE 1-12 FULL SCALE TREATABILITY STUDY AIR STRIPPING RESULTS IN ugL FOR WELL MWIA
Methylene Chloride 10 u 4 U 5 U 5 U 4 U 4 U 2 U 4 U
cis-12-Dichloroethene 200 D 1 U 1 06 J 06 J 1 U 1 U 1 U
Chloroform 4 J 1 U 1 U 1 U 1 U 12 J 1 U 1 U
12-Dichloroethane 10 U 2 1 u 1 U 1 U 1 U 1 U 03 J
Carbon Tetrachloride 10 u 1 U 1 u 1 U 1 U 1 U 1 U 01 J
Trichloroethene 860 D 1 U 2 06 J 06 J 02 J 1 U 1 U
Toluene 10 U 020 J 1 U 1 U 1 U 007 J 25 1 U
Dibromochloromethane 10 U 1 U 1 U 1 U 1 U 1 U 14 1 U
Chlorobenzene 5 J 1 U 1 U 1 U 1 U 1 U 1 U 1 U
Ethylbenzene 10 U 1 U 1 U 1 U 1 U 1 U 1 U 1 U
Total Xylenes 1 J 1 U 1 U 1 U I U 1 U 1 U 1 U
Styrene 10 U 1 U 1 u 1 U 1 U 1 U 09 J 1 U
124-Trichloroben2ene 2400 D 4 1 u 1 U 1 U 1 U 1 U 1 U
123-Trichloroben2ene NA 5 1 u 1 U 1 U 1 U 1 U 1 U ^
SEMIVOLATILE ORG ANICS
Diethylphthalate 10 U 2 J 10 u 10 U 10 u Di-n-butylphthalate 10 U 1 J 10 u 10 U 10 u
Bis(2-ethylhexyl)phthal ate 10 U 10 U 10 u 4 J 2 J
Notes
Only volatile and semivolatile organics detected in any sample are included
No PCBs were detected in any effluent sample at a detection limit of 01 ugL influent was 36 J ugL
C-ID = Duplicate of C-1
U = Undetected at specified detection limit
J = Estimated value due to validation criteria
D = Duplicate
NA = Not Analyzed
= Value is for total 12-Dichlorocthene
i| f|iiiiiiiiiiiiiii^ti8ili| WSk
3 U 2 u 8 U
1 U 1 u 1 U
1 U 1 u 1 U
04 J 1 U 1 U
1 U 1 u 1 U
03 J 008 J 1 U
1 U 1 u 1 U
1 U 1 u 1 U
02 J 1 U 1 U
005 J 1 U 1 U
02 J OI J 1 u 1 U 1 U 1 u 1 U 1 U 1 u 1 U 1 U 1 u
10 U
10 u
2 J
27
c
The effectiveness of combining aeration and carbon adsorption to remove organic c contaminants was also investigated These results are also summarized in Table 1-15 No
organic compounds were detected m any of the samples generated during this investigation
124 Conclusions The results of the groundwater treatability study demonstrate that
treatment consisting of precipitation fUtration air stripping with vapor phase controls and
carbon adsorption appear able to meet cleanup levels estabUshed for the site Figure 1-3 is a
schematic representation of the proposed system The ROD stipulates that treated
groundwater wUl be reinjected to the aquifer onsite in this case MCLs are the cleanup
levels An altemative to be evaluated is discharging the treated groundwater to a surface
water body either Meadow Brook or the Neponset River In this case cleanup levels are
estabUshed as effluent discharge levels Effluent discharge levels are calculated by
multiplying the ambient water quaUty criteria (AWQC) values for each compound by a
dUution factor The dUution factor for the Neponset River is based on a 100-gpm treatment
discharge rate and a Neponset River 7010 of 2020 gpm The dUution factor for Meadow
Brook is 1 since the treatment discharge rate is greater than the flow of the brook therefore
effluent discharge levels for Meadow Brook are set at AWQC
Tables 1-16 through 1-19 compare effluent discharge levels for both the Neponset River and
Meadow Brook to carbon adsorption effluent from the groundwater treatability study
Table 1-16 summarizes the concentration of metals in untreated groundwater the metals
concentrations remaining foUowing precipitation and filtration the metals concentration
foUowing aeration and carbon adsorption the metals concentrations foUowing caition
adsorption only the MCLs and the effluent discharge levels based on discharge to the
Neponset River The only metal effluent concentration which exceeds the MCLs is
aluminum the MCL for aluminum however is a secondary MCL which is nonenforceable
No metals concentrations in the effluent exceed any of the effluent discharge levels
n 28
c TABLE 1-15 FULL-SCALE TREATABILITY STUDY AERATION AND CARBON ADSORPTION RESULTS Results in ugL
iiiiii|Mpt-HiiDiiii-iiiiii^iiiiiiiiiiii iii bullbullbull^(6-^1 iiiiii-iiiiiiiii iiiiiiiiii^g-2iiiiiiiiiii|i
l | | | ibyNigtii i i i i | i i i i i i i | ivi
VOLATILE ORGANICS
Mediylene Chloride 6 U 4 U Carbon Tetrachloride 1 U 01 J Toluene 02 J 1 u Total Xylenes 1 U 1 u Acetone 5 U 5 U 2-Butanone 5 U 5 U 2-Hexanone 5 U 5 U 4-Methy 1-2-pentanone 5 U 5 U Carbon Disulfide 1 U 1 U
c Notes Only volatile organics detected in any sample are included U = undetected at specified detection limit J = value is estimated due to validation criteria
iiiiiA61iiiiiiiiiiiii
3 U 1 U
02 J 01 J
5 U 5 J 5 U
5 U 1 U
i|AGii[ijiiifii
3 U U
01 J 1 U 5 U 5 U 5 U 5 U 1 U
i^^^iiiiiic|ii[|ili
10
1 u 1 u 1 u 5 U 5 J
5 U 5 U 1 U
29
c
o o o
o
Gas Phase GAC or Catalytic Oxidation
To ^ Ambient
Air
To Groundwater Recharge or
Raw Treated ) Neponset River Groundwater Groundwater Influent Holding Tank J
Solids for Offsite Disposal
(NOTE Air stripper not necessary if discharge to Neponset)
FIGURE 1-3 PROPOSED GROUNDWATER TREATMENT SYSTEM SCHEMATIC
2483JP
o n o TABLE 1-16 COMPARISON OF INORGANIC FULL-SCALE TREATABILITY STUDY RESULTS TO MCLS AND DISCHARGE LEVELS
[i^i^^^^ iiiiiiijiMf|iilaquo4 Precipitation Aeration and Carbon AdsorpUoi iiiiiiiiiiiiiiiiiiiiiiritliiiiin
iiiii iiSiiii|iiiiiiiiiiiiiiiii and Filtration M^ Iiiiiiiiiiiiii iiiiiiiii|iiii|i|iiiiiiiiiii liiiijlliiiii
iiiiiiiiiiiiiiiiiiiii iiiiiiiiiiiiii i i i i i i i|ii||iiiiiiiiiiiiiiiiiiiiiiiii iiiiiiiiiiiiiiiilii Giliii iiiii ii iiiii i iiiic iD|i laquoi|iiiiiiii iiiiitiiiiciiiiiiiiiiiii
Discharge levels calculated by multiplying AWQC by a dilution factor based on a 100 gpm treatment discharge rate and a Neponset River 7Q10 of 2020 gpm
U = Undetected at specified detection limit
J = Estimated value due to validation criteria
NC = No criteria exists for the compound
P = Proposed MCL
S = Secondary MCL
n n o TABLE 1-17 COMPARISON OF INORGANIC FULL-SCALE TREATABILITY STUDY RESULTS TO MCLS AND DISCHARGE LEVELS
DISCHARGE TO MEADOW BROOK
[isjiiiiiiiiiiiiiiii-ii |iiiiiiiiiiiiiiiiiiiiiiiiiiiiiiiiiiiiiiiiiiiiiii iiiiiiiiiiiiiiiiiiiiiiiiiiiiii iiiiiiiiiiiiiiiiiiiiiiii- iiiiiiiiiiiiiiiiiiiiiiiiiiiiiiiiii ^iiiiiiiiiiiiiiiiiiiiiiiiiiiiiiiiii bull immMmii^^ F- piiiipiiiiil i i i i i i i i i i i AcraUon and Caibon AdsorpUon iii iii iiii i i i i l l l i i i i i i ^ ^ i p t ^ sectffllM^ ^ ^
Ajumin iw u i 358 bull490 z ii 240 i--lJi iiiiiiiiiiiJ^3iiitJi i i iii i3 lliiiiiiiiii iiii|ii]^(Ciiiiiiiiiii-iii-iiiiiiii5iiiii-iiiiiiiiNC^ Antimony 2i ij NA 44 U i44 U 44 U 44 U 44 U 10 P 88 30 8600
Ariseiaic- iiiiiiiiiiiiiiiiiiiiii8iiiiiiiiiiiiiii iiiiiiiiii-iis- - iiiiiiiiii- 1 u 71 J i-iiiiiy3|ili-uj - i i i 9 l i j i iii--5Qiiiiiiiiiiiiii iiiiii NC- NC - iL | Barium 247 32 106 U 65 U 597 49 U 131 IJ 2006 NC NC NC
Blaquoay|Hiiraquosi-- bullbullbull--bull i-iiiii-iiiiii3iiiiiiliiiiiiii -iiiiiiiiiiiNAi-iiiiiii I u -- 1 U iiiiiiiiiliilliiiiii-ii|iyi- iiiii iiiiiiiiiiiiiiiiii ii|i|40 - 53-bullbull13|shyCadmium ( S i u bull bull bull bull bull bull bull bull bull N A 4 UJ 4 UJ bullr^^ 4UJ 4UJ 5 682 038 170 Cai lc turn i bull- iiiiii3PiOCfiii iiiiiiiiiiii iiiiiiiiii^iiiiiiiiiiiiii 9650 i 8360 iiii7886iiiiiiiiiiiiiiiiiiiiiiii^iiiiiiii-ii6^^ iiiiii5isNltiiiiiiiiiiiiiiiiiii iiiiiiNC NGi NC Chromium 315 NA 8 J 7 UJ 7 u j 7 uj 7 iirj 160 16 11 3206
CO i-iii-iiii 33iitiii-iiiiii ii-iiiii-i-Jfiiiiii--iiii - bull bull 4 U Z 4 U- iiiiiiiiiiiiiilii-uiiiiiiiiiiiiiiiiiiiiiii4iitjiii-iiiiiiiiiii4 iiiiii-ii Nltiiiiiiiiiiiiiiiiiiiiii i l i iNc-- -NCi^-NCi
P ^ i bull bull Copper 6 4 i NA 128 U 179 U bull64Uj 9 U --256--u-- 1300 48 36 NC
Jtaa- iiiiiiiiiiii ltJOlt iiiiiiiiiii isiiiiiiiJQiii-i - z 6AS U ii232U-^^ bulliiiiiiiiiiiiiiiiiiiiuiiiiiiiiiiiiiiiiiiiiiiiiiiiiiiiiiii2 ipit|iiiiii iiiiii3pQiiiiJiiiilii liiiNC- v 1000- bull- NCi head 253 5^U^ 35 U 46 U 21 U 12 U J 2^4 u 14 054 NCis |Magnlaquoaiuiai iiiiiiiiiiilaquo)6iiiiiiiiiiiii iiiiiiiiiiii|lS)6iiiiiiiiiiiiii 3700 7060i V^ bulliiiMiiiiiiiiiiiiiiiiiii3Jpiiiiiii7^0iiiii^^^ i iiigtKSiiiiiiiiiiiiiiii bulliii I N C bull N C Ncjii Manganese 4810 bull356 62 U 18 UJ 23 U 35 U 53 U 56 S NC NC 106
Wtercuryi iiiiiiiiiiiiiiiiiiiiiiiiyiiiMiiiiiii iiiiiiiiiiiiiiiiiNAiiiiiii i P-2 U bullbull 0 2 U-- iiiiiiiiiiiiiiiiOi|iiittiiiiiii|iiiii 6iiiiit|iiiiiiiiiiiiiQ|iit|iiiiii iiiii|i|iiiiiiiiiii iiii|iii24- -- oon --0i|i Nickel 281 isrA 181 UJ 244 UJ 269 uil 17 U 356 il 166 P 643 33 3800
Potraquoslaquolum -iiiiiiiiiii4liS0iiiiiiiiii iiiiiiiiiiiii PPQiiiiU i 2200 U i ii 2620 XT | |i |owiiyiiiiii | |(^iiiiiiiiiii^ iiiiiiiiiiiiiiiW|iiiiiiiiiiiiii iii iii|ip--i NC- bullbullbull-KCii Selenium 20 U NA 32 U 13 UJ 1 6 u 1 UJ i u 5 6 266 50 6800 Sflycri i-i- iiiiiiiiiiiiiiiiiiiiiiiiiiiiiiiiiiiiiii iiiiiiiiiiiiiiiiiii iiii- i-4U bull -^M- U iii bull i i i i | | i | | i i i i |-i i | i | l | i i i i | i i i i iiiii-i ^66iiiiiiiiiiiiiii i|iP37 -0i2iNi Sodium 1 2 3 6 6 6 9 5 5 6 6 99000 lOlOOO 99866 106066 74566 NC NC NC NC
I m iiiiiiiiiiiiiiiiiiiiii||jriiiiii||iii|i|iii|| | ii46Q ^40- -bull-3iThaUJiiiitt - iiiiiiiiiiiiiiiiiiiiiiiiiiliiiiiiiiii iiiiiiiiiiiiiiNAii- I UJ ^ iiiiiiiiiiiiiiiiii Vanadium 439 NA 5 U 83 UJ 5 U 5 IJ 0 IJJ NC NC NC NC
Ziiicii^ iiiiiiii-iiiii- 488iiiiiiiiiiiiii iiiiiiiiiiii6iiu 151 U 67 UJ iiiii iiiiiiiiiiiiiiiil52iU- iiiiiiiii2 liiiiiiiiiii iiJiOQ()ii- Siiiiiiii iiiiiiiiii|6 bull bull33 - N C i
Notes
Discharge levels are AWQC (10-5 risk) since the treatment discharge rate of 100 gpm is higher than the flowrate of Meadow Brook
U = Undetected at specified detection limit
J = Estimated value due to validation criteria
NC = No criteria eus ts for the compound
P = Proposed MCL
S = Secondary MCL
o n o TABLE 1-18 COMPARISON OF ORGANIC FULL-SCALE TREATABILITY STUDY RESULTS TO MCLS AND DISCHARGE LEVELS - DISCHARGE TO THE NEPONSET RIVER
||x|o | bull iiii||i||il|A iiiiii iiiiiiiiliiiiiiiiiiili ii5iiPo|laquo|o|i iii||l|i|i||ii||y E^ly1 C DoteslOO ii i^i|raquoiiipltii=(iiiii|iii iiii i i w i M w iiiiiiilliHiJLYiiii iiiiWiiiiii iiiiiiiiiiiiii ii iiiiiiiiiiiiiiiiiiii iiiiii iiii iiiiiiiiiii iiiiiiiiiiiiiiiiii iiiiiiiiiililiiiiiiiiiliiiiii bulliiiiii lagaiiiiiiiii iiiiiiiiiiiiiiiiiiiiiiiiiiiiiiiii (ugL) iiiiiiii^iiiiiiiiii iiiiiiiiiiiiipiiiii iiUiiiiiii^ WmnKiiiiiii i(iiiiiiii i iii iiiiiiiiiiMiiiiii VOLATILE ORGANICS
112-Trichlorocthane 5 J 25 U 1 u 1 u 1 U 1 u 1 u 5 NC NC 8904
1122-TetrachIororthane 16 J 25 U 1 u I u I U 1 u 1 u NC NC 50880 2332
Chloroform 4 J 25 U 1 u 1 u 1 U I u 1 u NC 612680 26288 3328
Vinyl Chloride 10 U 50 U I u 1 u 1 u 1 u 1 u 2 NC NC 111300
11-DichIoroethene 10 U 25 U 1 u 1 u 1 u I u 1 u 7 245920 0 403
12-Dichloroethene (total) 200 D 97 1 u 1 u 1 u 1 u 1 70 245920 NC 29680000
Trichloroethene 860 D 430 1 u I u 1 u 1 u 2 5 954000 464280 19504
Tetrachloroethene 5 J 25 U 1 u I u 1 u 1 u 1 u 5 111936 17808 1876
Xylenes (total) 1 J 25 U 1 u 1 u 01 J 1 u I u lOOOO NC NC NC
Chlorobenzene 5 J 25 U 1 u 1 u 1 u 1 u I U NC NC NC NC
SEMIVOLATILE ORGANICS
Pentachlorophenol 25 U ND 25 U 25 U 25 U 25 U 25 U I 424 276 NC
Chlorobenzenes(total) 5300 1060 NC
13-Dichlorobenzene 3 J 2 10 U 10 U 10 U 10 U 10 U 600 NC NC 55120
14-Dichlorobenzene 17 9 10 U 10 U 10 U 10 U 10 U 75 NC NC 55120
12-Dichlorobciizcne 7 J 5 10 U 10 U 10 U 10 U 10 U 600 NC NC 360400
124-Trichlorobenzene 2400 D 50 10 u 10 u 10 U 10 u 10 U 9 5300 1060 NC
PESTICIDESPCBS
Arocloi-1254 36 J 32 NA 01 u NA OI u NA 05 42 03 01
Heptachlor 0074 J NA NA NA NA NA NA 04 11 01 01
Aldrin 017 J NA NA NA NA NA NA NC 64 NC 002
Heptachlor Epoxide 0045 J NA NA NA NA NA NA 02 NC NC NC
gamma-Chlordane 0056 J NA NA NA NA NA NA 2 51 OI 01
Notes
Discharge levels calculated by multiplying AWQC (10-S risk) by a dilution factor based on a 100 gpm treatment discharge rate and a Neponset River 7Q10 of 2020 gpm
Compounds presented are only those detected in the untreated groundwater sample
NA = Not analyzed J = Estimated value due to validation criteria
NC = No criteria exists for the compound D = The reported value is from the diluted analysis
U = Undetected at specified detection limit P = Proposed MCL
o n o TABLE 1-19 COMPARISON OF ORGANIC FULL-SCALE TREATABILITY STUDY RESULTS TO MCLS AND DISCHARGE LEVELS - DISCHARGE TO MEADOW BROOK
i 1 liiiisisi i ii iii iii|i|i i l i 11 i |ii^^ i i i i i i i i iiiiiiiiiiiiiiiiii iiiiiiiiiiiiieiciidiiiiii iiiiiiiiiiiiii iiiiiliiiiiii^^iiiiii iiiiiiiiiiiiiiiiiiii iiliiiii i iiiiipiiiliiiiiiiliiii iiiiiiiiiiiiiiiiii iiiii|iii|i|i-iiiiii iiAVQiii|iiiii i ii-iiiiiiigt-iiii ^^
iiiiiiiiiiiiiiii iiiiiiiiiiiiiiiiiiiiiiiiiiiiii iiiiiiiiiiiiiiiiiiiiii I i i i i i i i i||i|i|||iiiiiiiiiiiiiiii|iiii iii-|iiilaquo|i3[i|ii |||^|ii^|i|^|iii i (3 i i ^ ^ l i i illjliii^jiii^ iieip|i(iii|i iiiiiiiiiiiiiiiiiiii i^|iii|(iiiijiii|)|r^ iiii-iiliiiiiiiiiiiii ||i |illlli|i i|li|i|ii iiiiiiiiiiiiiiiiii iiiiiiiiiii|tiiiiiiiiiiiiiiiiiii iiiiiiiiiiiifiiiiiiiiii iiiiiiiiiiiiiiiiilaquoiiiiiii iiiiiiiiiiilliiiiiiiiiiiiiiii i (laquoy^ iiiiiiiiiiiii(Wiiiiiiiii iiiiiiiii i lK^ iiiiiiiiliiiiiiiiiiiiiiiii (ugl)iii iiMiiiiiii VOLATILE ORGANICS
112-Trichloroethane 5 J 25 U 1 u 1 u 1 u 1 u 1 u 5 NC NC 420
1122-Tetrachloroethane 16 J 25 U 1 u 1 u 1 u 1 u 1 u NC NC 2400 110
Chloroform 4 J 25 U 1 u 1 u 1 u I u 1 u NC 28900 1240 157
Vinyl Chloride 10 u 50 U 1 u 1 u 1 u 1 u I u 2 NC NC 5250
11-Dichloroethene 10 u 25 U 1 u 1 u 1 u I u 1 u 7 11600 NC 19
12-Dichlorocthene (total) 200 D 97 1 u I u 1 u 1 u 1 70 11600 NC 1400000
Trichloroethene 860 D 430 1 u 1 u 1 u I u 2 5 45000 21900 920
Tetrachloroethene 5 J 25 U 1 u 1 u 1 u 1 u 1 U 5 5280 840 89
Xylenes (total) 1 J 25 U 1 u 1 u 01 J I u I U 10000 NC NC NC
Chlorobenzene 5 J 25 U 1 u 1 u 1 u 1 u I u NC NC NC NC
SEMIVOLATILE ORGANICS
Pentachlorophenol 25 U ND 25 U 25 U 25 U 25 U 25 U 1 20 13 NC
Chlorobenzenes(total) 250 50 NC
13-Dichlorobcnzene 3 J 2 10 U 10 U 10 u 10 U 10 U 600 NC NC 2600
14-Dichlorobenzene 17 9 10 U 10 U 10 u 10 U 10 U 75 NC NC 2600
12-Dichlorobenzene 7 J 5 10 U 10 U 10 u 10 U 10 U 600 NC NC 17000
124-Trichlorobenzene 2400 D 50 10 u 10 u 10 u 10 u 10 U 9 250 50 NC
PESTICIDESPCBS
Aroclor-1254 36 J 32 01 u 01 u OI u OI u NA 05 20 0014 00045
Heptachlor 0074 J NA NA NA NA NA NA 04 052 00038 00029
Aldrin 017 J NA NA NA NA NA NA NC 3 NC 000079
Heptachlor Epoxide 0045 J NA NA NA NA NA NA 02 NC NC NC
gamma-Chlordane | 0056 J NA NA NA NA NA NA 2 24 00043 00048
Notes
Discharge levels are AWQC (10-5 risk) since the treatment discharge rate of 100 gpm is higher than the flowrate of Meadow Brook
Compounds presented are only those detected in the untreated groundwater sample
NA = Not analyzed J = Estimated value due to validation criteria
NC = No criteria exists for the compound D = The reported value is from the diluted analysis
U = Undetected at specified detection limit P = Proposed MCL
Table 1-17 shows a comparison of effluent to effluent discharge levels based on discharge to c Meadow Brook assuming a dilution factor on one If the treated groundwater was discharged
to Meadow Brook effluent discharge levels for arsenic would be exceeded Since arsenic is
a difficult compound to remove in a groundwater treatment plant it is concluded that
Meadow Brook may not be usable as a discharge point
Table 1-18 presents concentrations of organic contaminants in untreated groundwater from
MW-IA the precipitated and filtered effluent the effluent following both aeration and
carbon and the effluent from carbon adsorption only These values are compared to MCLs
and effluent discharge levels Only one carbon dose for the carbon only study the lowest
dose of 05 g carbon1000 ml groundwater is shown as a conservative example In both
cases using aeration and carbon and carbon alone organic contaminants were removed to
below MCLs and to below discharge levels Therefore aeration at an air-to-water ratio of
251 and a carbon dose of 05 g carbon1000 ml groundwater effectively removed volatile
organics semivolatile organics and PCBs from the groundwater
c It is expected that a maximum air-to-water ratio at 251 will be effective for an air stripper
onsite because full-scale air strippers are many times more efficient than the bench scale
models This is due to the greater surface area and turbulence found in the stripper The
off-gas from the air stripper will have to be treated to meet applicable standards either by a
catalytic oxidation unit or a vapor phase carbon adsorption system
Since no vinyl chloride was present in MW-IA and vinyl chloride is a difficult compound to
remove with carbon adsorption tests were performed with groundwater from ME-8 which
contained 210 xg1 vinyl chloride These results were presented in Table 1-13 which shows
that air stripping at an air-to-water ratio of 251 is effective in removing vinyl chloride In
order to reach the MCL of 2 figl for vinyl chloride an air stripper is required Carbon
adsorption alone would not remove vinyl chloride down to the MCL If the treated
groundwater is discharged to the Neponset River instead of being reinjected an air stripper
to remove vinyl chloride is not necessary since the discharge level is 111300 xg1
35 c
Table 1-19 shows a comparison between the organic concentrations in treatability study c effluents and effluent discharge levels based on discharge to Meadow Brook All volatile and
semivolatile organic compounds are removed to the effluent discharge levels It is
impossible to determine if PCBs were effectively removed since the most stringent discharge
level is 0014 xgL and the detection limit in the study is 01 xgL Discharge to Meadow
Brook may not be feasible due to 1) the treatability study cannot prove that PCBs are
removed to effluent discharge levels and 2) arsenic concentrations in the treated effluent
were higher than effluent discharge levels (based on a dilution factor of one)
The preliminary results of the sludge analysis indicate that the sludge is nonhazardous under
RCRA and TSCA Once the fiill scale groundwater treatment system is on line samples of
the sludge should be reanalyzed to confirm the preliminary results and to further assess the
disposal options
In summary the results of the treatability study indicate that groimdwater from the Norwood
PCB site can be treated effectively to allow discharge to either the Neponset River or r gtlaquo^ reinjection back into the aquifer If treated groundwater is reinjected the treatment plant
must include an air stripper to remove vinyl chloride If treated groundwater is discharged
to the Neponset River an air stripper is not necessary to meet discharge levels however the
use of Best Available Technology (BAT) may be required which would necessitate the
inclusion of an air stripper A cost comparison between an air stripper combined with
liquid-phase carbon versus liquid-phase carbon alone was performed and reported in the
Modeling Report The conclusion was there is not a significant difference in cost the
present worth assuming a discount factor of 8 and a 16-year period of perfonnance was
135 vs 102 million dollars (see Volume 2 Section 3) These costs will be evaluated
further during the design phase of the project The efficiracy at the full scale plant can be
optimized to ensure that at no time will the effluent from the plant exceed any applicable
groundwater or surface water standard
36 C
Section Two
c
c
20 ROCKS
21 Introduction and Objectives
There are several sources of rocks potentially contaminated with PCBs present on the Grant
Gear property portion of the Norwood PCB site Three different sources of rocks were
collected for analysis from the Grant Gear property The three rock sources included
overburden rocks from a trench west of the Grant Gear facility and below the interim
remedial cap crushed stone from the interim remedial cap west of the Grant Gear facility
and pea stone from the upper and lower roofs of the Grant Gear facility Throughout this
section rocks collected from on top of the interim remedial cap will be referred to as cap
rocks and overburden rocks wUl be referred to as trench rocks The rock collected from the
roof were analyzed under Work Plan 1 and are discussed in the Building Investigation
Report
The objective of this portion of the predesign work was threefold
bull To determine the PCB contamination if any on the different sources of rocks
bull To assess the feasibility of dry tumbling as a remedial altemative for the rocks
bull To assess the feasibility of water washing as a remedial altemative for the rocks
The dry tumblingwater washing was conducted on rocks that were reported to be too large
to be remediated with overburden soils by the solvent extraction technique
22 Description of Work
Samples of the three sources of rocks were collected by Metcalf amp Eddy personnel on
January 8-10 1992 Refer to Figure 1-1 for the locations of the trench and the cap rock
37 c
sampling points The samples were delivered to ENSECO laboratory in Cambridge
c Massachusetts and stored in a refrigerator at 4degC prior to sample preparation and analysis
Metcalf amp Eddy performed the sample preparation portion of the PCB analysis Rock
samples were weighed and gently placed in precleaned two liter glass beakers A quality
control surrogate compound was then added to each sample or method blank for subsequent
percent recovery determination The rocks were then immersed in extraction solvent
consisting of 30 percent acetone and 70 percent hexane by volume iEach sample and blank
was heated to 50degC and intermittently swirled by hand for a thirty minute extraction time
The extracts were then dried using sodium sulfate concentrated to 10 milliliters final volume
and submitted to ENSECO for PCB analysis using EPA SW846 Method 8080
The trench rocks were divided into three size categories with average diameters of one inch
two inches and three inches The rock size is an important consideration for the solvent
extraction remediation technique
^s^^ The three trench rock sizes and six cap rock samples were analyzed initially to determine the
extent of PCB contamination As outlined in the Quality Assurance Project Plan a second
portion of the cap rock sample with the highest initial PCB concentration was subjected to
water washing remediation and analyzed for PCBs Separate portions of the trench rock
samples were subjected to dry tumbling for ten and thirty minute intervals and water washing
for ten and thirty minute intervals The remediated rocks were then analyzed for PCBs
The dry tumbling and water washing were performed using an electronic rotary device The
rock samples were placed in clean two liter plastic sampling containers with screw cap
closures Laboratory distilled deionized water was poured into the water wash test
containers while the dry tumble samples had only the rocks enclosed
38 c
c 23 RESULTS
The one-inch average diameter trench rocks were initially contaminated with 1800 mgkg of
Aroclor 1254 Because the one-inch trench rocks were above the 10 mgkg cleanup standard
sample portions of the rocks were processed step by step through each of the four
remediations Although an eighty five percent reduction in PCB contamination was achieved
between the initial and final remediation samples the final concentration of 270 mgkg is still
well above the cleanup standard The results however showed a trend with the highest
concentration of PCBs detected on the initial sample lower PCB concentrations with the
ten-minute remediation and the lowest PCB concentrations achieved with the longest
thirty-minute remediation as expected The results for the one-inch trench rocks are
presented in Table 2-1
The two-inch average diameter rocks showed results similar to those of the one inch size
The initial sample had a concentration of 2500 mgkg of Aroclor 1254 The best
remediation result obtained was 450 mgkg for the ten-minute water wash sample A thirty c minute water wash sample for the two-inch trench rocks was not conducted when it became
apparent that a 10 mgkg cleanup level could not be obtained Because the 10 mgkg cleanup
level was not achievable the thirty minute water washing of two-inch rocks was not
conducted to minimize the level of effort and analytical costs The PCB result for the
thirty-minute dry screened sample 1900 mgkg Aroclor 1254 was higher than expected
This result was counter to the trend that was expected and observed with the one-inch rocks
and it demonstrates the non-homogenous nature of the rock samples This trend breaking
analytical result caused by the heterogenous or nonuniform nature of the rock sample matrix
was not repeated because the cleanup level could not be achieved The results for the
two-inch trench rock samples are presented in Table 2-1
The three-inch average diameter trench rocks yielded markedly different analytical results
The initial sample prepared with minimal on- site screening had a PCB concentration of
75 mgkg below the cleanup standard of 10 mgkg Although the initial result was below
39 c
TABLE 2-1 TRENCH ROCK WASHING RESULTS
Trench Rocks 1 inch Average Diameter
PCB Concentration
Sample mgKg
Initial sample 1800
Ten minute dry screened 620
Ten minute water wash 880
Thirty minute dry screened 290
Thirty minute water wash 270
Trench Rocks 2 inch Average Diameter
PCB Concentration
Sample mgKg
Initial sample 2500
Ten minute dry screened 490
Ten minute water wash 450
Thirty minute dry screened 1900
Trench Rocks 3 inch Average Diameter
PCB Concentration Sample mgKg
Initial sample 750
Ten min dry screened 210
Ten min water wash 025 UJ
Aroclor 1254 was the only PCB detected UJ - The sample was nondetect for PCBs to the estimated detection limit
of 025 mgKg
40
the cleanup standard it was close enough to warrant the first ten minute dry tumble c remediation step The first remediation step with a PCB concentration of 21 mgkg
confirmed that the three-inch trench rocks are less contaminated than their smaller
counterparts The three-inch ten-minute water washed sample was not submitted for fiill
quality control PCB analysis in an effort to minimize analytical costs The ten-minute water
washed sample result is from a partial quality control PCB screening analysis and is reported
as estimated Because of the lag time in tumaround of analytical results this sample had
been prepared extracted and screened and the information was available therefore it is
presented herein The results for the three inch average diameter rocks are presented in
Table 2-1
Six samples of cap rocks were collected and analyzed for PCBs AU of the results were less
than 02 mgkg or 200 xgkg For these cap rock samples an action level of 50 xgkg was
established in the Quality Assurance Project Plan The 50 xgkg value is an action level
established by EPA for this study only and is not a cleanup level identified in the ROD The
action if the results exceeded 50 igkg was to water wash the most highly PCB contaminated c sample Water washing was performed on cap rock sample number two The initial result
for this sample was 150 xgkg while the ten minute water washed sample yielded 24 igkg
Aroclor 1254 The cap rock results showed fairly consistent PCB concentrations in the range
of 50 to 150 igkg Aroclor 1254 The results are presented in Table 2-2
24 CONCLUSIONS
The cap rock samples were all determined to have PCB concentrations approximately one
hundred times less than the cleanup level of 10 mgkg Water washing conducted on the
most contaminated cap rock sample removed approximately eighty five percent of the PCBs
initially present These cap rock samples contained some fine soil like material which was
perhaps windblown carried on tmck tires or created by friction This material contributed
to the measured PCB concentrations for the cap rock samples
41 c
c TABLE 2-2 INTERIM REMEDIAL CAP ROCKS ANALYTICAL RESULTS
LOCAiSifi iiiiiiiiiiiiiii--iiiiiiiiiiiiiiiiiiiiidiiiiiiliiiiiiiii^ 10 minute Water Wash iiiii|ijii|iiii|iii^ PCB Concentration (ligKg)
1 120 NA
2 150 24
3 110 NA
4 31 U NA
5 86 NA
6 71 NA
Notes Aroclor 1254 was the only PCB detected U - Sample was nondetect for PCBs to the reported
detection limit - The highest initial PCB concentration cap rock sample was
subjected to a ten minute water wash remediation
42
C
The results of the rock tumbling and water washing demonstrate that this form of remediation r will not achieve the cleanup level of 10 mgkg for the one-inch and two-inch average
diameter overburden rocks The three inch rocks are below the cleanup level without
remediation It should be noted that these overburden rock samples were coUected from one
of the most highly contaminated areas at the site based on the remedial investigation results
These samples therefore represent worst case conditions
The dry tumbling remediation steps did not remove aU of the adhered soU particles as
anticipated This adhered highly PCB contaminated soU contributed to the measured rock
surface PCB concentration because the PCBs were extracted from the soU as weU as the rock
surface during sample preparation
The water wash remediation was effective in removing aU of the adhered soU The results
indicate that the rock surface and near surfaces have been contaminated with PCBs which
cannot be removed by water washing but are extractable with acetonehexane
c During the trench rock coUection ample one-inch and two-inch average diameter rocks were
avaUable at shaUow depths The trench had to be dug deeper to obtain the three inch size
rocks Because of the relative immobiUty of PCBs in soU the PCB concentration decreases
with depth as reported in the remedial investigation This decrease in PCB concentration
with depth is part of the explanation as to why the three inch rocks showed less
contamination than the smaUer sizes Also a factor is the surface area to mass ratio As the
mass of the rock increases the surface area to mass ratio decreases Since the PCBs are on
the surface or near surface of the rocks as the relative surface area decreases with size or
mass the reported concentration wiU decrease correspondingly
During the trench excavation and overburden rock coUection a two- to three-inch lens of
dark oUy appearing materials was observed This material was analyzed with a PCB field
screening kit and found to contain in excess of 10000 mgkg PCBs Some of the one and
two-inch diameter rocks sampled appeared dark in color Because it was not known whether
43 c
c
the dark rocks were naturaUy colored or from the tarry lens and to keep the study unbiased
these dark rocks were sampled randomly with the remaining rocks The dark appearing
rocks were estimated to comprise approximately five percent of the one and two-inch rock
sizes Inclusion of highly contaminated rocks in the samples would boost the reported PCB
concentrations
Altemative remedial measures other than rock tumbUng and water washing include detergent
and water washing organic solvent washing or steam cleaning Although preUminary
indications from the solvent extraction vendors are that only up to one inch size rocks can be
handled the possibiUty of designing a treatment system to handle larger rocks wiU be
explored during the design phase of this project If the size of the rocks precludes them
from remediation by solvent extraction along with contaminated soUds a rock cmsher wiU be
employed to reduce the contaminated rocks to a size that can be handled Although other
altematives for rock remediation might work solvent extraction with contaminated soUs or
rock cmshing foUowed by solvent extraction appear to be the easiest most cost effective
means to achieve the cleanup standards Whichever remedial altemative is selected rock
washing would only be necessary on rocks with average diameters between one and two
inches coUected from soU highly contaminated with PCBs A very rough estimate of rocks
onsite between one- and two-inch diameters is approximately 5000 tons No remediation of
the rocks is necessary if the solvent extraction technology can handle two-inch size rocks
44 c
c
c
TABLE 1-11 FILTRATION STUDY RESULTS
Media Rating Speed Suspended SoUds Turbidity
Raw 45 mgl 578 Course 10 um 200 mls5 sec lt5 mgl 16 NTU Medium 5 um 200 mls7 sec lt5 mgl 19 NTU Fine 1 um 200 mls23 sec lt5 mgl 18 NTU
Since there was virtuaUy no difference in the quaUty of effluents but substantial increase in
time to filter with the fine filter paper the medium 5 micron paper was chosen to prepare
sample for ftirther study
1233 Air Stripping Precipitated fUtered groundwater was aerated at 3 different air to
water ratios to evaluate the effectiveness of air stripping for the removal of volatUe organic
compounds in the groundwater Tables 1-12 and 1-13 shows the analytical results for
groundwater samples obtained from weUs MW-IA and ME-8 respectively No volatUe
organic compounds were detected in samples that were aerated at a 501 air to water ratio
Aeration of precipitated filtered groundwater obtained from weU ME-8 removed aU of the
vinyl chloride at an air to water ratio of 251
1234 Carbon Adsorption The effectiveness of carbon adsorption for the removal of
organic compounds in the groundwater was evaluated The analytical results are presented in
Table 1-14 At the lowest carbon dosage only 1 xg1 of cis-12-dichloroethene and
2 xg1 of trichloroethene remained No site-related volatUe organic compounds were detected
in samples which were treated with higher doses of carbon Toluene and
dibromochloromethane were detected in sample C-4 however these two compounds were
not detected in the raw groundwater and must therefore be a result of lab contamination
24 c
c TABLE 1-12 FULL SCALE TREATABILITY STUDY AIR STRIPPING RESULTS IN ugL FOR WELL MWIA
Methylene Chloride 10 u 4 U 5 U 5 U 4 U 4 U 2 U 4 U
cis-12-Dichloroethene 200 D 1 U 1 06 J 06 J 1 U 1 U 1 U
Chloroform 4 J 1 U 1 U 1 U 1 U 12 J 1 U 1 U
12-Dichloroethane 10 U 2 1 u 1 U 1 U 1 U 1 U 03 J
Carbon Tetrachloride 10 u 1 U 1 u 1 U 1 U 1 U 1 U 01 J
Trichloroethene 860 D 1 U 2 06 J 06 J 02 J 1 U 1 U
Toluene 10 U 020 J 1 U 1 U 1 U 007 J 25 1 U
Dibromochloromethane 10 U 1 U 1 U 1 U 1 U 1 U 14 1 U
Chlorobenzene 5 J 1 U 1 U 1 U 1 U 1 U 1 U 1 U
Ethylbenzene 10 U 1 U 1 U 1 U 1 U 1 U 1 U 1 U
Total Xylenes 1 J 1 U 1 U 1 U I U 1 U 1 U 1 U
Styrene 10 U 1 U 1 u 1 U 1 U 1 U 09 J 1 U
124-Trichloroben2ene 2400 D 4 1 u 1 U 1 U 1 U 1 U 1 U
123-Trichloroben2ene NA 5 1 u 1 U 1 U 1 U 1 U 1 U ^
SEMIVOLATILE ORG ANICS
Diethylphthalate 10 U 2 J 10 u 10 U 10 u Di-n-butylphthalate 10 U 1 J 10 u 10 U 10 u
Bis(2-ethylhexyl)phthal ate 10 U 10 U 10 u 4 J 2 J
Notes
Only volatile and semivolatile organics detected in any sample are included
No PCBs were detected in any effluent sample at a detection limit of 01 ugL influent was 36 J ugL
C-ID = Duplicate of C-1
U = Undetected at specified detection limit
J = Estimated value due to validation criteria
D = Duplicate
NA = Not Analyzed
= Value is for total 12-Dichlorocthene
i| f|iiiiiiiiiiiiiii^ti8ili| WSk
3 U 2 u 8 U
1 U 1 u 1 U
1 U 1 u 1 U
04 J 1 U 1 U
1 U 1 u 1 U
03 J 008 J 1 U
1 U 1 u 1 U
1 U 1 u 1 U
02 J 1 U 1 U
005 J 1 U 1 U
02 J OI J 1 u 1 U 1 U 1 u 1 U 1 U 1 u 1 U 1 U 1 u
10 U
10 u
2 J
27
c
The effectiveness of combining aeration and carbon adsorption to remove organic c contaminants was also investigated These results are also summarized in Table 1-15 No
organic compounds were detected m any of the samples generated during this investigation
124 Conclusions The results of the groundwater treatability study demonstrate that
treatment consisting of precipitation fUtration air stripping with vapor phase controls and
carbon adsorption appear able to meet cleanup levels estabUshed for the site Figure 1-3 is a
schematic representation of the proposed system The ROD stipulates that treated
groundwater wUl be reinjected to the aquifer onsite in this case MCLs are the cleanup
levels An altemative to be evaluated is discharging the treated groundwater to a surface
water body either Meadow Brook or the Neponset River In this case cleanup levels are
estabUshed as effluent discharge levels Effluent discharge levels are calculated by
multiplying the ambient water quaUty criteria (AWQC) values for each compound by a
dUution factor The dUution factor for the Neponset River is based on a 100-gpm treatment
discharge rate and a Neponset River 7010 of 2020 gpm The dUution factor for Meadow
Brook is 1 since the treatment discharge rate is greater than the flow of the brook therefore
effluent discharge levels for Meadow Brook are set at AWQC
Tables 1-16 through 1-19 compare effluent discharge levels for both the Neponset River and
Meadow Brook to carbon adsorption effluent from the groundwater treatability study
Table 1-16 summarizes the concentration of metals in untreated groundwater the metals
concentrations remaining foUowing precipitation and filtration the metals concentration
foUowing aeration and carbon adsorption the metals concentrations foUowing caition
adsorption only the MCLs and the effluent discharge levels based on discharge to the
Neponset River The only metal effluent concentration which exceeds the MCLs is
aluminum the MCL for aluminum however is a secondary MCL which is nonenforceable
No metals concentrations in the effluent exceed any of the effluent discharge levels
n 28
c TABLE 1-15 FULL-SCALE TREATABILITY STUDY AERATION AND CARBON ADSORPTION RESULTS Results in ugL
iiiiii|Mpt-HiiDiiii-iiiiii^iiiiiiiiiiii iii bullbullbull^(6-^1 iiiiii-iiiiiiiii iiiiiiiiii^g-2iiiiiiiiiii|i
l | | | ibyNigtii i i i i | i i i i i i i | ivi
VOLATILE ORGANICS
Mediylene Chloride 6 U 4 U Carbon Tetrachloride 1 U 01 J Toluene 02 J 1 u Total Xylenes 1 U 1 u Acetone 5 U 5 U 2-Butanone 5 U 5 U 2-Hexanone 5 U 5 U 4-Methy 1-2-pentanone 5 U 5 U Carbon Disulfide 1 U 1 U
c Notes Only volatile organics detected in any sample are included U = undetected at specified detection limit J = value is estimated due to validation criteria
iiiiiA61iiiiiiiiiiiii
3 U 1 U
02 J 01 J
5 U 5 J 5 U
5 U 1 U
i|AGii[ijiiifii
3 U U
01 J 1 U 5 U 5 U 5 U 5 U 1 U
i^^^iiiiiic|ii[|ili
10
1 u 1 u 1 u 5 U 5 J
5 U 5 U 1 U
29
c
o o o
o
Gas Phase GAC or Catalytic Oxidation
To ^ Ambient
Air
To Groundwater Recharge or
Raw Treated ) Neponset River Groundwater Groundwater Influent Holding Tank J
Solids for Offsite Disposal
(NOTE Air stripper not necessary if discharge to Neponset)
FIGURE 1-3 PROPOSED GROUNDWATER TREATMENT SYSTEM SCHEMATIC
2483JP
o n o TABLE 1-16 COMPARISON OF INORGANIC FULL-SCALE TREATABILITY STUDY RESULTS TO MCLS AND DISCHARGE LEVELS
[i^i^^^^ iiiiiiijiMf|iilaquo4 Precipitation Aeration and Carbon AdsorpUoi iiiiiiiiiiiiiiiiiiiiiiritliiiiin
iiiii iiSiiii|iiiiiiiiiiiiiiiii and Filtration M^ Iiiiiiiiiiiiii iiiiiiiii|iiii|i|iiiiiiiiiii liiiijlliiiii
iiiiiiiiiiiiiiiiiiiii iiiiiiiiiiiiii i i i i i i i|ii||iiiiiiiiiiiiiiiiiiiiiiiii iiiiiiiiiiiiiiiilii Giliii iiiii ii iiiii i iiiic iD|i laquoi|iiiiiiii iiiiitiiiiciiiiiiiiiiiii
Discharge levels calculated by multiplying AWQC by a dilution factor based on a 100 gpm treatment discharge rate and a Neponset River 7Q10 of 2020 gpm
U = Undetected at specified detection limit
J = Estimated value due to validation criteria
NC = No criteria exists for the compound
P = Proposed MCL
S = Secondary MCL
n n o TABLE 1-17 COMPARISON OF INORGANIC FULL-SCALE TREATABILITY STUDY RESULTS TO MCLS AND DISCHARGE LEVELS
DISCHARGE TO MEADOW BROOK
[isjiiiiiiiiiiiiiiii-ii |iiiiiiiiiiiiiiiiiiiiiiiiiiiiiiiiiiiiiiiiiiiiiii iiiiiiiiiiiiiiiiiiiiiiiiiiiiii iiiiiiiiiiiiiiiiiiiiiiii- iiiiiiiiiiiiiiiiiiiiiiiiiiiiiiiiii ^iiiiiiiiiiiiiiiiiiiiiiiiiiiiiiiiii bull immMmii^^ F- piiiipiiiiil i i i i i i i i i i i AcraUon and Caibon AdsorpUon iii iii iiii i i i i l l l i i i i i i ^ ^ i p t ^ sectffllM^ ^ ^
Ajumin iw u i 358 bull490 z ii 240 i--lJi iiiiiiiiiiiJ^3iiitJi i i iii i3 lliiiiiiiiii iiii|ii]^(Ciiiiiiiiiii-iii-iiiiiiii5iiiii-iiiiiiiiNC^ Antimony 2i ij NA 44 U i44 U 44 U 44 U 44 U 10 P 88 30 8600
Ariseiaic- iiiiiiiiiiiiiiiiiiiiii8iiiiiiiiiiiiiii iiiiiiiiii-iis- - iiiiiiiiii- 1 u 71 J i-iiiiiy3|ili-uj - i i i 9 l i j i iii--5Qiiiiiiiiiiiiii iiiiii NC- NC - iL | Barium 247 32 106 U 65 U 597 49 U 131 IJ 2006 NC NC NC
Blaquoay|Hiiraquosi-- bullbullbull--bull i-iiiii-iiiiii3iiiiiiliiiiiiii -iiiiiiiiiiiNAi-iiiiiii I u -- 1 U iiiiiiiiiliilliiiiii-ii|iyi- iiiii iiiiiiiiiiiiiiiiii ii|i|40 - 53-bullbull13|shyCadmium ( S i u bull bull bull bull bull bull bull bull bull N A 4 UJ 4 UJ bullr^^ 4UJ 4UJ 5 682 038 170 Cai lc turn i bull- iiiiii3PiOCfiii iiiiiiiiiiii iiiiiiiiii^iiiiiiiiiiiiii 9650 i 8360 iiii7886iiiiiiiiiiiiiiiiiiiiiiii^iiiiiiii-ii6^^ iiiiii5isNltiiiiiiiiiiiiiiiiiii iiiiiiNC NGi NC Chromium 315 NA 8 J 7 UJ 7 u j 7 uj 7 iirj 160 16 11 3206
CO i-iii-iiii 33iitiii-iiiiii ii-iiiii-i-Jfiiiiii--iiii - bull bull 4 U Z 4 U- iiiiiiiiiiiiiilii-uiiiiiiiiiiiiiiiiiiiiiii4iitjiii-iiiiiiiiiii4 iiiiii-ii Nltiiiiiiiiiiiiiiiiiiiiii i l i iNc-- -NCi^-NCi
P ^ i bull bull Copper 6 4 i NA 128 U 179 U bull64Uj 9 U --256--u-- 1300 48 36 NC
Jtaa- iiiiiiiiiiii ltJOlt iiiiiiiiiii isiiiiiiiJQiii-i - z 6AS U ii232U-^^ bulliiiiiiiiiiiiiiiiiiiiuiiiiiiiiiiiiiiiiiiiiiiiiiiiiiiiiiii2 ipit|iiiiii iiiiii3pQiiiiJiiiilii liiiNC- v 1000- bull- NCi head 253 5^U^ 35 U 46 U 21 U 12 U J 2^4 u 14 054 NCis |Magnlaquoaiuiai iiiiiiiiiiilaquo)6iiiiiiiiiiiii iiiiiiiiiiii|lS)6iiiiiiiiiiiiii 3700 7060i V^ bulliiiMiiiiiiiiiiiiiiiiiii3Jpiiiiiii7^0iiiii^^^ i iiigtKSiiiiiiiiiiiiiiii bulliii I N C bull N C Ncjii Manganese 4810 bull356 62 U 18 UJ 23 U 35 U 53 U 56 S NC NC 106
Wtercuryi iiiiiiiiiiiiiiiiiiiiiiiiyiiiMiiiiiii iiiiiiiiiiiiiiiiiNAiiiiiii i P-2 U bullbull 0 2 U-- iiiiiiiiiiiiiiiiOi|iiittiiiiiii|iiiii 6iiiiit|iiiiiiiiiiiiiQ|iit|iiiiii iiiii|i|iiiiiiiiiii iiii|iii24- -- oon --0i|i Nickel 281 isrA 181 UJ 244 UJ 269 uil 17 U 356 il 166 P 643 33 3800
Potraquoslaquolum -iiiiiiiiiii4liS0iiiiiiiiii iiiiiiiiiiiii PPQiiiiU i 2200 U i ii 2620 XT | |i |owiiyiiiiii | |(^iiiiiiiiiii^ iiiiiiiiiiiiiiiW|iiiiiiiiiiiiii iii iii|ip--i NC- bullbullbull-KCii Selenium 20 U NA 32 U 13 UJ 1 6 u 1 UJ i u 5 6 266 50 6800 Sflycri i-i- iiiiiiiiiiiiiiiiiiiiiiiiiiiiiiiiiiiiiii iiiiiiiiiiiiiiiiiii iiii- i-4U bull -^M- U iii bull i i i i | | i | | i i i i |-i i | i | l | i i i i | i i i i iiiii-i ^66iiiiiiiiiiiiiii i|iP37 -0i2iNi Sodium 1 2 3 6 6 6 9 5 5 6 6 99000 lOlOOO 99866 106066 74566 NC NC NC NC
I m iiiiiiiiiiiiiiiiiiiiii||jriiiiii||iii|i|iii|| | ii46Q ^40- -bull-3iThaUJiiiitt - iiiiiiiiiiiiiiiiiiiiiiiiiiliiiiiiiiii iiiiiiiiiiiiiiNAii- I UJ ^ iiiiiiiiiiiiiiiiii Vanadium 439 NA 5 U 83 UJ 5 U 5 IJ 0 IJJ NC NC NC NC
Ziiicii^ iiiiiiii-iiiii- 488iiiiiiiiiiiiii iiiiiiiiiiii6iiu 151 U 67 UJ iiiii iiiiiiiiiiiiiiiil52iU- iiiiiiiii2 liiiiiiiiiii iiJiOQ()ii- Siiiiiiii iiiiiiiiii|6 bull bull33 - N C i
Notes
Discharge levels are AWQC (10-5 risk) since the treatment discharge rate of 100 gpm is higher than the flowrate of Meadow Brook
U = Undetected at specified detection limit
J = Estimated value due to validation criteria
NC = No criteria eus ts for the compound
P = Proposed MCL
S = Secondary MCL
o n o TABLE 1-18 COMPARISON OF ORGANIC FULL-SCALE TREATABILITY STUDY RESULTS TO MCLS AND DISCHARGE LEVELS - DISCHARGE TO THE NEPONSET RIVER
||x|o | bull iiii||i||il|A iiiiii iiiiiiiiliiiiiiiiiiili ii5iiPo|laquo|o|i iii||l|i|i||ii||y E^ly1 C DoteslOO ii i^i|raquoiiipltii=(iiiii|iii iiii i i w i M w iiiiiiilliHiJLYiiii iiiiWiiiiii iiiiiiiiiiiiii ii iiiiiiiiiiiiiiiiiiii iiiiii iiii iiiiiiiiiii iiiiiiiiiiiiiiiiii iiiiiiiiiililiiiiiiiiiliiiiii bulliiiiii lagaiiiiiiiii iiiiiiiiiiiiiiiiiiiiiiiiiiiiiiiii (ugL) iiiiiiii^iiiiiiiiii iiiiiiiiiiiiipiiiii iiUiiiiiii^ WmnKiiiiiii i(iiiiiiii i iii iiiiiiiiiiMiiiiii VOLATILE ORGANICS
112-Trichlorocthane 5 J 25 U 1 u 1 u 1 U 1 u 1 u 5 NC NC 8904
1122-TetrachIororthane 16 J 25 U 1 u I u I U 1 u 1 u NC NC 50880 2332
Chloroform 4 J 25 U 1 u 1 u 1 U I u 1 u NC 612680 26288 3328
Vinyl Chloride 10 U 50 U I u 1 u 1 u 1 u 1 u 2 NC NC 111300
11-DichIoroethene 10 U 25 U 1 u 1 u 1 u I u 1 u 7 245920 0 403
12-Dichloroethene (total) 200 D 97 1 u 1 u 1 u 1 u 1 70 245920 NC 29680000
Trichloroethene 860 D 430 1 u I u 1 u 1 u 2 5 954000 464280 19504
Tetrachloroethene 5 J 25 U 1 u I u 1 u 1 u 1 u 5 111936 17808 1876
Xylenes (total) 1 J 25 U 1 u 1 u 01 J 1 u I u lOOOO NC NC NC
Chlorobenzene 5 J 25 U 1 u 1 u 1 u 1 u I U NC NC NC NC
SEMIVOLATILE ORGANICS
Pentachlorophenol 25 U ND 25 U 25 U 25 U 25 U 25 U I 424 276 NC
Chlorobenzenes(total) 5300 1060 NC
13-Dichlorobenzene 3 J 2 10 U 10 U 10 U 10 U 10 U 600 NC NC 55120
14-Dichlorobenzene 17 9 10 U 10 U 10 U 10 U 10 U 75 NC NC 55120
12-Dichlorobciizcne 7 J 5 10 U 10 U 10 U 10 U 10 U 600 NC NC 360400
124-Trichlorobenzene 2400 D 50 10 u 10 u 10 U 10 u 10 U 9 5300 1060 NC
PESTICIDESPCBS
Arocloi-1254 36 J 32 NA 01 u NA OI u NA 05 42 03 01
Heptachlor 0074 J NA NA NA NA NA NA 04 11 01 01
Aldrin 017 J NA NA NA NA NA NA NC 64 NC 002
Heptachlor Epoxide 0045 J NA NA NA NA NA NA 02 NC NC NC
gamma-Chlordane 0056 J NA NA NA NA NA NA 2 51 OI 01
Notes
Discharge levels calculated by multiplying AWQC (10-S risk) by a dilution factor based on a 100 gpm treatment discharge rate and a Neponset River 7Q10 of 2020 gpm
Compounds presented are only those detected in the untreated groundwater sample
NA = Not analyzed J = Estimated value due to validation criteria
NC = No criteria exists for the compound D = The reported value is from the diluted analysis
U = Undetected at specified detection limit P = Proposed MCL
o n o TABLE 1-19 COMPARISON OF ORGANIC FULL-SCALE TREATABILITY STUDY RESULTS TO MCLS AND DISCHARGE LEVELS - DISCHARGE TO MEADOW BROOK
i 1 liiiisisi i ii iii iii|i|i i l i 11 i |ii^^ i i i i i i i i iiiiiiiiiiiiiiiiii iiiiiiiiiiiiieiciidiiiiii iiiiiiiiiiiiii iiiiiliiiiiii^^iiiiii iiiiiiiiiiiiiiiiiiii iiliiiii i iiiiipiiiliiiiiiiliiii iiiiiiiiiiiiiiiiii iiiii|iii|i|i-iiiiii iiAVQiii|iiiii i ii-iiiiiiigt-iiii ^^
iiiiiiiiiiiiiiii iiiiiiiiiiiiiiiiiiiiiiiiiiiiii iiiiiiiiiiiiiiiiiiiiii I i i i i i i i i||i|i|||iiiiiiiiiiiiiiii|iiii iii-|iiilaquo|i3[i|ii |||^|ii^|i|^|iii i (3 i i ^ ^ l i i illjliii^jiii^ iieip|i(iii|i iiiiiiiiiiiiiiiiiiii i^|iii|(iiiijiii|)|r^ iiii-iiliiiiiiiiiiiii ||i |illlli|i i|li|i|ii iiiiiiiiiiiiiiiiii iiiiiiiiiii|tiiiiiiiiiiiiiiiiiii iiiiiiiiiiiifiiiiiiiiii iiiiiiiiiiiiiiiiilaquoiiiiiii iiiiiiiiiiilliiiiiiiiiiiiiiii i (laquoy^ iiiiiiiiiiiii(Wiiiiiiiii iiiiiiiii i lK^ iiiiiiiiliiiiiiiiiiiiiiiii (ugl)iii iiMiiiiiii VOLATILE ORGANICS
112-Trichloroethane 5 J 25 U 1 u 1 u 1 u 1 u 1 u 5 NC NC 420
1122-Tetrachloroethane 16 J 25 U 1 u 1 u 1 u 1 u 1 u NC NC 2400 110
Chloroform 4 J 25 U 1 u 1 u 1 u I u 1 u NC 28900 1240 157
Vinyl Chloride 10 u 50 U 1 u 1 u 1 u 1 u I u 2 NC NC 5250
11-Dichloroethene 10 u 25 U 1 u 1 u 1 u I u 1 u 7 11600 NC 19
12-Dichlorocthene (total) 200 D 97 1 u I u 1 u 1 u 1 70 11600 NC 1400000
Trichloroethene 860 D 430 1 u 1 u 1 u I u 2 5 45000 21900 920
Tetrachloroethene 5 J 25 U 1 u 1 u 1 u 1 u 1 U 5 5280 840 89
Xylenes (total) 1 J 25 U 1 u 1 u 01 J I u I U 10000 NC NC NC
Chlorobenzene 5 J 25 U 1 u 1 u 1 u 1 u I u NC NC NC NC
SEMIVOLATILE ORGANICS
Pentachlorophenol 25 U ND 25 U 25 U 25 U 25 U 25 U 1 20 13 NC
Chlorobenzenes(total) 250 50 NC
13-Dichlorobcnzene 3 J 2 10 U 10 U 10 u 10 U 10 U 600 NC NC 2600
14-Dichlorobenzene 17 9 10 U 10 U 10 u 10 U 10 U 75 NC NC 2600
12-Dichlorobenzene 7 J 5 10 U 10 U 10 u 10 U 10 U 600 NC NC 17000
124-Trichlorobenzene 2400 D 50 10 u 10 u 10 u 10 u 10 U 9 250 50 NC
PESTICIDESPCBS
Aroclor-1254 36 J 32 01 u 01 u OI u OI u NA 05 20 0014 00045
Heptachlor 0074 J NA NA NA NA NA NA 04 052 00038 00029
Aldrin 017 J NA NA NA NA NA NA NC 3 NC 000079
Heptachlor Epoxide 0045 J NA NA NA NA NA NA 02 NC NC NC
gamma-Chlordane | 0056 J NA NA NA NA NA NA 2 24 00043 00048
Notes
Discharge levels are AWQC (10-5 risk) since the treatment discharge rate of 100 gpm is higher than the flowrate of Meadow Brook
Compounds presented are only those detected in the untreated groundwater sample
NA = Not analyzed J = Estimated value due to validation criteria
NC = No criteria exists for the compound D = The reported value is from the diluted analysis
U = Undetected at specified detection limit P = Proposed MCL
Table 1-17 shows a comparison of effluent to effluent discharge levels based on discharge to c Meadow Brook assuming a dilution factor on one If the treated groundwater was discharged
to Meadow Brook effluent discharge levels for arsenic would be exceeded Since arsenic is
a difficult compound to remove in a groundwater treatment plant it is concluded that
Meadow Brook may not be usable as a discharge point
Table 1-18 presents concentrations of organic contaminants in untreated groundwater from
MW-IA the precipitated and filtered effluent the effluent following both aeration and
carbon and the effluent from carbon adsorption only These values are compared to MCLs
and effluent discharge levels Only one carbon dose for the carbon only study the lowest
dose of 05 g carbon1000 ml groundwater is shown as a conservative example In both
cases using aeration and carbon and carbon alone organic contaminants were removed to
below MCLs and to below discharge levels Therefore aeration at an air-to-water ratio of
251 and a carbon dose of 05 g carbon1000 ml groundwater effectively removed volatile
organics semivolatile organics and PCBs from the groundwater
c It is expected that a maximum air-to-water ratio at 251 will be effective for an air stripper
onsite because full-scale air strippers are many times more efficient than the bench scale
models This is due to the greater surface area and turbulence found in the stripper The
off-gas from the air stripper will have to be treated to meet applicable standards either by a
catalytic oxidation unit or a vapor phase carbon adsorption system
Since no vinyl chloride was present in MW-IA and vinyl chloride is a difficult compound to
remove with carbon adsorption tests were performed with groundwater from ME-8 which
contained 210 xg1 vinyl chloride These results were presented in Table 1-13 which shows
that air stripping at an air-to-water ratio of 251 is effective in removing vinyl chloride In
order to reach the MCL of 2 figl for vinyl chloride an air stripper is required Carbon
adsorption alone would not remove vinyl chloride down to the MCL If the treated
groundwater is discharged to the Neponset River instead of being reinjected an air stripper
to remove vinyl chloride is not necessary since the discharge level is 111300 xg1
35 c
Table 1-19 shows a comparison between the organic concentrations in treatability study c effluents and effluent discharge levels based on discharge to Meadow Brook All volatile and
semivolatile organic compounds are removed to the effluent discharge levels It is
impossible to determine if PCBs were effectively removed since the most stringent discharge
level is 0014 xgL and the detection limit in the study is 01 xgL Discharge to Meadow
Brook may not be feasible due to 1) the treatability study cannot prove that PCBs are
removed to effluent discharge levels and 2) arsenic concentrations in the treated effluent
were higher than effluent discharge levels (based on a dilution factor of one)
The preliminary results of the sludge analysis indicate that the sludge is nonhazardous under
RCRA and TSCA Once the fiill scale groundwater treatment system is on line samples of
the sludge should be reanalyzed to confirm the preliminary results and to further assess the
disposal options
In summary the results of the treatability study indicate that groimdwater from the Norwood
PCB site can be treated effectively to allow discharge to either the Neponset River or r gtlaquo^ reinjection back into the aquifer If treated groundwater is reinjected the treatment plant
must include an air stripper to remove vinyl chloride If treated groundwater is discharged
to the Neponset River an air stripper is not necessary to meet discharge levels however the
use of Best Available Technology (BAT) may be required which would necessitate the
inclusion of an air stripper A cost comparison between an air stripper combined with
liquid-phase carbon versus liquid-phase carbon alone was performed and reported in the
Modeling Report The conclusion was there is not a significant difference in cost the
present worth assuming a discount factor of 8 and a 16-year period of perfonnance was
135 vs 102 million dollars (see Volume 2 Section 3) These costs will be evaluated
further during the design phase of the project The efficiracy at the full scale plant can be
optimized to ensure that at no time will the effluent from the plant exceed any applicable
groundwater or surface water standard
36 C
Section Two
c
c
20 ROCKS
21 Introduction and Objectives
There are several sources of rocks potentially contaminated with PCBs present on the Grant
Gear property portion of the Norwood PCB site Three different sources of rocks were
collected for analysis from the Grant Gear property The three rock sources included
overburden rocks from a trench west of the Grant Gear facility and below the interim
remedial cap crushed stone from the interim remedial cap west of the Grant Gear facility
and pea stone from the upper and lower roofs of the Grant Gear facility Throughout this
section rocks collected from on top of the interim remedial cap will be referred to as cap
rocks and overburden rocks wUl be referred to as trench rocks The rock collected from the
roof were analyzed under Work Plan 1 and are discussed in the Building Investigation
Report
The objective of this portion of the predesign work was threefold
bull To determine the PCB contamination if any on the different sources of rocks
bull To assess the feasibility of dry tumbling as a remedial altemative for the rocks
bull To assess the feasibility of water washing as a remedial altemative for the rocks
The dry tumblingwater washing was conducted on rocks that were reported to be too large
to be remediated with overburden soils by the solvent extraction technique
22 Description of Work
Samples of the three sources of rocks were collected by Metcalf amp Eddy personnel on
January 8-10 1992 Refer to Figure 1-1 for the locations of the trench and the cap rock
37 c
sampling points The samples were delivered to ENSECO laboratory in Cambridge
c Massachusetts and stored in a refrigerator at 4degC prior to sample preparation and analysis
Metcalf amp Eddy performed the sample preparation portion of the PCB analysis Rock
samples were weighed and gently placed in precleaned two liter glass beakers A quality
control surrogate compound was then added to each sample or method blank for subsequent
percent recovery determination The rocks were then immersed in extraction solvent
consisting of 30 percent acetone and 70 percent hexane by volume iEach sample and blank
was heated to 50degC and intermittently swirled by hand for a thirty minute extraction time
The extracts were then dried using sodium sulfate concentrated to 10 milliliters final volume
and submitted to ENSECO for PCB analysis using EPA SW846 Method 8080
The trench rocks were divided into three size categories with average diameters of one inch
two inches and three inches The rock size is an important consideration for the solvent
extraction remediation technique
^s^^ The three trench rock sizes and six cap rock samples were analyzed initially to determine the
extent of PCB contamination As outlined in the Quality Assurance Project Plan a second
portion of the cap rock sample with the highest initial PCB concentration was subjected to
water washing remediation and analyzed for PCBs Separate portions of the trench rock
samples were subjected to dry tumbling for ten and thirty minute intervals and water washing
for ten and thirty minute intervals The remediated rocks were then analyzed for PCBs
The dry tumbling and water washing were performed using an electronic rotary device The
rock samples were placed in clean two liter plastic sampling containers with screw cap
closures Laboratory distilled deionized water was poured into the water wash test
containers while the dry tumble samples had only the rocks enclosed
38 c
c 23 RESULTS
The one-inch average diameter trench rocks were initially contaminated with 1800 mgkg of
Aroclor 1254 Because the one-inch trench rocks were above the 10 mgkg cleanup standard
sample portions of the rocks were processed step by step through each of the four
remediations Although an eighty five percent reduction in PCB contamination was achieved
between the initial and final remediation samples the final concentration of 270 mgkg is still
well above the cleanup standard The results however showed a trend with the highest
concentration of PCBs detected on the initial sample lower PCB concentrations with the
ten-minute remediation and the lowest PCB concentrations achieved with the longest
thirty-minute remediation as expected The results for the one-inch trench rocks are
presented in Table 2-1
The two-inch average diameter rocks showed results similar to those of the one inch size
The initial sample had a concentration of 2500 mgkg of Aroclor 1254 The best
remediation result obtained was 450 mgkg for the ten-minute water wash sample A thirty c minute water wash sample for the two-inch trench rocks was not conducted when it became
apparent that a 10 mgkg cleanup level could not be obtained Because the 10 mgkg cleanup
level was not achievable the thirty minute water washing of two-inch rocks was not
conducted to minimize the level of effort and analytical costs The PCB result for the
thirty-minute dry screened sample 1900 mgkg Aroclor 1254 was higher than expected
This result was counter to the trend that was expected and observed with the one-inch rocks
and it demonstrates the non-homogenous nature of the rock samples This trend breaking
analytical result caused by the heterogenous or nonuniform nature of the rock sample matrix
was not repeated because the cleanup level could not be achieved The results for the
two-inch trench rock samples are presented in Table 2-1
The three-inch average diameter trench rocks yielded markedly different analytical results
The initial sample prepared with minimal on- site screening had a PCB concentration of
75 mgkg below the cleanup standard of 10 mgkg Although the initial result was below
39 c
TABLE 2-1 TRENCH ROCK WASHING RESULTS
Trench Rocks 1 inch Average Diameter
PCB Concentration
Sample mgKg
Initial sample 1800
Ten minute dry screened 620
Ten minute water wash 880
Thirty minute dry screened 290
Thirty minute water wash 270
Trench Rocks 2 inch Average Diameter
PCB Concentration
Sample mgKg
Initial sample 2500
Ten minute dry screened 490
Ten minute water wash 450
Thirty minute dry screened 1900
Trench Rocks 3 inch Average Diameter
PCB Concentration Sample mgKg
Initial sample 750
Ten min dry screened 210
Ten min water wash 025 UJ
Aroclor 1254 was the only PCB detected UJ - The sample was nondetect for PCBs to the estimated detection limit
of 025 mgKg
40
the cleanup standard it was close enough to warrant the first ten minute dry tumble c remediation step The first remediation step with a PCB concentration of 21 mgkg
confirmed that the three-inch trench rocks are less contaminated than their smaller
counterparts The three-inch ten-minute water washed sample was not submitted for fiill
quality control PCB analysis in an effort to minimize analytical costs The ten-minute water
washed sample result is from a partial quality control PCB screening analysis and is reported
as estimated Because of the lag time in tumaround of analytical results this sample had
been prepared extracted and screened and the information was available therefore it is
presented herein The results for the three inch average diameter rocks are presented in
Table 2-1
Six samples of cap rocks were collected and analyzed for PCBs AU of the results were less
than 02 mgkg or 200 xgkg For these cap rock samples an action level of 50 xgkg was
established in the Quality Assurance Project Plan The 50 xgkg value is an action level
established by EPA for this study only and is not a cleanup level identified in the ROD The
action if the results exceeded 50 igkg was to water wash the most highly PCB contaminated c sample Water washing was performed on cap rock sample number two The initial result
for this sample was 150 xgkg while the ten minute water washed sample yielded 24 igkg
Aroclor 1254 The cap rock results showed fairly consistent PCB concentrations in the range
of 50 to 150 igkg Aroclor 1254 The results are presented in Table 2-2
24 CONCLUSIONS
The cap rock samples were all determined to have PCB concentrations approximately one
hundred times less than the cleanup level of 10 mgkg Water washing conducted on the
most contaminated cap rock sample removed approximately eighty five percent of the PCBs
initially present These cap rock samples contained some fine soil like material which was
perhaps windblown carried on tmck tires or created by friction This material contributed
to the measured PCB concentrations for the cap rock samples
41 c
c TABLE 2-2 INTERIM REMEDIAL CAP ROCKS ANALYTICAL RESULTS
LOCAiSifi iiiiiiiiiiiiiii--iiiiiiiiiiiiiiiiiiiiidiiiiiiliiiiiiiii^ 10 minute Water Wash iiiii|ijii|iiii|iii^ PCB Concentration (ligKg)
1 120 NA
2 150 24
3 110 NA
4 31 U NA
5 86 NA
6 71 NA
Notes Aroclor 1254 was the only PCB detected U - Sample was nondetect for PCBs to the reported
detection limit - The highest initial PCB concentration cap rock sample was
subjected to a ten minute water wash remediation
42
C
The results of the rock tumbling and water washing demonstrate that this form of remediation r will not achieve the cleanup level of 10 mgkg for the one-inch and two-inch average
diameter overburden rocks The three inch rocks are below the cleanup level without
remediation It should be noted that these overburden rock samples were coUected from one
of the most highly contaminated areas at the site based on the remedial investigation results
These samples therefore represent worst case conditions
The dry tumbling remediation steps did not remove aU of the adhered soU particles as
anticipated This adhered highly PCB contaminated soU contributed to the measured rock
surface PCB concentration because the PCBs were extracted from the soU as weU as the rock
surface during sample preparation
The water wash remediation was effective in removing aU of the adhered soU The results
indicate that the rock surface and near surfaces have been contaminated with PCBs which
cannot be removed by water washing but are extractable with acetonehexane
c During the trench rock coUection ample one-inch and two-inch average diameter rocks were
avaUable at shaUow depths The trench had to be dug deeper to obtain the three inch size
rocks Because of the relative immobiUty of PCBs in soU the PCB concentration decreases
with depth as reported in the remedial investigation This decrease in PCB concentration
with depth is part of the explanation as to why the three inch rocks showed less
contamination than the smaUer sizes Also a factor is the surface area to mass ratio As the
mass of the rock increases the surface area to mass ratio decreases Since the PCBs are on
the surface or near surface of the rocks as the relative surface area decreases with size or
mass the reported concentration wiU decrease correspondingly
During the trench excavation and overburden rock coUection a two- to three-inch lens of
dark oUy appearing materials was observed This material was analyzed with a PCB field
screening kit and found to contain in excess of 10000 mgkg PCBs Some of the one and
two-inch diameter rocks sampled appeared dark in color Because it was not known whether
43 c
c
the dark rocks were naturaUy colored or from the tarry lens and to keep the study unbiased
these dark rocks were sampled randomly with the remaining rocks The dark appearing
rocks were estimated to comprise approximately five percent of the one and two-inch rock
sizes Inclusion of highly contaminated rocks in the samples would boost the reported PCB
concentrations
Altemative remedial measures other than rock tumbUng and water washing include detergent
and water washing organic solvent washing or steam cleaning Although preUminary
indications from the solvent extraction vendors are that only up to one inch size rocks can be
handled the possibiUty of designing a treatment system to handle larger rocks wiU be
explored during the design phase of this project If the size of the rocks precludes them
from remediation by solvent extraction along with contaminated soUds a rock cmsher wiU be
employed to reduce the contaminated rocks to a size that can be handled Although other
altematives for rock remediation might work solvent extraction with contaminated soUs or
rock cmshing foUowed by solvent extraction appear to be the easiest most cost effective
means to achieve the cleanup standards Whichever remedial altemative is selected rock
washing would only be necessary on rocks with average diameters between one and two
inches coUected from soU highly contaminated with PCBs A very rough estimate of rocks
onsite between one- and two-inch diameters is approximately 5000 tons No remediation of
the rocks is necessary if the solvent extraction technology can handle two-inch size rocks
44 c
c TABLE 1-13 FULL-SCALE TREATABILITY STUDY AIR STRIPPING RESULTS FOR WELL ME-8 Results in ugL
iiiiiiiiiiliiiiiiiiiEiiDi-i^ iiiiililiiiiiiiElsiiii M E - 8 P P F ii i i ME-8PPFA i i-i-iiiiiiiiiiiil iiiiiii P r e c i p i t a t e d A W Ratio
| g sect | | U | D | | | | | | i | --- and Filtered iiiiiiii- 25l^-
VOLATILE ORGANICS
Vinyl Chloride 210 160 10 u
12-Dichloroethene(total) 350 270 5 U
Trichloroethene 670 450 5 U
Notes
Only volatile organic compounds detected in untreated groundwater from ME-8 are presented
U = Undetected at speciiied detection limit
^ shy
26
c TABLE 1-14 FULL-SCALE TREATABILITY STUDY CLP CARBON ADSORPTION RESULTS
Methylene Chloride 10 u 4 U 5 U 5 U 4 U 4 U 2 U 4 U
cis-12-Dichloroethene 200 D 1 U 1 06 J 06 J 1 U 1 U 1 U
Chloroform 4 J 1 U 1 U 1 U 1 U 12 J 1 U 1 U
12-Dichloroethane 10 U 2 1 u 1 U 1 U 1 U 1 U 03 J
Carbon Tetrachloride 10 u 1 U 1 u 1 U 1 U 1 U 1 U 01 J
Trichloroethene 860 D 1 U 2 06 J 06 J 02 J 1 U 1 U
Toluene 10 U 020 J 1 U 1 U 1 U 007 J 25 1 U
Dibromochloromethane 10 U 1 U 1 U 1 U 1 U 1 U 14 1 U
Chlorobenzene 5 J 1 U 1 U 1 U 1 U 1 U 1 U 1 U
Ethylbenzene 10 U 1 U 1 U 1 U 1 U 1 U 1 U 1 U
Total Xylenes 1 J 1 U 1 U 1 U I U 1 U 1 U 1 U
Styrene 10 U 1 U 1 u 1 U 1 U 1 U 09 J 1 U
124-Trichloroben2ene 2400 D 4 1 u 1 U 1 U 1 U 1 U 1 U
123-Trichloroben2ene NA 5 1 u 1 U 1 U 1 U 1 U 1 U ^
SEMIVOLATILE ORG ANICS
Diethylphthalate 10 U 2 J 10 u 10 U 10 u Di-n-butylphthalate 10 U 1 J 10 u 10 U 10 u
Bis(2-ethylhexyl)phthal ate 10 U 10 U 10 u 4 J 2 J
Notes
Only volatile and semivolatile organics detected in any sample are included
No PCBs were detected in any effluent sample at a detection limit of 01 ugL influent was 36 J ugL
C-ID = Duplicate of C-1
U = Undetected at specified detection limit
J = Estimated value due to validation criteria
D = Duplicate
NA = Not Analyzed
= Value is for total 12-Dichlorocthene
i| f|iiiiiiiiiiiiiii^ti8ili| WSk
3 U 2 u 8 U
1 U 1 u 1 U
1 U 1 u 1 U
04 J 1 U 1 U
1 U 1 u 1 U
03 J 008 J 1 U
1 U 1 u 1 U
1 U 1 u 1 U
02 J 1 U 1 U
005 J 1 U 1 U
02 J OI J 1 u 1 U 1 U 1 u 1 U 1 U 1 u 1 U 1 U 1 u
10 U
10 u
2 J
27
c
The effectiveness of combining aeration and carbon adsorption to remove organic c contaminants was also investigated These results are also summarized in Table 1-15 No
organic compounds were detected m any of the samples generated during this investigation
124 Conclusions The results of the groundwater treatability study demonstrate that
treatment consisting of precipitation fUtration air stripping with vapor phase controls and
carbon adsorption appear able to meet cleanup levels estabUshed for the site Figure 1-3 is a
schematic representation of the proposed system The ROD stipulates that treated
groundwater wUl be reinjected to the aquifer onsite in this case MCLs are the cleanup
levels An altemative to be evaluated is discharging the treated groundwater to a surface
water body either Meadow Brook or the Neponset River In this case cleanup levels are
estabUshed as effluent discharge levels Effluent discharge levels are calculated by
multiplying the ambient water quaUty criteria (AWQC) values for each compound by a
dUution factor The dUution factor for the Neponset River is based on a 100-gpm treatment
discharge rate and a Neponset River 7010 of 2020 gpm The dUution factor for Meadow
Brook is 1 since the treatment discharge rate is greater than the flow of the brook therefore
effluent discharge levels for Meadow Brook are set at AWQC
Tables 1-16 through 1-19 compare effluent discharge levels for both the Neponset River and
Meadow Brook to carbon adsorption effluent from the groundwater treatability study
Table 1-16 summarizes the concentration of metals in untreated groundwater the metals
concentrations remaining foUowing precipitation and filtration the metals concentration
foUowing aeration and carbon adsorption the metals concentrations foUowing caition
adsorption only the MCLs and the effluent discharge levels based on discharge to the
Neponset River The only metal effluent concentration which exceeds the MCLs is
aluminum the MCL for aluminum however is a secondary MCL which is nonenforceable
No metals concentrations in the effluent exceed any of the effluent discharge levels
n 28
c TABLE 1-15 FULL-SCALE TREATABILITY STUDY AERATION AND CARBON ADSORPTION RESULTS Results in ugL
iiiiii|Mpt-HiiDiiii-iiiiii^iiiiiiiiiiii iii bullbullbull^(6-^1 iiiiii-iiiiiiiii iiiiiiiiii^g-2iiiiiiiiiii|i
l | | | ibyNigtii i i i i | i i i i i i i | ivi
VOLATILE ORGANICS
Mediylene Chloride 6 U 4 U Carbon Tetrachloride 1 U 01 J Toluene 02 J 1 u Total Xylenes 1 U 1 u Acetone 5 U 5 U 2-Butanone 5 U 5 U 2-Hexanone 5 U 5 U 4-Methy 1-2-pentanone 5 U 5 U Carbon Disulfide 1 U 1 U
c Notes Only volatile organics detected in any sample are included U = undetected at specified detection limit J = value is estimated due to validation criteria
iiiiiA61iiiiiiiiiiiii
3 U 1 U
02 J 01 J
5 U 5 J 5 U
5 U 1 U
i|AGii[ijiiifii
3 U U
01 J 1 U 5 U 5 U 5 U 5 U 1 U
i^^^iiiiiic|ii[|ili
10
1 u 1 u 1 u 5 U 5 J
5 U 5 U 1 U
29
c
o o o
o
Gas Phase GAC or Catalytic Oxidation
To ^ Ambient
Air
To Groundwater Recharge or
Raw Treated ) Neponset River Groundwater Groundwater Influent Holding Tank J
Solids for Offsite Disposal
(NOTE Air stripper not necessary if discharge to Neponset)
FIGURE 1-3 PROPOSED GROUNDWATER TREATMENT SYSTEM SCHEMATIC
2483JP
o n o TABLE 1-16 COMPARISON OF INORGANIC FULL-SCALE TREATABILITY STUDY RESULTS TO MCLS AND DISCHARGE LEVELS
[i^i^^^^ iiiiiiijiMf|iilaquo4 Precipitation Aeration and Carbon AdsorpUoi iiiiiiiiiiiiiiiiiiiiiiritliiiiin
iiiii iiSiiii|iiiiiiiiiiiiiiiii and Filtration M^ Iiiiiiiiiiiiii iiiiiiiii|iiii|i|iiiiiiiiiii liiiijlliiiii
iiiiiiiiiiiiiiiiiiiii iiiiiiiiiiiiii i i i i i i i|ii||iiiiiiiiiiiiiiiiiiiiiiiii iiiiiiiiiiiiiiiilii Giliii iiiii ii iiiii i iiiic iD|i laquoi|iiiiiiii iiiiitiiiiciiiiiiiiiiiii
Discharge levels calculated by multiplying AWQC by a dilution factor based on a 100 gpm treatment discharge rate and a Neponset River 7Q10 of 2020 gpm
U = Undetected at specified detection limit
J = Estimated value due to validation criteria
NC = No criteria exists for the compound
P = Proposed MCL
S = Secondary MCL
n n o TABLE 1-17 COMPARISON OF INORGANIC FULL-SCALE TREATABILITY STUDY RESULTS TO MCLS AND DISCHARGE LEVELS
DISCHARGE TO MEADOW BROOK
[isjiiiiiiiiiiiiiiii-ii |iiiiiiiiiiiiiiiiiiiiiiiiiiiiiiiiiiiiiiiiiiiiiii iiiiiiiiiiiiiiiiiiiiiiiiiiiiii iiiiiiiiiiiiiiiiiiiiiiii- iiiiiiiiiiiiiiiiiiiiiiiiiiiiiiiiii ^iiiiiiiiiiiiiiiiiiiiiiiiiiiiiiiiii bull immMmii^^ F- piiiipiiiiil i i i i i i i i i i i AcraUon and Caibon AdsorpUon iii iii iiii i i i i l l l i i i i i i ^ ^ i p t ^ sectffllM^ ^ ^
Ajumin iw u i 358 bull490 z ii 240 i--lJi iiiiiiiiiiiJ^3iiitJi i i iii i3 lliiiiiiiiii iiii|ii]^(Ciiiiiiiiiii-iii-iiiiiiii5iiiii-iiiiiiiiNC^ Antimony 2i ij NA 44 U i44 U 44 U 44 U 44 U 10 P 88 30 8600
Ariseiaic- iiiiiiiiiiiiiiiiiiiiii8iiiiiiiiiiiiiii iiiiiiiiii-iis- - iiiiiiiiii- 1 u 71 J i-iiiiiy3|ili-uj - i i i 9 l i j i iii--5Qiiiiiiiiiiiiii iiiiii NC- NC - iL | Barium 247 32 106 U 65 U 597 49 U 131 IJ 2006 NC NC NC
Blaquoay|Hiiraquosi-- bullbullbull--bull i-iiiii-iiiiii3iiiiiiliiiiiiii -iiiiiiiiiiiNAi-iiiiiii I u -- 1 U iiiiiiiiiliilliiiiii-ii|iyi- iiiii iiiiiiiiiiiiiiiiii ii|i|40 - 53-bullbull13|shyCadmium ( S i u bull bull bull bull bull bull bull bull bull N A 4 UJ 4 UJ bullr^^ 4UJ 4UJ 5 682 038 170 Cai lc turn i bull- iiiiii3PiOCfiii iiiiiiiiiiii iiiiiiiiii^iiiiiiiiiiiiii 9650 i 8360 iiii7886iiiiiiiiiiiiiiiiiiiiiiii^iiiiiiii-ii6^^ iiiiii5isNltiiiiiiiiiiiiiiiiiii iiiiiiNC NGi NC Chromium 315 NA 8 J 7 UJ 7 u j 7 uj 7 iirj 160 16 11 3206
CO i-iii-iiii 33iitiii-iiiiii ii-iiiii-i-Jfiiiiii--iiii - bull bull 4 U Z 4 U- iiiiiiiiiiiiiilii-uiiiiiiiiiiiiiiiiiiiiiii4iitjiii-iiiiiiiiiii4 iiiiii-ii Nltiiiiiiiiiiiiiiiiiiiiii i l i iNc-- -NCi^-NCi
P ^ i bull bull Copper 6 4 i NA 128 U 179 U bull64Uj 9 U --256--u-- 1300 48 36 NC
Jtaa- iiiiiiiiiiii ltJOlt iiiiiiiiiii isiiiiiiiJQiii-i - z 6AS U ii232U-^^ bulliiiiiiiiiiiiiiiiiiiiuiiiiiiiiiiiiiiiiiiiiiiiiiiiiiiiiiii2 ipit|iiiiii iiiiii3pQiiiiJiiiilii liiiNC- v 1000- bull- NCi head 253 5^U^ 35 U 46 U 21 U 12 U J 2^4 u 14 054 NCis |Magnlaquoaiuiai iiiiiiiiiiilaquo)6iiiiiiiiiiiii iiiiiiiiiiii|lS)6iiiiiiiiiiiiii 3700 7060i V^ bulliiiMiiiiiiiiiiiiiiiiiii3Jpiiiiiii7^0iiiii^^^ i iiigtKSiiiiiiiiiiiiiiii bulliii I N C bull N C Ncjii Manganese 4810 bull356 62 U 18 UJ 23 U 35 U 53 U 56 S NC NC 106
Wtercuryi iiiiiiiiiiiiiiiiiiiiiiiiyiiiMiiiiiii iiiiiiiiiiiiiiiiiNAiiiiiii i P-2 U bullbull 0 2 U-- iiiiiiiiiiiiiiiiOi|iiittiiiiiii|iiiii 6iiiiit|iiiiiiiiiiiiiQ|iit|iiiiii iiiii|i|iiiiiiiiiii iiii|iii24- -- oon --0i|i Nickel 281 isrA 181 UJ 244 UJ 269 uil 17 U 356 il 166 P 643 33 3800
Potraquoslaquolum -iiiiiiiiiii4liS0iiiiiiiiii iiiiiiiiiiiii PPQiiiiU i 2200 U i ii 2620 XT | |i |owiiyiiiiii | |(^iiiiiiiiiii^ iiiiiiiiiiiiiiiW|iiiiiiiiiiiiii iii iii|ip--i NC- bullbullbull-KCii Selenium 20 U NA 32 U 13 UJ 1 6 u 1 UJ i u 5 6 266 50 6800 Sflycri i-i- iiiiiiiiiiiiiiiiiiiiiiiiiiiiiiiiiiiiiii iiiiiiiiiiiiiiiiiii iiii- i-4U bull -^M- U iii bull i i i i | | i | | i i i i |-i i | i | l | i i i i | i i i i iiiii-i ^66iiiiiiiiiiiiiii i|iP37 -0i2iNi Sodium 1 2 3 6 6 6 9 5 5 6 6 99000 lOlOOO 99866 106066 74566 NC NC NC NC
I m iiiiiiiiiiiiiiiiiiiiii||jriiiiii||iii|i|iii|| | ii46Q ^40- -bull-3iThaUJiiiitt - iiiiiiiiiiiiiiiiiiiiiiiiiiliiiiiiiiii iiiiiiiiiiiiiiNAii- I UJ ^ iiiiiiiiiiiiiiiiii Vanadium 439 NA 5 U 83 UJ 5 U 5 IJ 0 IJJ NC NC NC NC
Ziiicii^ iiiiiiii-iiiii- 488iiiiiiiiiiiiii iiiiiiiiiiii6iiu 151 U 67 UJ iiiii iiiiiiiiiiiiiiiil52iU- iiiiiiiii2 liiiiiiiiiii iiJiOQ()ii- Siiiiiiii iiiiiiiiii|6 bull bull33 - N C i
Notes
Discharge levels are AWQC (10-5 risk) since the treatment discharge rate of 100 gpm is higher than the flowrate of Meadow Brook
U = Undetected at specified detection limit
J = Estimated value due to validation criteria
NC = No criteria eus ts for the compound
P = Proposed MCL
S = Secondary MCL
o n o TABLE 1-18 COMPARISON OF ORGANIC FULL-SCALE TREATABILITY STUDY RESULTS TO MCLS AND DISCHARGE LEVELS - DISCHARGE TO THE NEPONSET RIVER
||x|o | bull iiii||i||il|A iiiiii iiiiiiiiliiiiiiiiiiili ii5iiPo|laquo|o|i iii||l|i|i||ii||y E^ly1 C DoteslOO ii i^i|raquoiiipltii=(iiiii|iii iiii i i w i M w iiiiiiilliHiJLYiiii iiiiWiiiiii iiiiiiiiiiiiii ii iiiiiiiiiiiiiiiiiiii iiiiii iiii iiiiiiiiiii iiiiiiiiiiiiiiiiii iiiiiiiiiililiiiiiiiiiliiiiii bulliiiiii lagaiiiiiiiii iiiiiiiiiiiiiiiiiiiiiiiiiiiiiiiii (ugL) iiiiiiii^iiiiiiiiii iiiiiiiiiiiiipiiiii iiUiiiiiii^ WmnKiiiiiii i(iiiiiiii i iii iiiiiiiiiiMiiiiii VOLATILE ORGANICS
112-Trichlorocthane 5 J 25 U 1 u 1 u 1 U 1 u 1 u 5 NC NC 8904
1122-TetrachIororthane 16 J 25 U 1 u I u I U 1 u 1 u NC NC 50880 2332
Chloroform 4 J 25 U 1 u 1 u 1 U I u 1 u NC 612680 26288 3328
Vinyl Chloride 10 U 50 U I u 1 u 1 u 1 u 1 u 2 NC NC 111300
11-DichIoroethene 10 U 25 U 1 u 1 u 1 u I u 1 u 7 245920 0 403
12-Dichloroethene (total) 200 D 97 1 u 1 u 1 u 1 u 1 70 245920 NC 29680000
Trichloroethene 860 D 430 1 u I u 1 u 1 u 2 5 954000 464280 19504
Tetrachloroethene 5 J 25 U 1 u I u 1 u 1 u 1 u 5 111936 17808 1876
Xylenes (total) 1 J 25 U 1 u 1 u 01 J 1 u I u lOOOO NC NC NC
Chlorobenzene 5 J 25 U 1 u 1 u 1 u 1 u I U NC NC NC NC
SEMIVOLATILE ORGANICS
Pentachlorophenol 25 U ND 25 U 25 U 25 U 25 U 25 U I 424 276 NC
Chlorobenzenes(total) 5300 1060 NC
13-Dichlorobenzene 3 J 2 10 U 10 U 10 U 10 U 10 U 600 NC NC 55120
14-Dichlorobenzene 17 9 10 U 10 U 10 U 10 U 10 U 75 NC NC 55120
12-Dichlorobciizcne 7 J 5 10 U 10 U 10 U 10 U 10 U 600 NC NC 360400
124-Trichlorobenzene 2400 D 50 10 u 10 u 10 U 10 u 10 U 9 5300 1060 NC
PESTICIDESPCBS
Arocloi-1254 36 J 32 NA 01 u NA OI u NA 05 42 03 01
Heptachlor 0074 J NA NA NA NA NA NA 04 11 01 01
Aldrin 017 J NA NA NA NA NA NA NC 64 NC 002
Heptachlor Epoxide 0045 J NA NA NA NA NA NA 02 NC NC NC
gamma-Chlordane 0056 J NA NA NA NA NA NA 2 51 OI 01
Notes
Discharge levels calculated by multiplying AWQC (10-S risk) by a dilution factor based on a 100 gpm treatment discharge rate and a Neponset River 7Q10 of 2020 gpm
Compounds presented are only those detected in the untreated groundwater sample
NA = Not analyzed J = Estimated value due to validation criteria
NC = No criteria exists for the compound D = The reported value is from the diluted analysis
U = Undetected at specified detection limit P = Proposed MCL
o n o TABLE 1-19 COMPARISON OF ORGANIC FULL-SCALE TREATABILITY STUDY RESULTS TO MCLS AND DISCHARGE LEVELS - DISCHARGE TO MEADOW BROOK
i 1 liiiisisi i ii iii iii|i|i i l i 11 i |ii^^ i i i i i i i i iiiiiiiiiiiiiiiiii iiiiiiiiiiiiieiciidiiiiii iiiiiiiiiiiiii iiiiiliiiiiii^^iiiiii iiiiiiiiiiiiiiiiiiii iiliiiii i iiiiipiiiliiiiiiiliiii iiiiiiiiiiiiiiiiii iiiii|iii|i|i-iiiiii iiAVQiii|iiiii i ii-iiiiiiigt-iiii ^^
iiiiiiiiiiiiiiii iiiiiiiiiiiiiiiiiiiiiiiiiiiiii iiiiiiiiiiiiiiiiiiiiii I i i i i i i i i||i|i|||iiiiiiiiiiiiiiii|iiii iii-|iiilaquo|i3[i|ii |||^|ii^|i|^|iii i (3 i i ^ ^ l i i illjliii^jiii^ iieip|i(iii|i iiiiiiiiiiiiiiiiiiii i^|iii|(iiiijiii|)|r^ iiii-iiliiiiiiiiiiiii ||i |illlli|i i|li|i|ii iiiiiiiiiiiiiiiiii iiiiiiiiiii|tiiiiiiiiiiiiiiiiiii iiiiiiiiiiiifiiiiiiiiii iiiiiiiiiiiiiiiiilaquoiiiiiii iiiiiiiiiiilliiiiiiiiiiiiiiii i (laquoy^ iiiiiiiiiiiii(Wiiiiiiiii iiiiiiiii i lK^ iiiiiiiiliiiiiiiiiiiiiiiii (ugl)iii iiMiiiiiii VOLATILE ORGANICS
112-Trichloroethane 5 J 25 U 1 u 1 u 1 u 1 u 1 u 5 NC NC 420
1122-Tetrachloroethane 16 J 25 U 1 u 1 u 1 u 1 u 1 u NC NC 2400 110
Chloroform 4 J 25 U 1 u 1 u 1 u I u 1 u NC 28900 1240 157
Vinyl Chloride 10 u 50 U 1 u 1 u 1 u 1 u I u 2 NC NC 5250
11-Dichloroethene 10 u 25 U 1 u 1 u 1 u I u 1 u 7 11600 NC 19
12-Dichlorocthene (total) 200 D 97 1 u I u 1 u 1 u 1 70 11600 NC 1400000
Trichloroethene 860 D 430 1 u 1 u 1 u I u 2 5 45000 21900 920
Tetrachloroethene 5 J 25 U 1 u 1 u 1 u 1 u 1 U 5 5280 840 89
Xylenes (total) 1 J 25 U 1 u 1 u 01 J I u I U 10000 NC NC NC
Chlorobenzene 5 J 25 U 1 u 1 u 1 u 1 u I u NC NC NC NC
SEMIVOLATILE ORGANICS
Pentachlorophenol 25 U ND 25 U 25 U 25 U 25 U 25 U 1 20 13 NC
Chlorobenzenes(total) 250 50 NC
13-Dichlorobcnzene 3 J 2 10 U 10 U 10 u 10 U 10 U 600 NC NC 2600
14-Dichlorobenzene 17 9 10 U 10 U 10 u 10 U 10 U 75 NC NC 2600
12-Dichlorobenzene 7 J 5 10 U 10 U 10 u 10 U 10 U 600 NC NC 17000
124-Trichlorobenzene 2400 D 50 10 u 10 u 10 u 10 u 10 U 9 250 50 NC
PESTICIDESPCBS
Aroclor-1254 36 J 32 01 u 01 u OI u OI u NA 05 20 0014 00045
Heptachlor 0074 J NA NA NA NA NA NA 04 052 00038 00029
Aldrin 017 J NA NA NA NA NA NA NC 3 NC 000079
Heptachlor Epoxide 0045 J NA NA NA NA NA NA 02 NC NC NC
gamma-Chlordane | 0056 J NA NA NA NA NA NA 2 24 00043 00048
Notes
Discharge levels are AWQC (10-5 risk) since the treatment discharge rate of 100 gpm is higher than the flowrate of Meadow Brook
Compounds presented are only those detected in the untreated groundwater sample
NA = Not analyzed J = Estimated value due to validation criteria
NC = No criteria exists for the compound D = The reported value is from the diluted analysis
U = Undetected at specified detection limit P = Proposed MCL
Table 1-17 shows a comparison of effluent to effluent discharge levels based on discharge to c Meadow Brook assuming a dilution factor on one If the treated groundwater was discharged
to Meadow Brook effluent discharge levels for arsenic would be exceeded Since arsenic is
a difficult compound to remove in a groundwater treatment plant it is concluded that
Meadow Brook may not be usable as a discharge point
Table 1-18 presents concentrations of organic contaminants in untreated groundwater from
MW-IA the precipitated and filtered effluent the effluent following both aeration and
carbon and the effluent from carbon adsorption only These values are compared to MCLs
and effluent discharge levels Only one carbon dose for the carbon only study the lowest
dose of 05 g carbon1000 ml groundwater is shown as a conservative example In both
cases using aeration and carbon and carbon alone organic contaminants were removed to
below MCLs and to below discharge levels Therefore aeration at an air-to-water ratio of
251 and a carbon dose of 05 g carbon1000 ml groundwater effectively removed volatile
organics semivolatile organics and PCBs from the groundwater
c It is expected that a maximum air-to-water ratio at 251 will be effective for an air stripper
onsite because full-scale air strippers are many times more efficient than the bench scale
models This is due to the greater surface area and turbulence found in the stripper The
off-gas from the air stripper will have to be treated to meet applicable standards either by a
catalytic oxidation unit or a vapor phase carbon adsorption system
Since no vinyl chloride was present in MW-IA and vinyl chloride is a difficult compound to
remove with carbon adsorption tests were performed with groundwater from ME-8 which
contained 210 xg1 vinyl chloride These results were presented in Table 1-13 which shows
that air stripping at an air-to-water ratio of 251 is effective in removing vinyl chloride In
order to reach the MCL of 2 figl for vinyl chloride an air stripper is required Carbon
adsorption alone would not remove vinyl chloride down to the MCL If the treated
groundwater is discharged to the Neponset River instead of being reinjected an air stripper
to remove vinyl chloride is not necessary since the discharge level is 111300 xg1
35 c
Table 1-19 shows a comparison between the organic concentrations in treatability study c effluents and effluent discharge levels based on discharge to Meadow Brook All volatile and
semivolatile organic compounds are removed to the effluent discharge levels It is
impossible to determine if PCBs were effectively removed since the most stringent discharge
level is 0014 xgL and the detection limit in the study is 01 xgL Discharge to Meadow
Brook may not be feasible due to 1) the treatability study cannot prove that PCBs are
removed to effluent discharge levels and 2) arsenic concentrations in the treated effluent
were higher than effluent discharge levels (based on a dilution factor of one)
The preliminary results of the sludge analysis indicate that the sludge is nonhazardous under
RCRA and TSCA Once the fiill scale groundwater treatment system is on line samples of
the sludge should be reanalyzed to confirm the preliminary results and to further assess the
disposal options
In summary the results of the treatability study indicate that groimdwater from the Norwood
PCB site can be treated effectively to allow discharge to either the Neponset River or r gtlaquo^ reinjection back into the aquifer If treated groundwater is reinjected the treatment plant
must include an air stripper to remove vinyl chloride If treated groundwater is discharged
to the Neponset River an air stripper is not necessary to meet discharge levels however the
use of Best Available Technology (BAT) may be required which would necessitate the
inclusion of an air stripper A cost comparison between an air stripper combined with
liquid-phase carbon versus liquid-phase carbon alone was performed and reported in the
Modeling Report The conclusion was there is not a significant difference in cost the
present worth assuming a discount factor of 8 and a 16-year period of perfonnance was
135 vs 102 million dollars (see Volume 2 Section 3) These costs will be evaluated
further during the design phase of the project The efficiracy at the full scale plant can be
optimized to ensure that at no time will the effluent from the plant exceed any applicable
groundwater or surface water standard
36 C
Section Two
c
c
20 ROCKS
21 Introduction and Objectives
There are several sources of rocks potentially contaminated with PCBs present on the Grant
Gear property portion of the Norwood PCB site Three different sources of rocks were
collected for analysis from the Grant Gear property The three rock sources included
overburden rocks from a trench west of the Grant Gear facility and below the interim
remedial cap crushed stone from the interim remedial cap west of the Grant Gear facility
and pea stone from the upper and lower roofs of the Grant Gear facility Throughout this
section rocks collected from on top of the interim remedial cap will be referred to as cap
rocks and overburden rocks wUl be referred to as trench rocks The rock collected from the
roof were analyzed under Work Plan 1 and are discussed in the Building Investigation
Report
The objective of this portion of the predesign work was threefold
bull To determine the PCB contamination if any on the different sources of rocks
bull To assess the feasibility of dry tumbling as a remedial altemative for the rocks
bull To assess the feasibility of water washing as a remedial altemative for the rocks
The dry tumblingwater washing was conducted on rocks that were reported to be too large
to be remediated with overburden soils by the solvent extraction technique
22 Description of Work
Samples of the three sources of rocks were collected by Metcalf amp Eddy personnel on
January 8-10 1992 Refer to Figure 1-1 for the locations of the trench and the cap rock
37 c
sampling points The samples were delivered to ENSECO laboratory in Cambridge
c Massachusetts and stored in a refrigerator at 4degC prior to sample preparation and analysis
Metcalf amp Eddy performed the sample preparation portion of the PCB analysis Rock
samples were weighed and gently placed in precleaned two liter glass beakers A quality
control surrogate compound was then added to each sample or method blank for subsequent
percent recovery determination The rocks were then immersed in extraction solvent
consisting of 30 percent acetone and 70 percent hexane by volume iEach sample and blank
was heated to 50degC and intermittently swirled by hand for a thirty minute extraction time
The extracts were then dried using sodium sulfate concentrated to 10 milliliters final volume
and submitted to ENSECO for PCB analysis using EPA SW846 Method 8080
The trench rocks were divided into three size categories with average diameters of one inch
two inches and three inches The rock size is an important consideration for the solvent
extraction remediation technique
^s^^ The three trench rock sizes and six cap rock samples were analyzed initially to determine the
extent of PCB contamination As outlined in the Quality Assurance Project Plan a second
portion of the cap rock sample with the highest initial PCB concentration was subjected to
water washing remediation and analyzed for PCBs Separate portions of the trench rock
samples were subjected to dry tumbling for ten and thirty minute intervals and water washing
for ten and thirty minute intervals The remediated rocks were then analyzed for PCBs
The dry tumbling and water washing were performed using an electronic rotary device The
rock samples were placed in clean two liter plastic sampling containers with screw cap
closures Laboratory distilled deionized water was poured into the water wash test
containers while the dry tumble samples had only the rocks enclosed
38 c
c 23 RESULTS
The one-inch average diameter trench rocks were initially contaminated with 1800 mgkg of
Aroclor 1254 Because the one-inch trench rocks were above the 10 mgkg cleanup standard
sample portions of the rocks were processed step by step through each of the four
remediations Although an eighty five percent reduction in PCB contamination was achieved
between the initial and final remediation samples the final concentration of 270 mgkg is still
well above the cleanup standard The results however showed a trend with the highest
concentration of PCBs detected on the initial sample lower PCB concentrations with the
ten-minute remediation and the lowest PCB concentrations achieved with the longest
thirty-minute remediation as expected The results for the one-inch trench rocks are
presented in Table 2-1
The two-inch average diameter rocks showed results similar to those of the one inch size
The initial sample had a concentration of 2500 mgkg of Aroclor 1254 The best
remediation result obtained was 450 mgkg for the ten-minute water wash sample A thirty c minute water wash sample for the two-inch trench rocks was not conducted when it became
apparent that a 10 mgkg cleanup level could not be obtained Because the 10 mgkg cleanup
level was not achievable the thirty minute water washing of two-inch rocks was not
conducted to minimize the level of effort and analytical costs The PCB result for the
thirty-minute dry screened sample 1900 mgkg Aroclor 1254 was higher than expected
This result was counter to the trend that was expected and observed with the one-inch rocks
and it demonstrates the non-homogenous nature of the rock samples This trend breaking
analytical result caused by the heterogenous or nonuniform nature of the rock sample matrix
was not repeated because the cleanup level could not be achieved The results for the
two-inch trench rock samples are presented in Table 2-1
The three-inch average diameter trench rocks yielded markedly different analytical results
The initial sample prepared with minimal on- site screening had a PCB concentration of
75 mgkg below the cleanup standard of 10 mgkg Although the initial result was below
39 c
TABLE 2-1 TRENCH ROCK WASHING RESULTS
Trench Rocks 1 inch Average Diameter
PCB Concentration
Sample mgKg
Initial sample 1800
Ten minute dry screened 620
Ten minute water wash 880
Thirty minute dry screened 290
Thirty minute water wash 270
Trench Rocks 2 inch Average Diameter
PCB Concentration
Sample mgKg
Initial sample 2500
Ten minute dry screened 490
Ten minute water wash 450
Thirty minute dry screened 1900
Trench Rocks 3 inch Average Diameter
PCB Concentration Sample mgKg
Initial sample 750
Ten min dry screened 210
Ten min water wash 025 UJ
Aroclor 1254 was the only PCB detected UJ - The sample was nondetect for PCBs to the estimated detection limit
of 025 mgKg
40
the cleanup standard it was close enough to warrant the first ten minute dry tumble c remediation step The first remediation step with a PCB concentration of 21 mgkg
confirmed that the three-inch trench rocks are less contaminated than their smaller
counterparts The three-inch ten-minute water washed sample was not submitted for fiill
quality control PCB analysis in an effort to minimize analytical costs The ten-minute water
washed sample result is from a partial quality control PCB screening analysis and is reported
as estimated Because of the lag time in tumaround of analytical results this sample had
been prepared extracted and screened and the information was available therefore it is
presented herein The results for the three inch average diameter rocks are presented in
Table 2-1
Six samples of cap rocks were collected and analyzed for PCBs AU of the results were less
than 02 mgkg or 200 xgkg For these cap rock samples an action level of 50 xgkg was
established in the Quality Assurance Project Plan The 50 xgkg value is an action level
established by EPA for this study only and is not a cleanup level identified in the ROD The
action if the results exceeded 50 igkg was to water wash the most highly PCB contaminated c sample Water washing was performed on cap rock sample number two The initial result
for this sample was 150 xgkg while the ten minute water washed sample yielded 24 igkg
Aroclor 1254 The cap rock results showed fairly consistent PCB concentrations in the range
of 50 to 150 igkg Aroclor 1254 The results are presented in Table 2-2
24 CONCLUSIONS
The cap rock samples were all determined to have PCB concentrations approximately one
hundred times less than the cleanup level of 10 mgkg Water washing conducted on the
most contaminated cap rock sample removed approximately eighty five percent of the PCBs
initially present These cap rock samples contained some fine soil like material which was
perhaps windblown carried on tmck tires or created by friction This material contributed
to the measured PCB concentrations for the cap rock samples
41 c
c TABLE 2-2 INTERIM REMEDIAL CAP ROCKS ANALYTICAL RESULTS
LOCAiSifi iiiiiiiiiiiiiii--iiiiiiiiiiiiiiiiiiiiidiiiiiiliiiiiiiii^ 10 minute Water Wash iiiii|ijii|iiii|iii^ PCB Concentration (ligKg)
1 120 NA
2 150 24
3 110 NA
4 31 U NA
5 86 NA
6 71 NA
Notes Aroclor 1254 was the only PCB detected U - Sample was nondetect for PCBs to the reported
detection limit - The highest initial PCB concentration cap rock sample was
subjected to a ten minute water wash remediation
42
C
The results of the rock tumbling and water washing demonstrate that this form of remediation r will not achieve the cleanup level of 10 mgkg for the one-inch and two-inch average
diameter overburden rocks The three inch rocks are below the cleanup level without
remediation It should be noted that these overburden rock samples were coUected from one
of the most highly contaminated areas at the site based on the remedial investigation results
These samples therefore represent worst case conditions
The dry tumbling remediation steps did not remove aU of the adhered soU particles as
anticipated This adhered highly PCB contaminated soU contributed to the measured rock
surface PCB concentration because the PCBs were extracted from the soU as weU as the rock
surface during sample preparation
The water wash remediation was effective in removing aU of the adhered soU The results
indicate that the rock surface and near surfaces have been contaminated with PCBs which
cannot be removed by water washing but are extractable with acetonehexane
c During the trench rock coUection ample one-inch and two-inch average diameter rocks were
avaUable at shaUow depths The trench had to be dug deeper to obtain the three inch size
rocks Because of the relative immobiUty of PCBs in soU the PCB concentration decreases
with depth as reported in the remedial investigation This decrease in PCB concentration
with depth is part of the explanation as to why the three inch rocks showed less
contamination than the smaUer sizes Also a factor is the surface area to mass ratio As the
mass of the rock increases the surface area to mass ratio decreases Since the PCBs are on
the surface or near surface of the rocks as the relative surface area decreases with size or
mass the reported concentration wiU decrease correspondingly
During the trench excavation and overburden rock coUection a two- to three-inch lens of
dark oUy appearing materials was observed This material was analyzed with a PCB field
screening kit and found to contain in excess of 10000 mgkg PCBs Some of the one and
two-inch diameter rocks sampled appeared dark in color Because it was not known whether
43 c
c
the dark rocks were naturaUy colored or from the tarry lens and to keep the study unbiased
these dark rocks were sampled randomly with the remaining rocks The dark appearing
rocks were estimated to comprise approximately five percent of the one and two-inch rock
sizes Inclusion of highly contaminated rocks in the samples would boost the reported PCB
concentrations
Altemative remedial measures other than rock tumbUng and water washing include detergent
and water washing organic solvent washing or steam cleaning Although preUminary
indications from the solvent extraction vendors are that only up to one inch size rocks can be
handled the possibiUty of designing a treatment system to handle larger rocks wiU be
explored during the design phase of this project If the size of the rocks precludes them
from remediation by solvent extraction along with contaminated soUds a rock cmsher wiU be
employed to reduce the contaminated rocks to a size that can be handled Although other
altematives for rock remediation might work solvent extraction with contaminated soUs or
rock cmshing foUowed by solvent extraction appear to be the easiest most cost effective
means to achieve the cleanup standards Whichever remedial altemative is selected rock
washing would only be necessary on rocks with average diameters between one and two
inches coUected from soU highly contaminated with PCBs A very rough estimate of rocks
onsite between one- and two-inch diameters is approximately 5000 tons No remediation of
the rocks is necessary if the solvent extraction technology can handle two-inch size rocks
44 c
c
c
20 ROCKS
21 Introduction and Objectives
There are several sources of rocks potentially contaminated with PCBs present on the Grant
Gear property portion of the Norwood PCB site Three different sources of rocks were
collected for analysis from the Grant Gear property The three rock sources included
overburden rocks from a trench west of the Grant Gear facility and below the interim
remedial cap crushed stone from the interim remedial cap west of the Grant Gear facility
and pea stone from the upper and lower roofs of the Grant Gear facility Throughout this
section rocks collected from on top of the interim remedial cap will be referred to as cap
rocks and overburden rocks wUl be referred to as trench rocks The rock collected from the
roof were analyzed under Work Plan 1 and are discussed in the Building Investigation
Report
The objective of this portion of the predesign work was threefold
bull To determine the PCB contamination if any on the different sources of rocks
bull To assess the feasibility of dry tumbling as a remedial altemative for the rocks
bull To assess the feasibility of water washing as a remedial altemative for the rocks
The dry tumblingwater washing was conducted on rocks that were reported to be too large
to be remediated with overburden soils by the solvent extraction technique
22 Description of Work
Samples of the three sources of rocks were collected by Metcalf amp Eddy personnel on
January 8-10 1992 Refer to Figure 1-1 for the locations of the trench and the cap rock
37 c
sampling points The samples were delivered to ENSECO laboratory in Cambridge
c Massachusetts and stored in a refrigerator at 4degC prior to sample preparation and analysis
Metcalf amp Eddy performed the sample preparation portion of the PCB analysis Rock
samples were weighed and gently placed in precleaned two liter glass beakers A quality
control surrogate compound was then added to each sample or method blank for subsequent
percent recovery determination The rocks were then immersed in extraction solvent
consisting of 30 percent acetone and 70 percent hexane by volume iEach sample and blank
was heated to 50degC and intermittently swirled by hand for a thirty minute extraction time
The extracts were then dried using sodium sulfate concentrated to 10 milliliters final volume
and submitted to ENSECO for PCB analysis using EPA SW846 Method 8080
The trench rocks were divided into three size categories with average diameters of one inch
two inches and three inches The rock size is an important consideration for the solvent
extraction remediation technique
^s^^ The three trench rock sizes and six cap rock samples were analyzed initially to determine the
extent of PCB contamination As outlined in the Quality Assurance Project Plan a second
portion of the cap rock sample with the highest initial PCB concentration was subjected to
water washing remediation and analyzed for PCBs Separate portions of the trench rock
samples were subjected to dry tumbling for ten and thirty minute intervals and water washing
for ten and thirty minute intervals The remediated rocks were then analyzed for PCBs
The dry tumbling and water washing were performed using an electronic rotary device The
rock samples were placed in clean two liter plastic sampling containers with screw cap
closures Laboratory distilled deionized water was poured into the water wash test
containers while the dry tumble samples had only the rocks enclosed
38 c
c 23 RESULTS
The one-inch average diameter trench rocks were initially contaminated with 1800 mgkg of
Aroclor 1254 Because the one-inch trench rocks were above the 10 mgkg cleanup standard
sample portions of the rocks were processed step by step through each of the four
remediations Although an eighty five percent reduction in PCB contamination was achieved
between the initial and final remediation samples the final concentration of 270 mgkg is still
well above the cleanup standard The results however showed a trend with the highest
concentration of PCBs detected on the initial sample lower PCB concentrations with the
ten-minute remediation and the lowest PCB concentrations achieved with the longest
thirty-minute remediation as expected The results for the one-inch trench rocks are
presented in Table 2-1
The two-inch average diameter rocks showed results similar to those of the one inch size
The initial sample had a concentration of 2500 mgkg of Aroclor 1254 The best
remediation result obtained was 450 mgkg for the ten-minute water wash sample A thirty c minute water wash sample for the two-inch trench rocks was not conducted when it became
apparent that a 10 mgkg cleanup level could not be obtained Because the 10 mgkg cleanup
level was not achievable the thirty minute water washing of two-inch rocks was not
conducted to minimize the level of effort and analytical costs The PCB result for the
thirty-minute dry screened sample 1900 mgkg Aroclor 1254 was higher than expected
This result was counter to the trend that was expected and observed with the one-inch rocks
and it demonstrates the non-homogenous nature of the rock samples This trend breaking
analytical result caused by the heterogenous or nonuniform nature of the rock sample matrix
was not repeated because the cleanup level could not be achieved The results for the
two-inch trench rock samples are presented in Table 2-1
The three-inch average diameter trench rocks yielded markedly different analytical results
The initial sample prepared with minimal on- site screening had a PCB concentration of
75 mgkg below the cleanup standard of 10 mgkg Although the initial result was below
39 c
TABLE 2-1 TRENCH ROCK WASHING RESULTS
Trench Rocks 1 inch Average Diameter
PCB Concentration
Sample mgKg
Initial sample 1800
Ten minute dry screened 620
Ten minute water wash 880
Thirty minute dry screened 290
Thirty minute water wash 270
Trench Rocks 2 inch Average Diameter
PCB Concentration
Sample mgKg
Initial sample 2500
Ten minute dry screened 490
Ten minute water wash 450
Thirty minute dry screened 1900
Trench Rocks 3 inch Average Diameter
PCB Concentration Sample mgKg
Initial sample 750
Ten min dry screened 210
Ten min water wash 025 UJ
Aroclor 1254 was the only PCB detected UJ - The sample was nondetect for PCBs to the estimated detection limit
of 025 mgKg
40
the cleanup standard it was close enough to warrant the first ten minute dry tumble c remediation step The first remediation step with a PCB concentration of 21 mgkg
confirmed that the three-inch trench rocks are less contaminated than their smaller
counterparts The three-inch ten-minute water washed sample was not submitted for fiill
quality control PCB analysis in an effort to minimize analytical costs The ten-minute water
washed sample result is from a partial quality control PCB screening analysis and is reported
as estimated Because of the lag time in tumaround of analytical results this sample had
been prepared extracted and screened and the information was available therefore it is
presented herein The results for the three inch average diameter rocks are presented in
Table 2-1
Six samples of cap rocks were collected and analyzed for PCBs AU of the results were less
than 02 mgkg or 200 xgkg For these cap rock samples an action level of 50 xgkg was
established in the Quality Assurance Project Plan The 50 xgkg value is an action level
established by EPA for this study only and is not a cleanup level identified in the ROD The
action if the results exceeded 50 igkg was to water wash the most highly PCB contaminated c sample Water washing was performed on cap rock sample number two The initial result
for this sample was 150 xgkg while the ten minute water washed sample yielded 24 igkg
Aroclor 1254 The cap rock results showed fairly consistent PCB concentrations in the range
of 50 to 150 igkg Aroclor 1254 The results are presented in Table 2-2
24 CONCLUSIONS
The cap rock samples were all determined to have PCB concentrations approximately one
hundred times less than the cleanup level of 10 mgkg Water washing conducted on the
most contaminated cap rock sample removed approximately eighty five percent of the PCBs
initially present These cap rock samples contained some fine soil like material which was
perhaps windblown carried on tmck tires or created by friction This material contributed
to the measured PCB concentrations for the cap rock samples
41 c
c TABLE 2-2 INTERIM REMEDIAL CAP ROCKS ANALYTICAL RESULTS
LOCAiSifi iiiiiiiiiiiiiii--iiiiiiiiiiiiiiiiiiiiidiiiiiiliiiiiiiii^ 10 minute Water Wash iiiii|ijii|iiii|iii^ PCB Concentration (ligKg)
1 120 NA
2 150 24
3 110 NA
4 31 U NA
5 86 NA
6 71 NA
Notes Aroclor 1254 was the only PCB detected U - Sample was nondetect for PCBs to the reported
detection limit - The highest initial PCB concentration cap rock sample was
subjected to a ten minute water wash remediation
42
C
The results of the rock tumbling and water washing demonstrate that this form of remediation r will not achieve the cleanup level of 10 mgkg for the one-inch and two-inch average
diameter overburden rocks The three inch rocks are below the cleanup level without
remediation It should be noted that these overburden rock samples were coUected from one
of the most highly contaminated areas at the site based on the remedial investigation results
These samples therefore represent worst case conditions
The dry tumbling remediation steps did not remove aU of the adhered soU particles as
anticipated This adhered highly PCB contaminated soU contributed to the measured rock
surface PCB concentration because the PCBs were extracted from the soU as weU as the rock
surface during sample preparation
The water wash remediation was effective in removing aU of the adhered soU The results
indicate that the rock surface and near surfaces have been contaminated with PCBs which
cannot be removed by water washing but are extractable with acetonehexane
c During the trench rock coUection ample one-inch and two-inch average diameter rocks were
avaUable at shaUow depths The trench had to be dug deeper to obtain the three inch size
rocks Because of the relative immobiUty of PCBs in soU the PCB concentration decreases
with depth as reported in the remedial investigation This decrease in PCB concentration
with depth is part of the explanation as to why the three inch rocks showed less
contamination than the smaUer sizes Also a factor is the surface area to mass ratio As the
mass of the rock increases the surface area to mass ratio decreases Since the PCBs are on
the surface or near surface of the rocks as the relative surface area decreases with size or
mass the reported concentration wiU decrease correspondingly
During the trench excavation and overburden rock coUection a two- to three-inch lens of
dark oUy appearing materials was observed This material was analyzed with a PCB field
screening kit and found to contain in excess of 10000 mgkg PCBs Some of the one and
two-inch diameter rocks sampled appeared dark in color Because it was not known whether
43 c
c
the dark rocks were naturaUy colored or from the tarry lens and to keep the study unbiased
these dark rocks were sampled randomly with the remaining rocks The dark appearing
rocks were estimated to comprise approximately five percent of the one and two-inch rock
sizes Inclusion of highly contaminated rocks in the samples would boost the reported PCB
concentrations
Altemative remedial measures other than rock tumbUng and water washing include detergent
and water washing organic solvent washing or steam cleaning Although preUminary
indications from the solvent extraction vendors are that only up to one inch size rocks can be
handled the possibiUty of designing a treatment system to handle larger rocks wiU be
explored during the design phase of this project If the size of the rocks precludes them
from remediation by solvent extraction along with contaminated soUds a rock cmsher wiU be
employed to reduce the contaminated rocks to a size that can be handled Although other
altematives for rock remediation might work solvent extraction with contaminated soUs or
rock cmshing foUowed by solvent extraction appear to be the easiest most cost effective
means to achieve the cleanup standards Whichever remedial altemative is selected rock
washing would only be necessary on rocks with average diameters between one and two
inches coUected from soU highly contaminated with PCBs A very rough estimate of rocks
onsite between one- and two-inch diameters is approximately 5000 tons No remediation of
the rocks is necessary if the solvent extraction technology can handle two-inch size rocks
44 c
c
the dark rocks were naturaUy colored or from the tarry lens and to keep the study unbiased
these dark rocks were sampled randomly with the remaining rocks The dark appearing
rocks were estimated to comprise approximately five percent of the one and two-inch rock
sizes Inclusion of highly contaminated rocks in the samples would boost the reported PCB
concentrations
Altemative remedial measures other than rock tumbUng and water washing include detergent
and water washing organic solvent washing or steam cleaning Although preUminary
indications from the solvent extraction vendors are that only up to one inch size rocks can be
handled the possibiUty of designing a treatment system to handle larger rocks wiU be
explored during the design phase of this project If the size of the rocks precludes them
from remediation by solvent extraction along with contaminated soUds a rock cmsher wiU be
employed to reduce the contaminated rocks to a size that can be handled Although other
altematives for rock remediation might work solvent extraction with contaminated soUs or
rock cmshing foUowed by solvent extraction appear to be the easiest most cost effective
means to achieve the cleanup standards Whichever remedial altemative is selected rock
washing would only be necessary on rocks with average diameters between one and two
inches coUected from soU highly contaminated with PCBs A very rough estimate of rocks
onsite between one- and two-inch diameters is approximately 5000 tons No remediation of
the rocks is necessary if the solvent extraction technology can handle two-inch size rocks